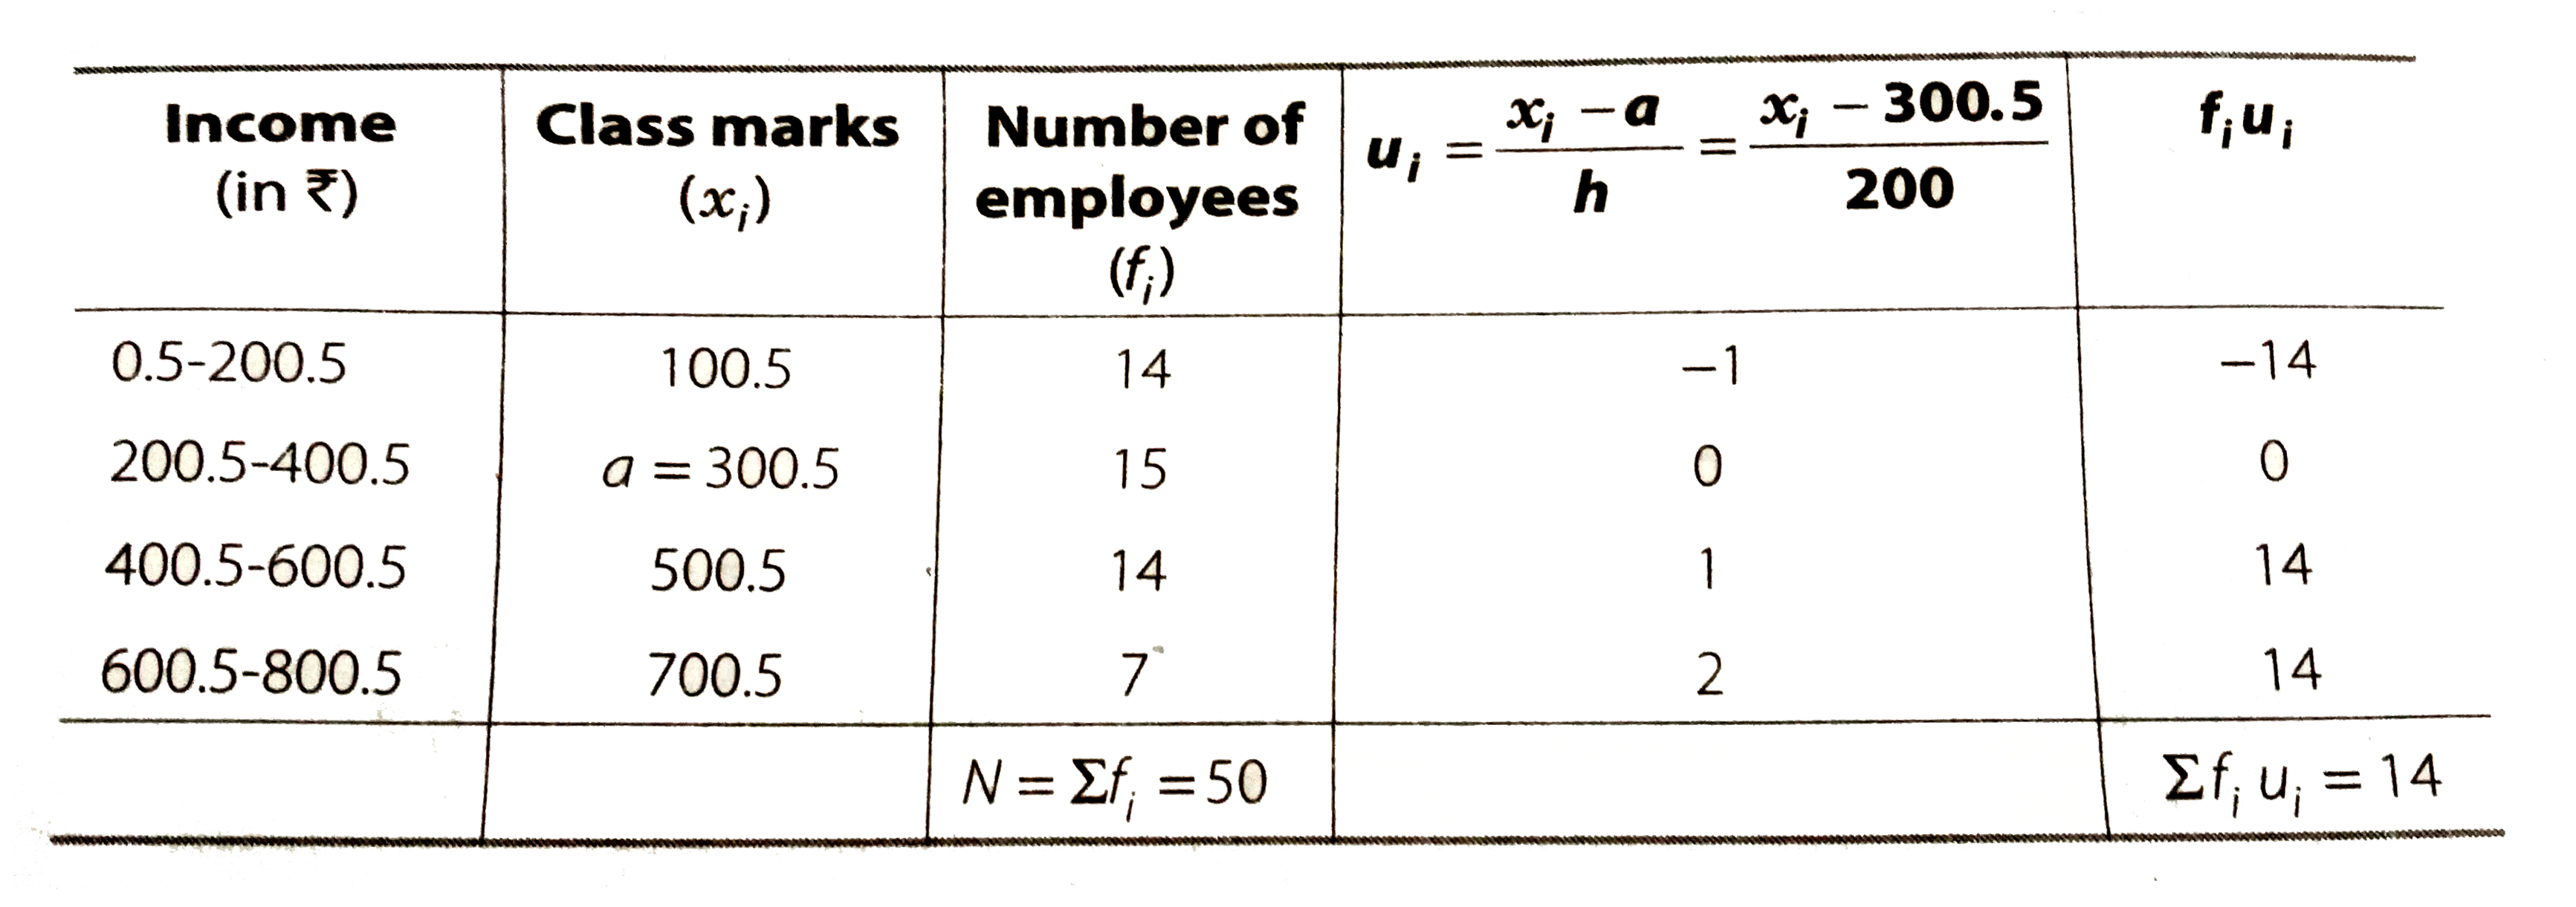
The daily income of a sample of 50 employees are tabulated as follows.

Find the mean daily income of employees.
Since, given data is not continuous, so we substract 0.5 from the lower limit and add 0.5 in the upper limit of each class. Now we first, the class mark xi of each class and then proceed as follows

∴Assumed mean,a=300.5
Class width, h=200
and total observation, N=50
By step deivation method,
Mean=a+h×1N×5∑i=1fiui
300.5+200×150×14
=300.5+56=356.50
Topper's Solved these Questions
- STATISTICS AND PROBABILITYBOOK - NCERT EXEMPLAR ENGLISHCHAPTER - STATISTICS AND PROBABILITYEXERCISE - LONG ASWERS QUESTIONS
14 Videos
- STATISTICS AND PROBABILITYBOOK - NCERT EXEMPLAR ENGLISHCHAPTER - STATISTICS AND PROBABILITYEXERCISE - VERY SHORT ANSWERS QUESTIONS
14 Videos
- REAL NUMBERSBOOK - NCERT EXEMPLAR ENGLISHCHAPTER - REAL NUMBERSEXERCISE - LONG ANSWER TYPE QUESTIONS
5 Videos
- SURFACE AREAS AND VOLUMESBOOK - NCERT EXEMPLAR ENGLISHCHAPTER - SURFACE AREAS AND VOLUMESEXERCISE - LONG ANSWER TYPE QUESTIONS
20 Videos
Similar Questions
12% of the employees in a factory are females and the number of male employees is 264. Find the total number of employees. Also, find the number of female employees.
View SolutionThe average (arithmetic mean ) salary of employees at an advertising firm with P employees in thousands of dollars is 53, and the average salary of employees at an advertising firmwith Q employees in thousands of dollar is 95. When the salaries of both firms are combined, the average salary in thousands of dollars is 83. What is hte value of pq?
View Solution
Knowledge Check
A group of 30 employees of Cadre A has a mean age of 27. A different group of 70 employees of Cadre B has a mean age of 23. What is the mean age of the employees of the two group togeters?
A23B24.2C25D26.8
The frequency chart above shows number of absences for employees for a small business in a given year. The total number of employees was 43 . The following year , the employees are the same , and two employees are picked at random for an interview . What is the probability that both employees were absent between 11 and 14 times the previous year ?A243B1543C543D0.11640% of the employees in a factory are workers. All the remaining employees are executives .The annual income of each worder is $390. The annual income of each executive is $420. What is the average annual incomes of all the employees in the factory together?
A390B405C408D415
The mean and S.D. of the income of the employers of two banks are as follows:

Compare the coefficient of variation of the income of the employees of the two banks.
View SolutionConsider the following distribution of daily wages of 50 workers of a factory.Find the mean daily wages of the workers of the factor}- by using an appropriate method.
View SolutionTwo sample sizes of 50 and 100 are given . The mean of these samples respectively are 56 and 50. Find the mean of the size 150 by combining the two samples.
View SolutionThe mileage (km per litre) of 50 cars of the same model was tested by a manufacture and details are tabulated as given below

Find the mean mileage. The manufacture claimed that the mileage of the model was 16 kmL. Do you agree with this claim?
View SolutionTwo samples of sizes 50 and 100 are given. The means of these samples respectively are 56 and 50 find the mean of size 150 by combining the two samples.
View Solution
