The following data shows the expenditure of a person on different items during a month. Represent the data by a pie-chart. Items of expenditure, Rent, Education, Food, Clothing, Others Amount (in Rs.), 2700, 1800, 2400, 1500, 2400
Step by step video & image solution for The following data shows the expenditure of a person on different items during a month. Represent the data by a pie-chart. Items of expenditure, Rent, Education, Food, Clothing, Others Amount (in Rs.), 2700, 1800, 2400, 1500, 2400 by Maths experts to help you in doubts & scoring excellent marks in Class 8 exams.
Topper's Solved these Questions
Similar Questions
The following table shows the expenditure of a family whose monthly income is * 22,000.Represent the above data by a pie chart.
View SolutionThe following table shows the monthly expenditure of different families on different items :

Represent the data in the form of a sub-divided bar diagram.View Solution
Knowledge Check
- Question 1 - Select One or More
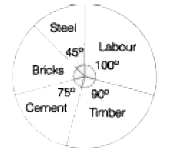
The following pie chart represents a total expenditure of 540000 on different items in constructing a flat in a town. The expenditure (inT)on cement is
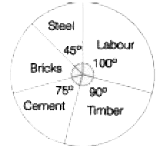 A75000B90000C135000D112500
 - Question 2 - Select One
The following pie chart represents a total expenditure of 540000 on different items in constructing a flat in a town. The expenditure (in ?) on bricks is
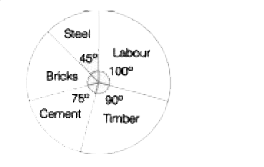 A75000B67500C150000D70000
 - Question 3 - Select One
The following pie chart represents a total expenditure of 540000 on different items in constructing a flat in a town. The expenditure on bricks is less than the expenditure on timber (in ?)
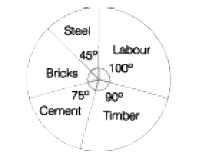 A10000B12500C60000D65000
The following pie chart represents a total expenditure of 540000 on different items in constructing a flat in a town. Which is the item of maximum expenditure?
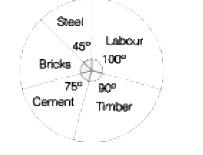 View Solution
The following table shows the household expenditure of family on different items. Draw a pie chart to represent the given data.
ItemRentFoodClotingEducationOthersExpenditure25%30%10%15%20%View SolutionThe following table shows how a student spends his pocket money during the course of a month. Represent it by a pie-diagram. Items, Food, Entertainment, Other expenditure, Savings Expenditure, 40%, 25%, 20%, 15%
View SolutionDraw a pie-diagram for the following data of expenditure pattern in a family: Items, Food, Clothing, Rent, Edu, Misc. Expenditure (in Rs) 4000, 2000, 1500, 1500, 1000
View SolutionThe following pie chart represents a total expenditure of 540000 on different items in constructing a flat in a town. The percentage of the total expenditure spent on steel and cement is
 View Solution

