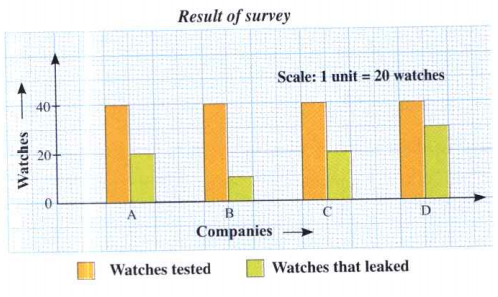
The following graph shows the result of a survey to test water resistant watches made by four different companies. Read the graph and answer the following question.
What is the fraction of the number of watches that leaked to the number testd for each company?
To solve the problem of finding the fraction of the number of watches that leaked to the number tested for each company, we will follow these steps:
Step 1: Identify the number of watches tested and leaked for each company.
- Company A: 40 tested, 20 leaked
- Company B: 40 tested, 10 leaked
- Company C: 40 tested, 15 leaked
- Company D: 40 tested, 22 leaked
Step 2: Calculate the fraction for each company.
The fraction can be calculated using the formula:
Fraction=Number of watches leakedNumber of watches tested
Company A:
- Leaked: 20
- Tested: 40
Fraction for Company A=2040=12
Company B:
- Leaked: 10
- Tested: 40
Fraction for Company B=1040=14
Company C:
- Leaked: 15
- Tested: 40
Fraction for Company C=1540=38
Company D:
- Leaked: 22
- Tested: 40
Fraction for Company D=2240=1120
Step 3: Summarize the results.
- Company A: 12
- Company B: 14
- Company C: 38
- Company D: 1120
Final Answer:
- The fractions of the number of watches that leaked to the number tested for each company are:
- Company A: 12
- Company B: 14
- Company C: 38
- Company D: 1120
---
- Company A: 40 tested, 20 leaked
- Company B: 40 tested, 10 leaked
- Company C: 40 tested, 15 leaked
- Company D: 40 tested, 22 leaked
The fraction can be calculated using the formula:
Fraction=Number of watches leakedNumber of watches tested
- Leaked: 20
- Tested: 40
Fraction for Company A=2040=12
- Leaked: 10
- Tested: 40
Fraction for Company B=1040=14
- Leaked: 15
- Tested: 40
Fraction for Company C=1540=38
- Leaked: 22
- Tested: 40
Fraction for Company D=2240=1120
- Company A: 12
- Company B: 14
- Company C: 38
- Company D: 1120
- The fractions of the number of watches that leaked to the number tested for each company are:
- Company A: 12
- Company B: 14
- Company C: 38
- Company D: 1120
Topper's Solved these Questions
- DATA HANDLING AND MEASURES OF CENTRAL TENDENCYBOOK - ICSECHAPTER - DATA HANDLING AND MEASURES OF CENTRAL TENDENCYEXERCISE - EXERCIES 18.1
37 Videos
- DATA HANDLING AND MEASURES OF CENTRAL TENDENCYBOOK - ICSECHAPTER - DATA HANDLING AND MEASURES OF CENTRAL TENDENCYEXERCISE - EXERCIES 18.2
16 Videos
- CONSTRUCTIONS BOOK - ICSECHAPTER - CONSTRUCTIONS EXERCISE - REVISION EXERCISE
12 Videos
- DATA HANDLING BOOK - ICSECHAPTER - DATA HANDLING EXERCISE - EXERCISE 24D
13 Videos
Similar Questions
The following graph shows the result of a survey to test water resistant watches made by four different companies. Read the graph and answer the following question.
Which company has the best watches?
View SolutionThe following graph shows the result of a survey to test water resistant watches made by four different companies. Read the graph and answer the following question.
Which company has the worst watches?

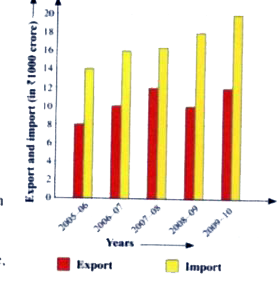
View SolutionRead the bar graph and answer the following questions.
What information is given by the bar graph?
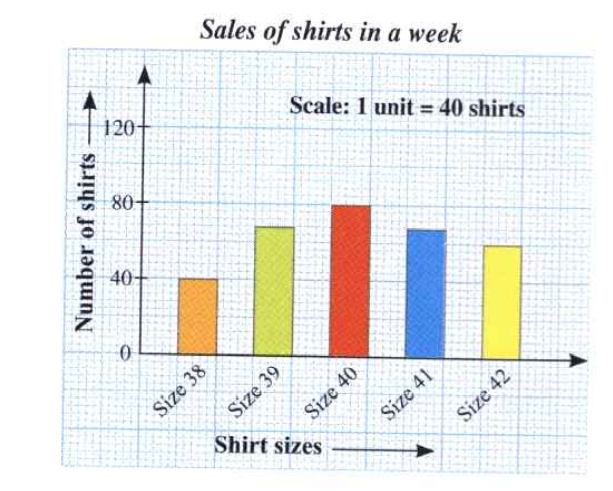
View SolutionRead the following graph and answer the following question.
What are the different sizes of shirts that are sold?
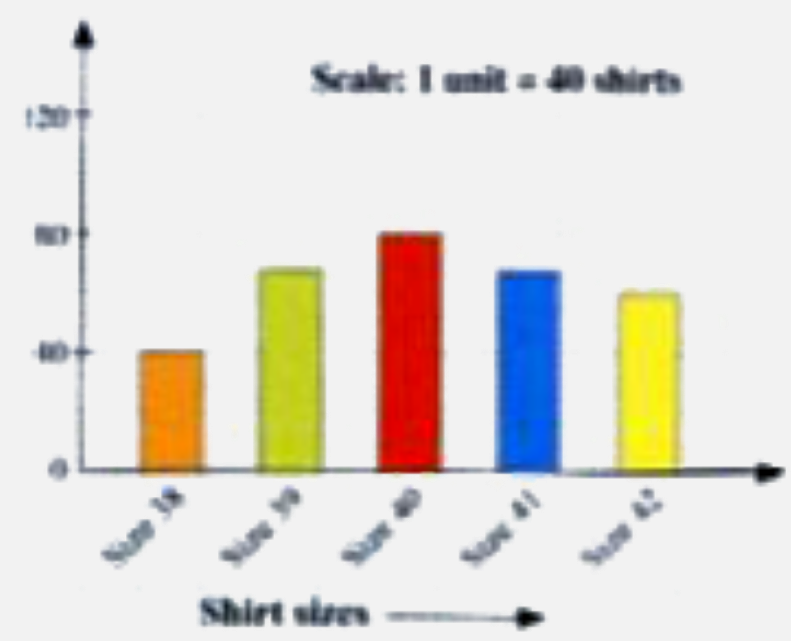
View SolutionRead the following graph and answer the following question.
Find the ratio of the number of shirts of size 38 sold to the number of shirts of size 42 sold.
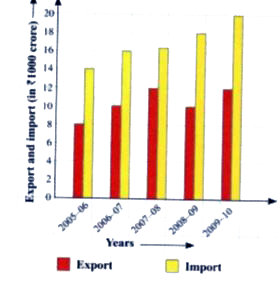
View SolutionRead the bar graph and answer the following questions.
In which year the difference of the values of export and import is maximum?
View SolutionObserve the bar graph given below :
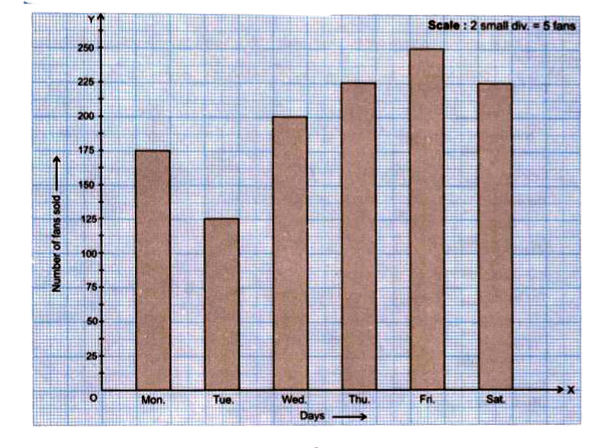
Read the bar graph carefully and answer the following questions :
What is the ratio between the minimum sale and the maximum sale?
View SolutionObserve the bar graph given below :
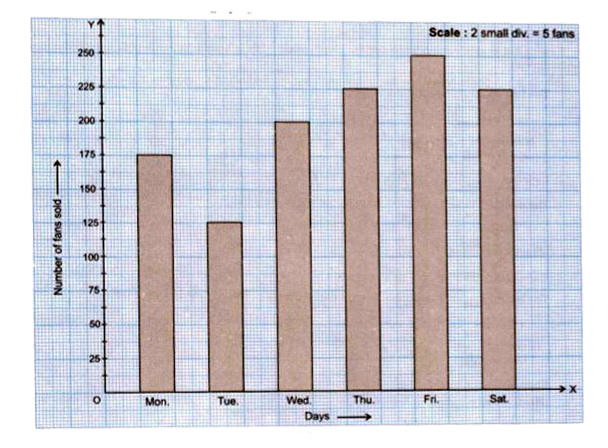
Read the bar graph carefully and answer the following questions :
What information is given by the bar graph?
View SolutionObserve the bar graph given below :
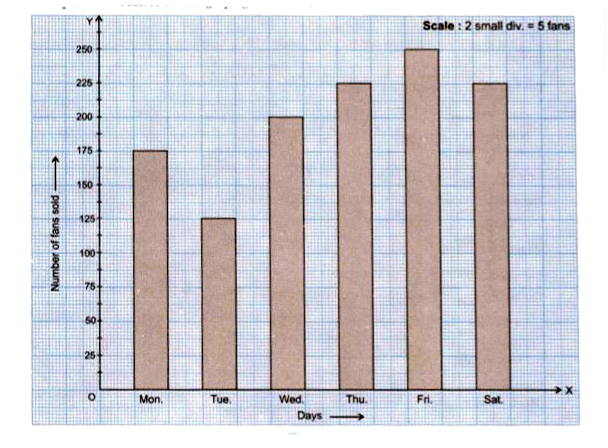
Read the bar graph carefully and answer the following questions :
What was the total sale during the week?
View SolutionThe following bar graph represents the data for different sizes of shoes worn by the students in a school. Read the graph and answer the following questions.
(i)What are the different numbers of the shoe-worn by the students?
(ii)What is the number of students wearing shoe No. 6?
(iii)Which shoe number is worn by the maximum number of students?
(iv)Which shoe number is worn by the minimum number of students?
View Solution
