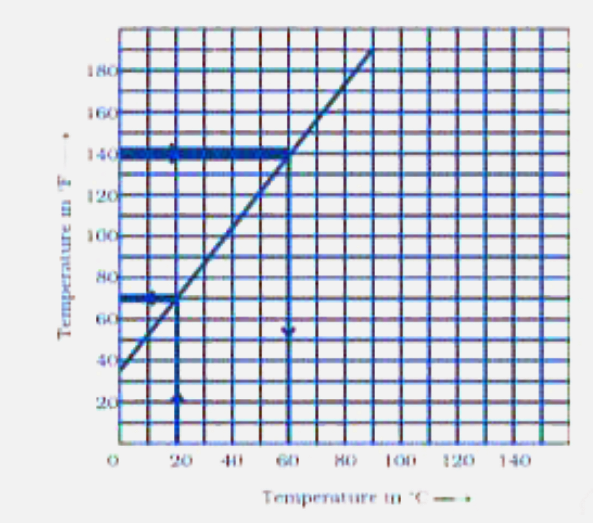
The following is the conversion graph of temperature in ∘C and ∘F.

Use the graph to answer the questions given below :
(i) Convert 140∘F to ∘C.
(ii) Convert 20∘C to ∘F.
Step by step video & image solution for The following is the conversion graph of temperature in "^(@)C and "^(@)F. Use the graph to answer the questions given below : (i) Convert 140^(@)F to "^(@)C. (ii) Convert 20^(@)C to "^(@)F. by Maths experts to help you in doubts & scoring excellent marks in Class 8 exams.
Updated on:21/07/2023Topper's Solved these Questions
- LINE GRAPHS AND LINEAR GRAPHSBOOK - RS AGGARWALCHAPTER - LINE GRAPHS AND LINEAR GRAPHSEXERCISE - Exercise 23
25 Videos
- INTRODUCTION TO COORDINATE GEOMETRYBOOK - RS AGGARWALCHAPTER - INTRODUCTION TO COORDINATE GEOMETRYEXERCISE - EXERCISE B (OBJECTIVE QUESTIONS)
7 Videos
- LINEAR EQUATIONSBOOK - RS AGGARWALCHAPTER - LINEAR EQUATIONSEXERCISE - TEST PAPER-8 (D) (Write .T. for true and .F. for false for each of the following:)
1 Videos
Similar Questions
The following is a conversion graph of temperature in ∘Cand∘F.
Use the graph to answer the following questions.
(a0 Convert 140∘F to ∘C.
(b) Convert 20∘C to ∘F
View SolutionConvert 95∘F to ∘C
View SolutionThe graphs of f and g are given. Answer the questions
View SolutionRefer to the following figures and answer the questions given below:
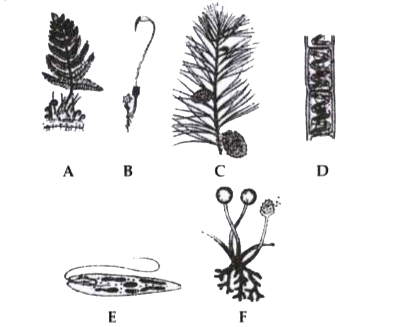
Identify figures A to F.
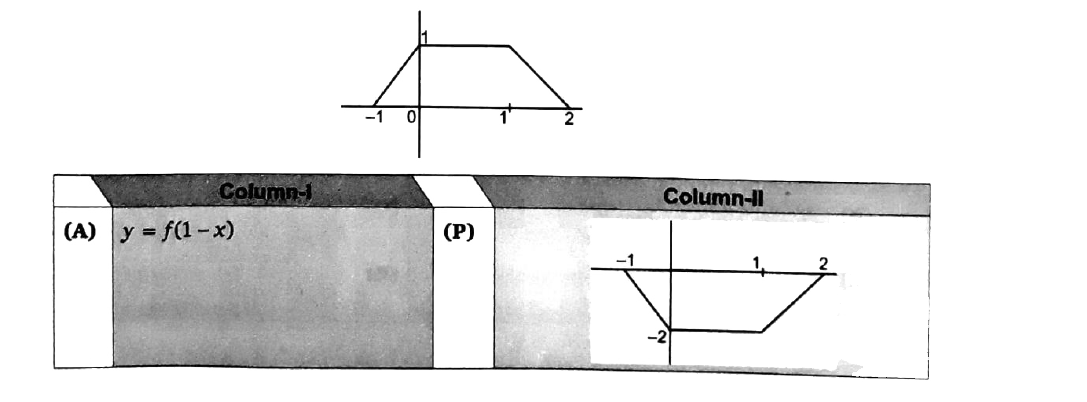
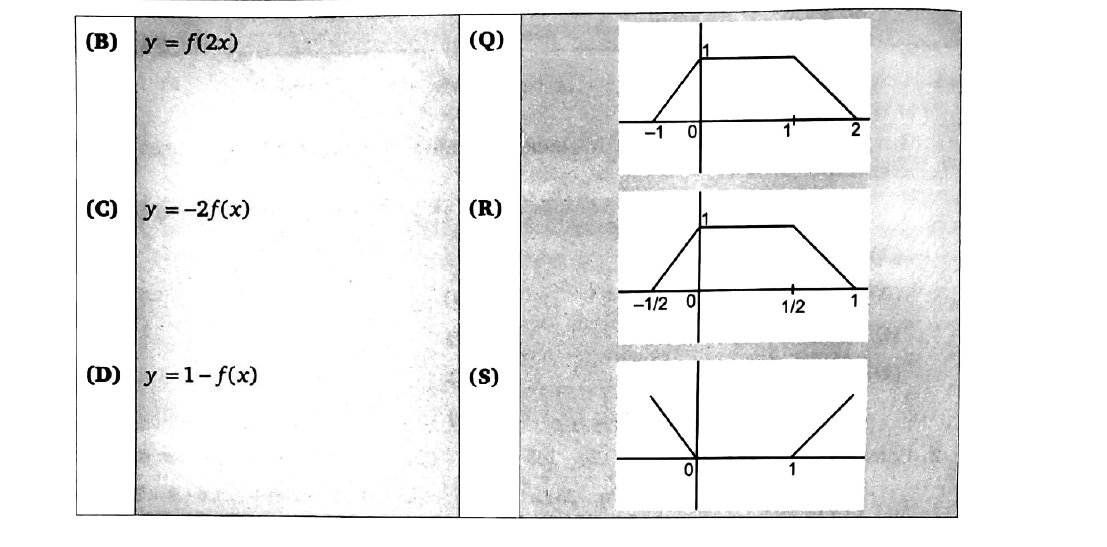
View SolutionGiven the graph of y=f(x)
View Solutionthe graph of a function f is given. Answer the following questions
View SolutionConsider the following function f whose graph is given below.
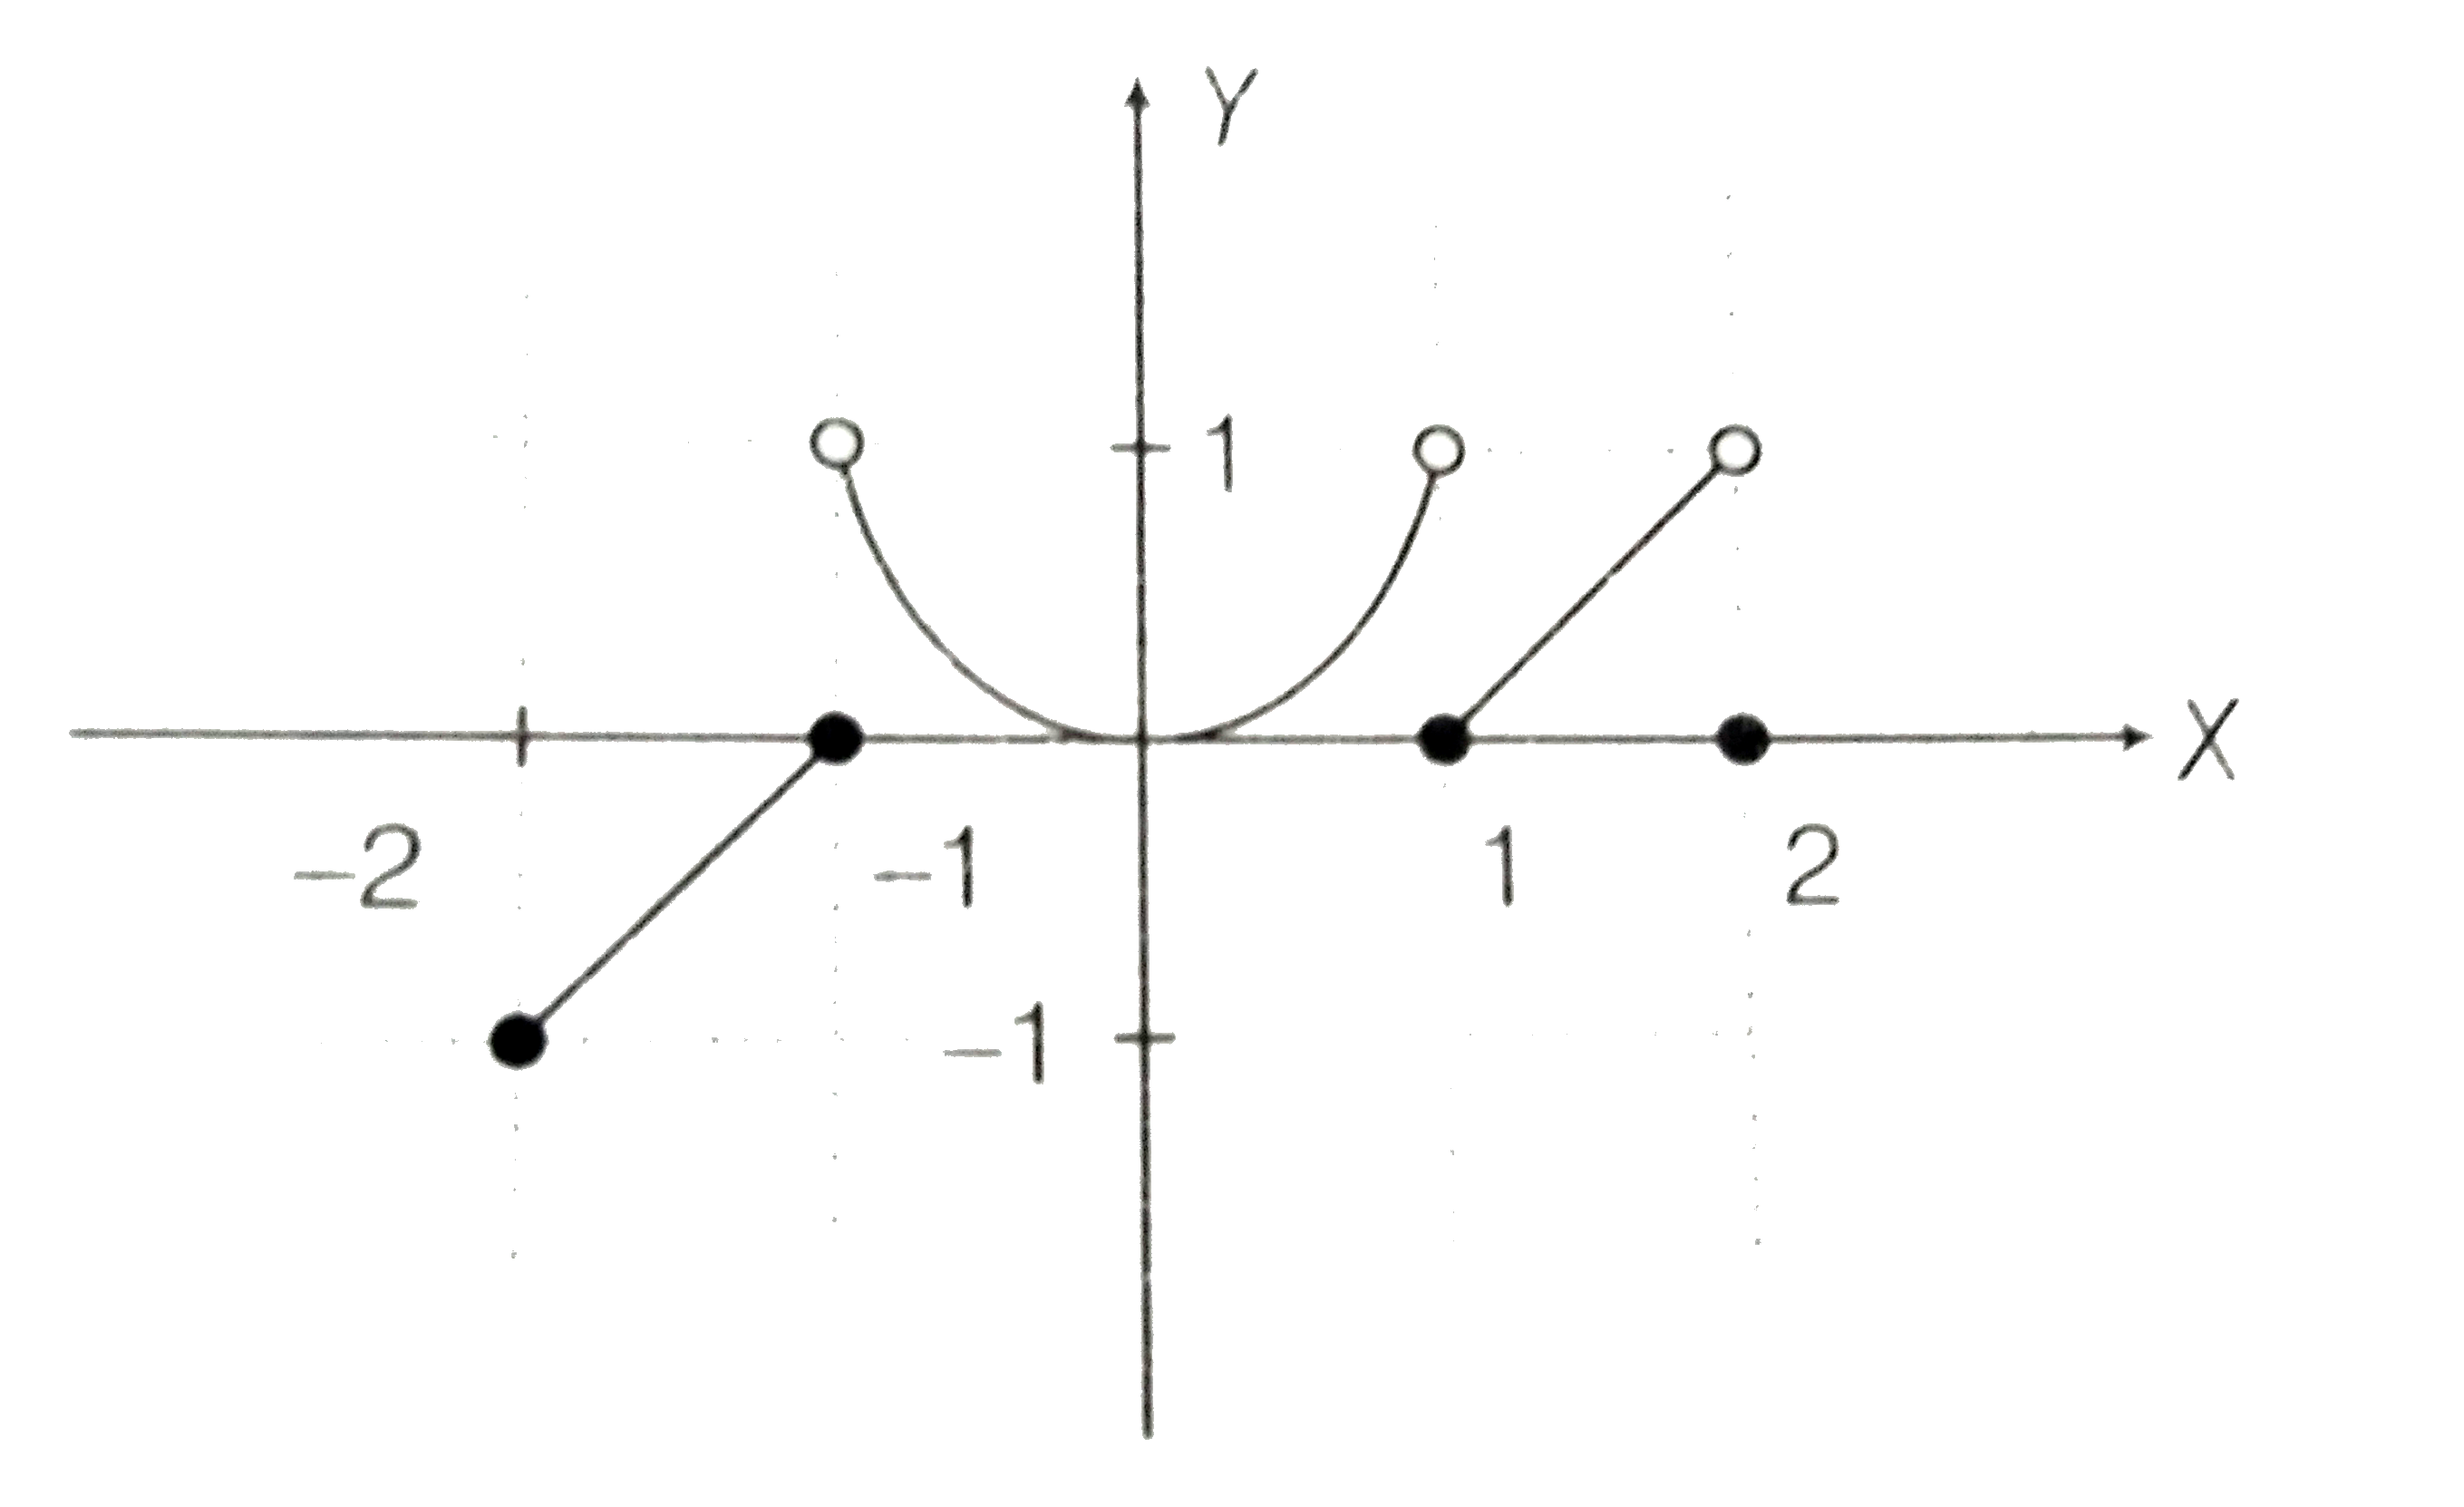
View SolutionSolve the following inequalities using graph of f(x):
View SolutionTemperature of a gas is 98.6∘F. Convert this into Kelvin.
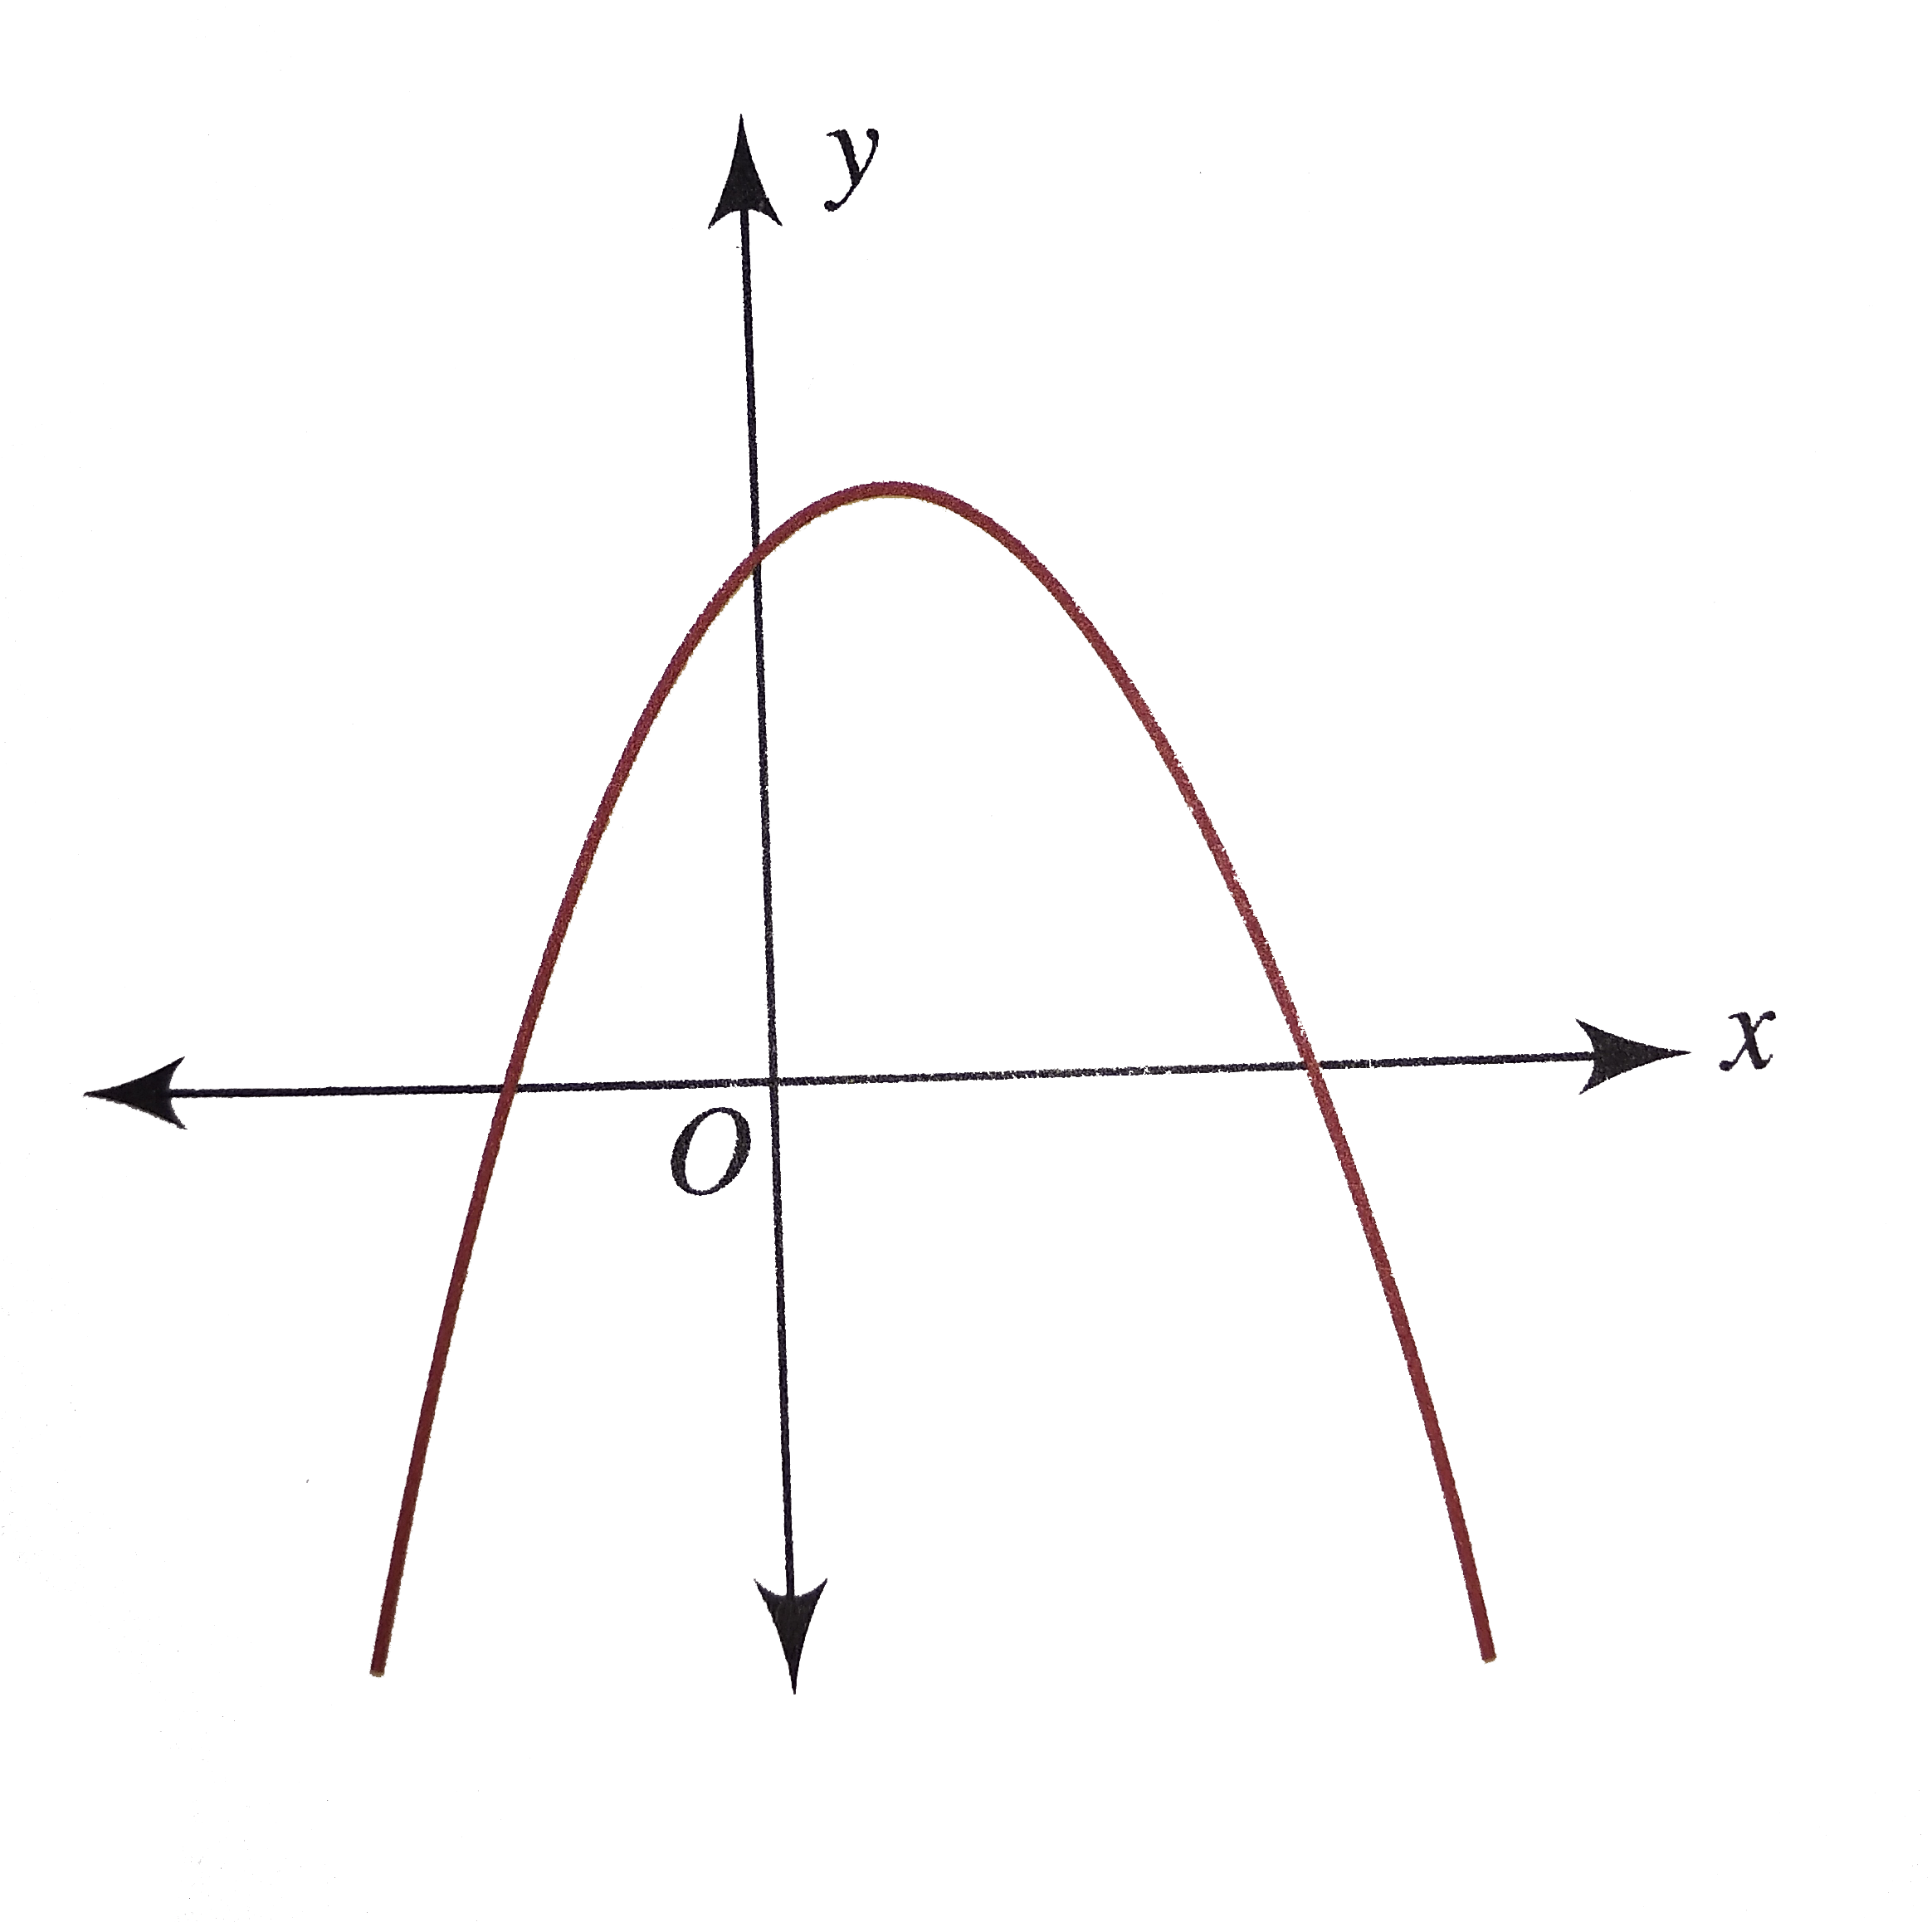
View SolutionThe following figure shows the graph of f(x)=ax2+bx+c, find the sign of a,bandc.
View Solution
