The following is the distribution of height of students of a certain class in a certain city: Height (in cms): 160-162 163-165 166-168 169-171 172-174 No. of students: 15 118 142 127 18. Find the average height of maximum number of students.
To find the average height of the maximum number of students from the given height distribution, we will calculate the mode of the data. The mode represents the height range with the highest frequency of students.
1. Identify the Classes and Frequencies:
- Height (in cms):
- 160-162: 15 students
- 163-165: 118 students
- 166-168: 142 students
- 169-171: 127 students
- 172-174: 18 students
2. Determine the Modal Class:
- The class with the maximum frequency is 166-168, which has 142 students.
3. Define the Parameters for the Mode Formula:
- Lower limit (L) of the modal class = 166
- Frequency of the modal class (F) = 142
- Frequency of the class preceding the modal class (F1) = 118 (for class 163-165)
- Frequency of the class succeeding the modal class (F2) = 127 (for class 169-171)
- Class width (H) = 2 (since the classes are of width 2)
4. Apply the Mode Formula:
The formula for mode is:
Mode=L+F−F12F−F1−F2×H
Substituting the values:
Mode=166+142−1182×142−118−127×2
5. Calculate the Values:
- Calculate F−F1:
142−118=24
- Calculate 2F−F1−F2:
2×142−118−127=284−118−127=39
- Now substitute these values back into the mode formula:
Mode=166+2439×2
- Calculate 2439×2:
4839≈1.23
- Finally, add this to the lower limit:
Mode≈166+1.23=167.23
6. Final Result:
The average height of the maximum number of students is approximately 167.23 cm.
- Height (in cms):
- 160-162: 15 students
- 163-165: 118 students
- 166-168: 142 students
- 169-171: 127 students
- 172-174: 18 students
- The class with the maximum frequency is 166-168, which has 142 students.
- Lower limit (L) of the modal class = 166
- Frequency of the modal class (F) = 142
- Frequency of the class preceding the modal class (F1) = 118 (for class 163-165)
- Frequency of the class succeeding the modal class (F2) = 127 (for class 169-171)
- Class width (H) = 2 (since the classes are of width 2)
The formula for mode is:
Mode=L+F−F12F−F1−F2×H
Substituting the values:
Mode=166+142−1182×142−118−127×2
- Calculate F−F1:
142−118=24
- Calculate 2F−F1−F2:
2×142−118−127=284−118−127=39
- Now substitute these values back into the mode formula:
Mode=166+2439×2
- Calculate 2439×2:
4839≈1.23
- Finally, add this to the lower limit:
Mode≈166+1.23=167.23
The average height of the maximum number of students is approximately 167.23 cm.
Topper's Solved these Questions
Similar Questions
The following is the distribution of height of students of a certain class in a certain city:
Height (in cms) 160−162 163−165 166−168 169−171 172−174No. of students 15 118 142 127 18
Find the median height.View SolutionFind the unknown entries a,b,c,d,e and f in the following distribution of heights of students in a class
 View Solution
Find the unknown entries a,b,c,d,e and f in the following distribution of heights of students in a class
 View Solution
The following table shows the distribution of the heights of a group of students:

Use a graph sheet to draw an Ogive for the distribution. Use the Ogive to find:
the inter quartile rangeView SolutionThe following table shows the distribution of the heights of a group of students:

Use a graph sheet to draw an Ogive for the distribution. Use the Ogive to find:
the number of students whose height is more than 168 cmView SolutionThe following data gives the distribution of height of students :
Height(in cm)160150152161156154155Numbers of students12844337
The median of the distribution isView SolutionGiven below is the frequency distribution of the heights of 50 students of a class: Class Interval:, 140-145, 145-150, 150-155, 155-160, 160-165 Frequency:, 8, 12, 18, 10, 5 Draw a histogram representing the above data.
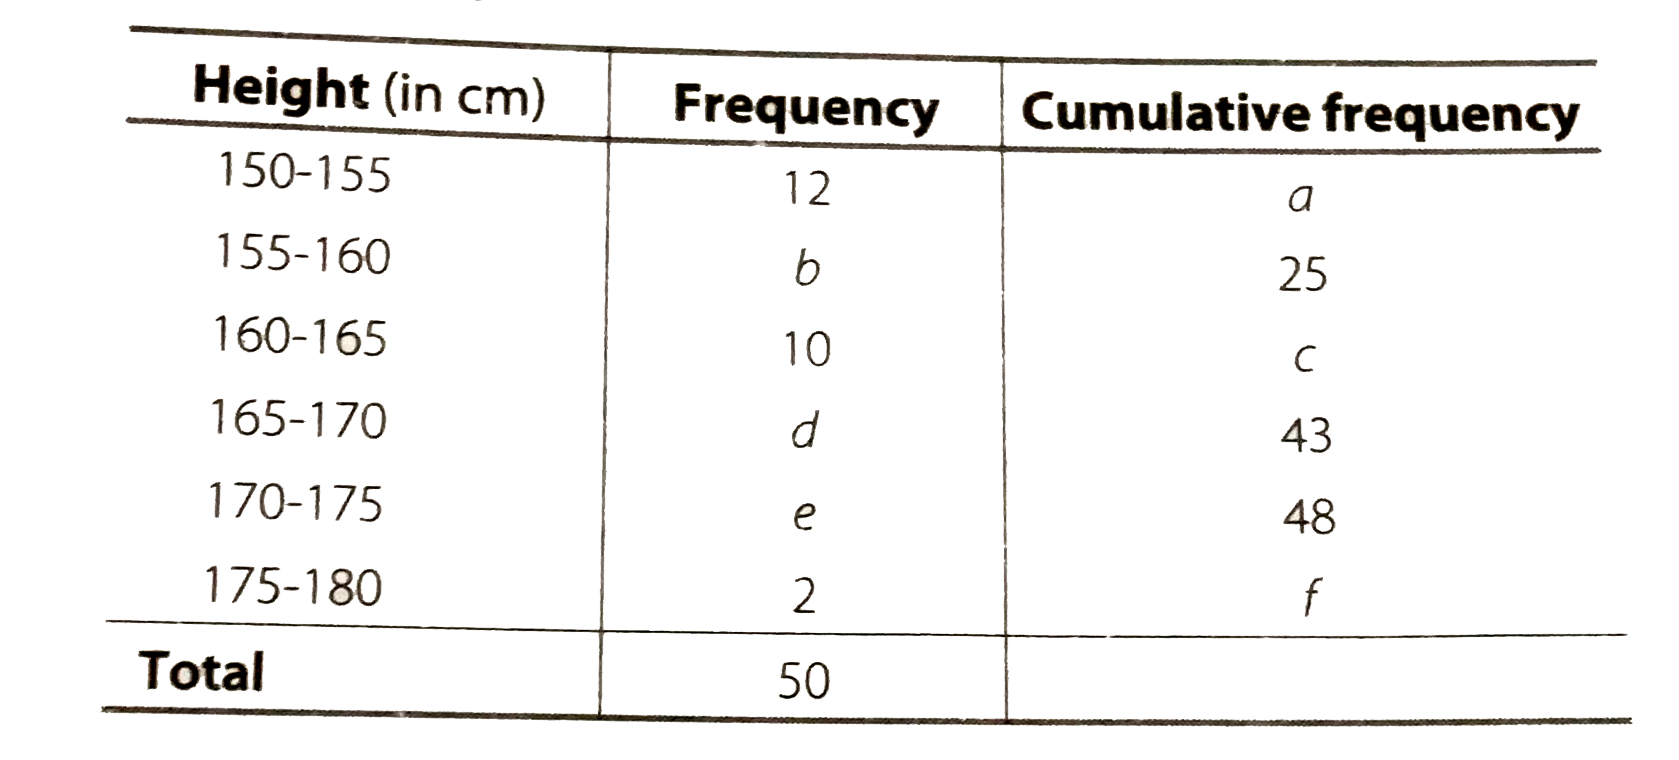
View SolutionFind the unknown entries (a,b,c,d,e,f,g) from the following frequency distribution of heights of 50 students in a class: Class intervals (heights in cm) Frequency Cumulative Frequency 150-155 155-160 160-165 165-170 170-175 175-180 12 b 10 d e 2 a 25 c 43 48 f
View SolutionThe following table shows the distribution of the heights of a group of factory workers :
Determine the cumulative frequencies
Ht. (cm): 150−155155−160160−165165−170170−175175−180180−185 No. of workers 6 12 18 20 13 8 6View SolutionThe following data give the distribution of heights of students :
Height(in cm)160150152161156154155Numbers of students12844337
The median of the distribution isView Solution

