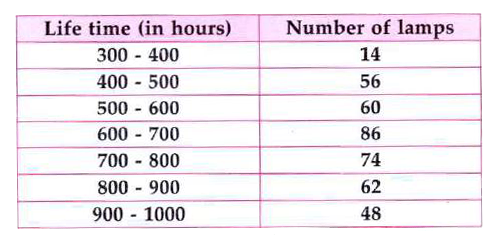
The following table gives the lifetimes of 400 neon lamps

(i) Represent the given information with the help of a histogram.
(ii) How many lamps have a lifetime of more 700 h?
(i) Here, we will make a modified by given data:

Now, we draw the histogram for above table
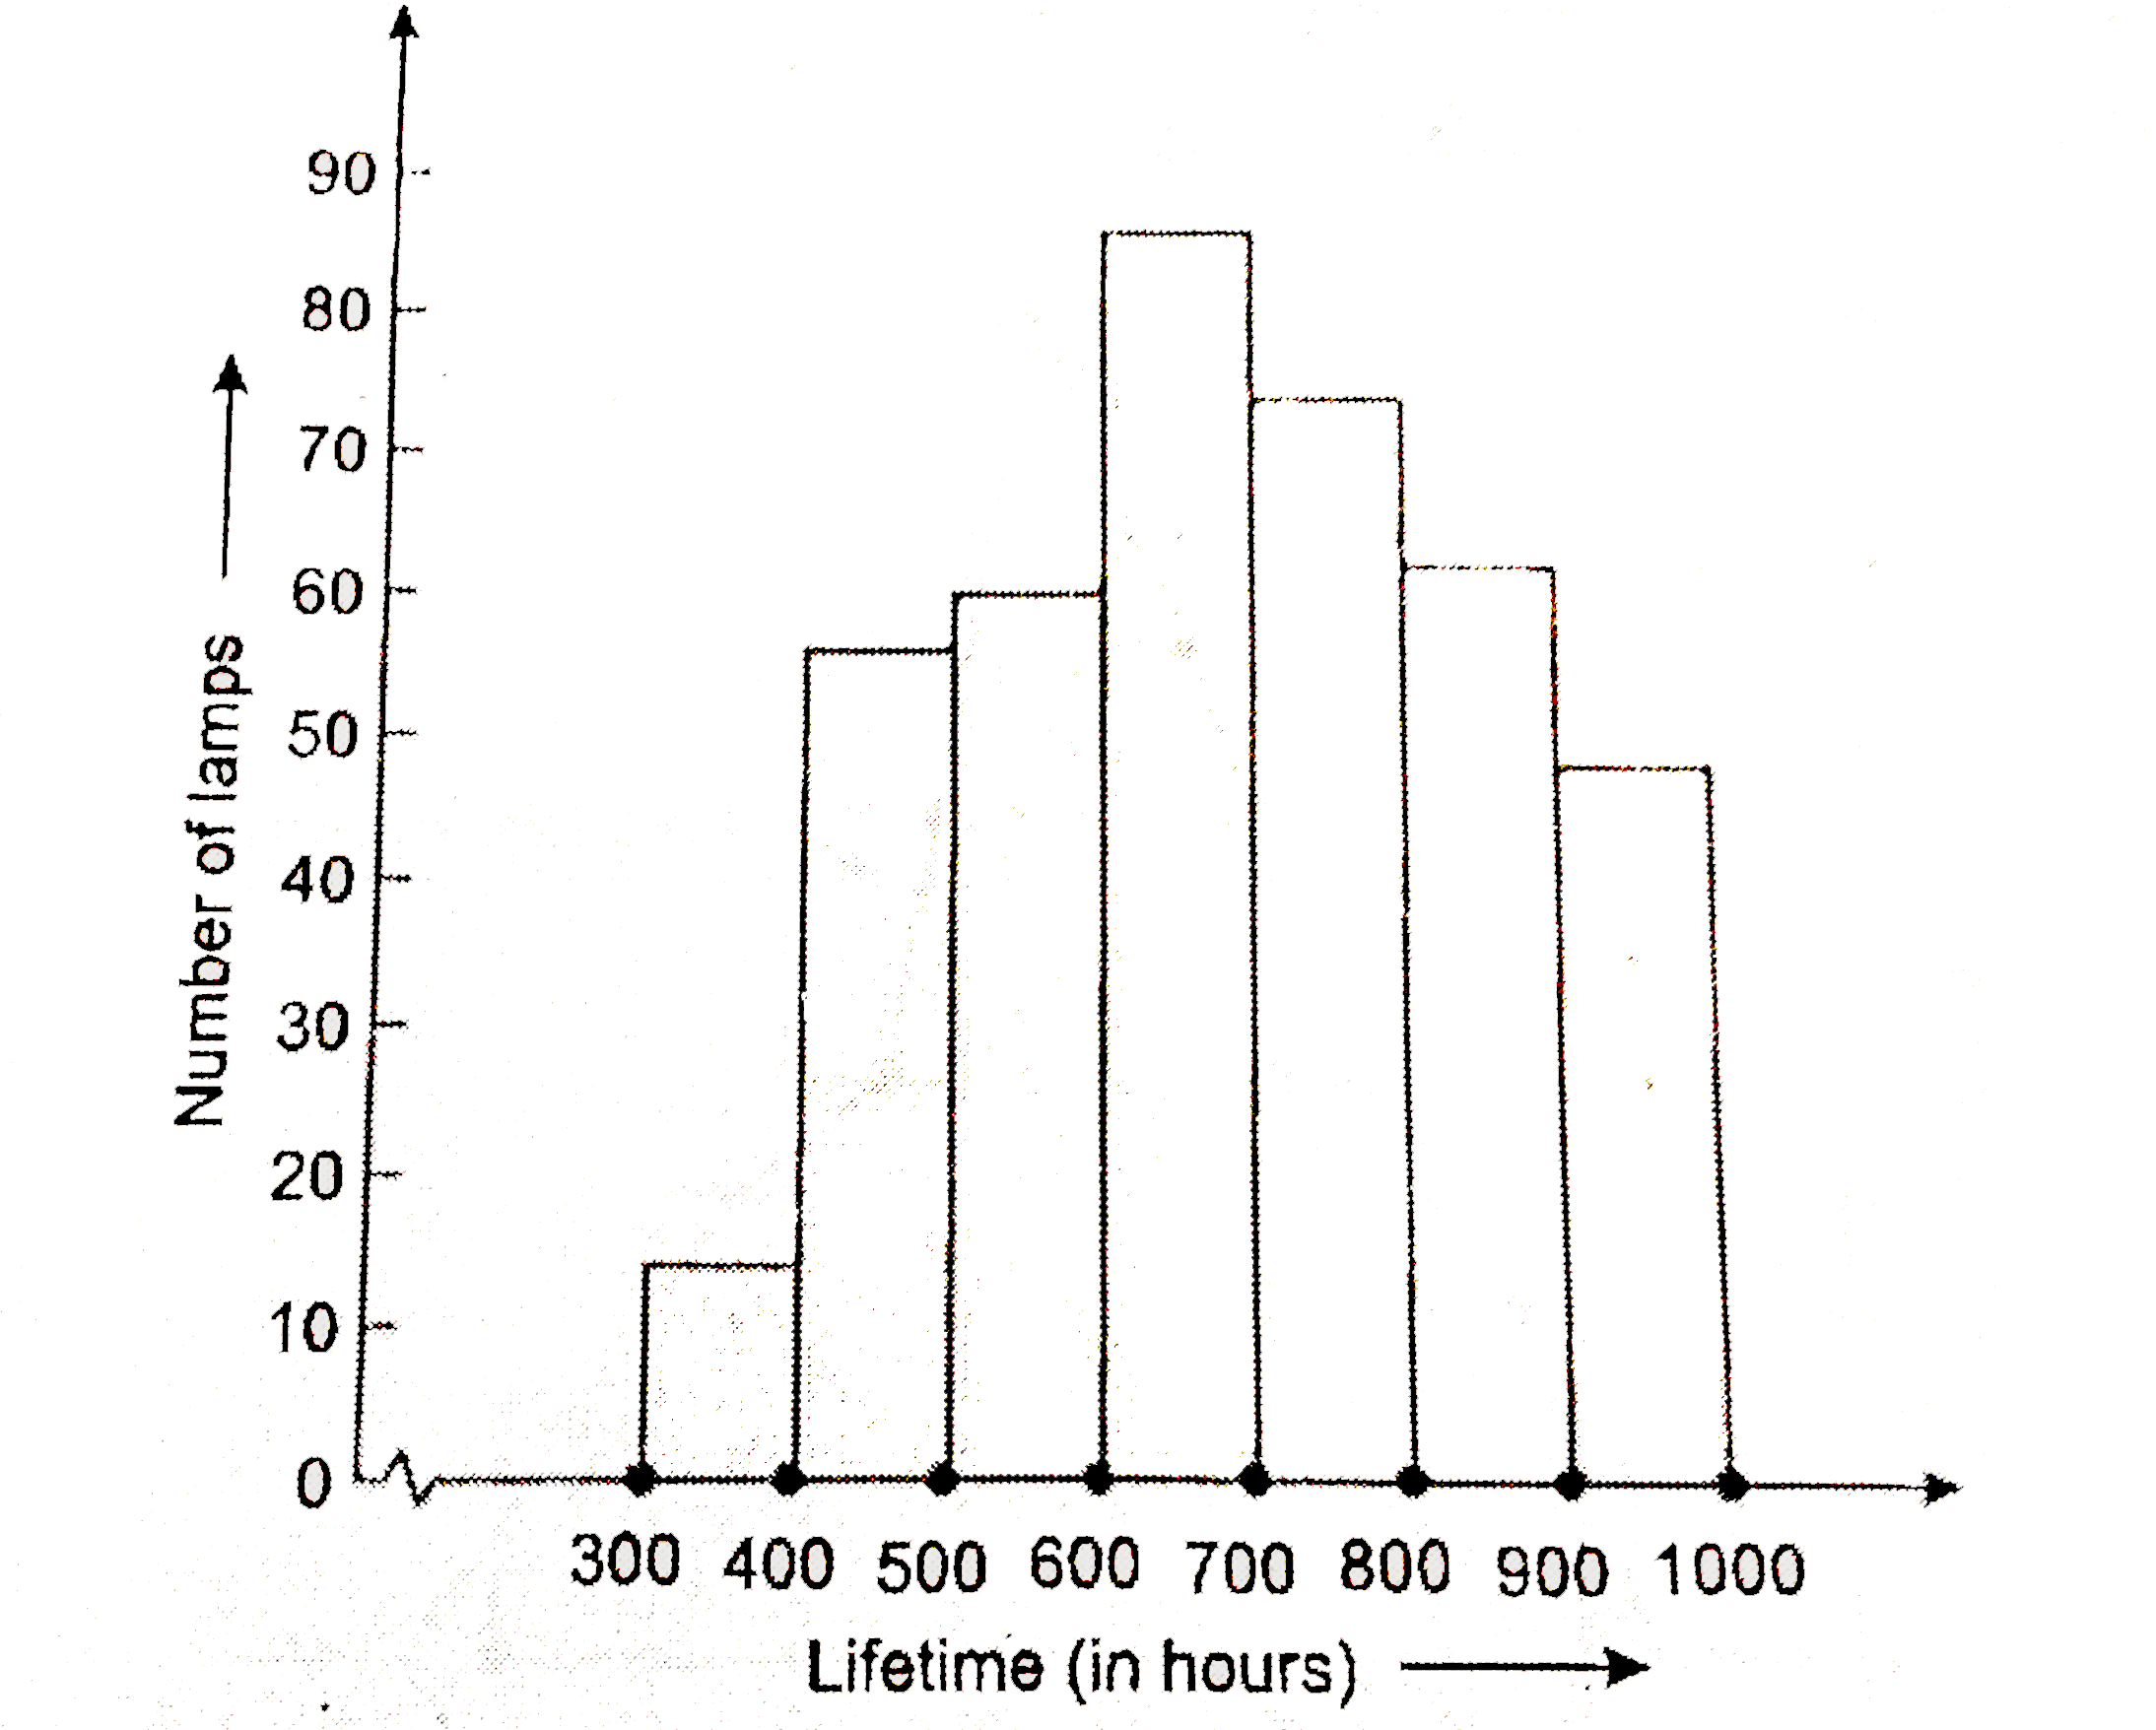
(ii) 184 lamps have a lifetime of more than 700 h i.e.,
Topper's Solved these Questions
- STATISTICSBOOK - NAGEEN PRAKASHANCHAPTER - STATISTICSEXERCISE - Exercise 14a
10 Videos
- STATISTICSBOOK - NAGEEN PRAKASHANCHAPTER - STATISTICSEXERCISE - Exercise 14c
20 Videos
- STATISTICSBOOK - NAGEEN PRAKASHANCHAPTER - STATISTICSEXERCISE - Revision Exercise
10 Videos
- QUADRILATERALSBOOK - NAGEEN PRAKASHANCHAPTER - QUADRILATERALSEXERCISE - Revision Exercise (long Answer Questions)
5 Videos
- SURFACE AREA AND VOLUMEBOOK - NAGEEN PRAKASHANCHAPTER - SURFACE AREA AND VOLUMEEXERCISE - Revision Exercise (long Answer Questions)
10 Videos
Similar Questions
The following table gives the life times of 400 neon lamps:
(i) Represent the given information with the help of histogram.
(ii) How many lamps have a life time of more than 700 hours?
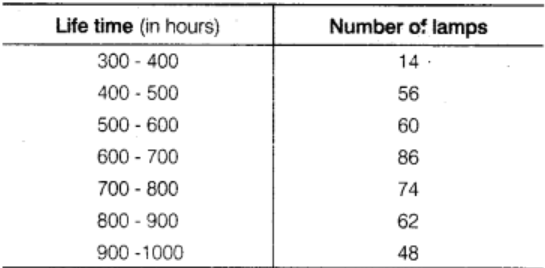
View SolutionThe following table gives the life times of 400 neon lamps:
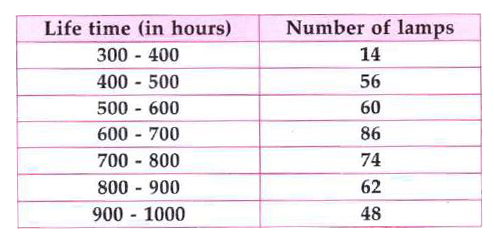
Represent the given information with the help of a histogram.
View Solution
Knowledge Check
Observe the histogram and answer the questions given below.
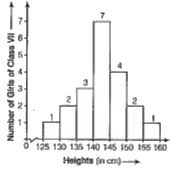
How many girls have a height of 145 cm and more?A6B7C5D2
The following table gives the life times of 400 neon lamps:(i) Represent the given information with the help of histogram.(ii) How many lamps have a life time of more than 700 hours?
View SolutionThe following table gives the life times of 400 neon lamps:
How many lamps have a life time of more than 700 hours?
View SolutionThe following table gives the distribution of the life time of 400 neon lamps Find the median life of a lamp.
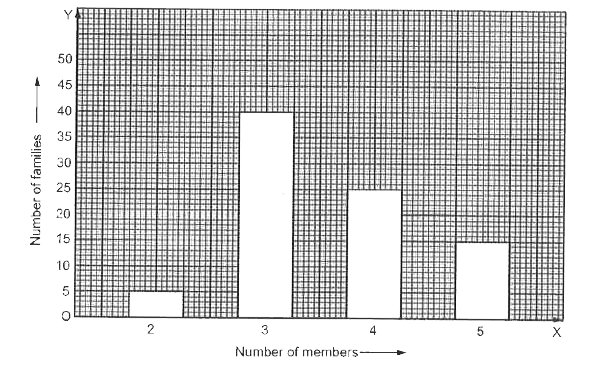
View SolutionIn a survey of 85 families of a colony, the number of members in each family was recorded and the data has been represented by the following bar graph
Read the bar graph carefully and answer the questions given below
Q (i) What information does the bar graph give
(ii) How many families have 3 members
(iii) How many people live alone
(iv) Which type of family is the most common? How many members are there in each family of this kind
View SolutionLook at the histogram given below answer the question that follow:
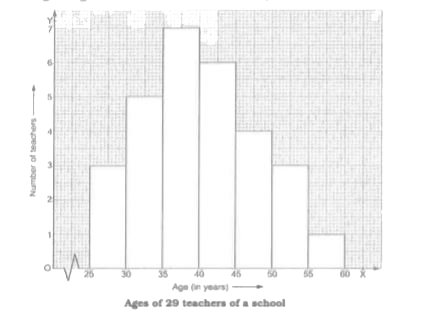
(i) What information in being given by the histogram?
(ii) How many teachers are of age less than 45 years?
(iii) How many teachers are of age 40 years or more but less than 55 years?
View SolutionLook at the histogram given below and answer the following questions.
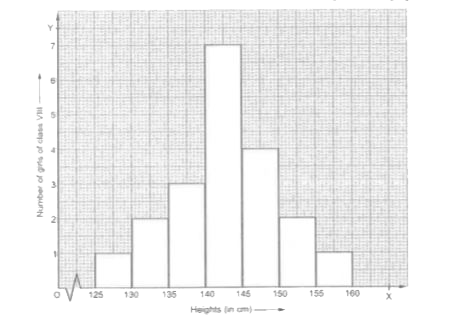
(i) What information in being given by the histogram?
(ii) Which group contains maximum girls?
(iii) How many girls have a height of 140 cm and more?
(iv) If we divide the girls into the following three categories, how many would there be in each?
150 cm and more - Group A
140 cm to less than 150 cm - Group B
Less than 140 cm-Group C
View SolutionThe following table gives the life time of 400 neon lamps: Life time (in hours 300-400 400-500 500-600 600-700 700-800 800-900 900-1000 No. of lamps: 14 56 60 86 74 62 48 A bulb is selected at random. Find the probability that the life time of the selected bulb is : (i)less than 400 (ii)between 300 to 800 hours (iii)at least 700 hours.
View Solution
