The following table shows how a student spends his pocket money during the course of a month. Represent it by a pie-diagram. Items, Food, Entertainment, Other expenditure, Savings Expenditure, 40%, 25%, 20%, 15%
Step by step video & image solution for The following table shows how a student spends his pocket money during the course of a month. Represent it by a pie-diagram. Items, Food, Entertainment, Other expenditure, Savings Expenditure, 40%, 25%, 20%, 15% by Maths experts to help you in doubts & scoring excellent marks in Class 8 exams.
Updated on:21/07/2023Topper's Solved these Questions
Similar Questions
The following data shows the expenditure of a person on different items during a month. Represent the data by a pie-chart. Items of expenditure, Rent, Education, Food, Clothing, Others Amount (in Rs.), 2700, 1800, 2400, 1500, 2400
View SolutionA boy spends 40% of his pocket money, and has Rs.3 left. How much had he at first?
View Solution
Knowledge Check
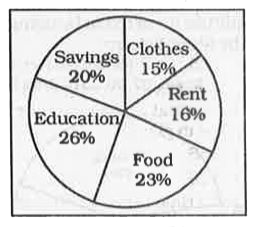
The given pie-chart shows the breakup (in percentage) of monthly expenditure of a person.

The expenditure on food is how much per cent more than the expenditure on savings?A12.21B15C13.04D11Surbhi spends 75% of her income. If her income increases by 20% and savings decreases by 1%, then the percentage increase in her expenditure is :
सुरभि अपनी आय का 75% खर्च करती है | यदि उसकी आय 20% से बढ़ जाए और उसकी बचत में 1% की कमी हो जाए, तो उसके व्यय में हुई प्रतिशत वृद्धि ज्ञात करें |A27B2.2C22D2.2A man spends 65% of his income and saves the rest. If his income increases by 25% and spending increases by 20%, then what is the percentage change in his savings ?
A31.67% increaseB34.28% increaseC41.66% decreaseD29.87% decrease
The following table shows the household expenditure of family on different items. Draw a pie chart to represent the given data.
ItemRentFoodClotingEducationOthersExpenditure25%30%10%15%20%
View SolutionThe following table shows the expenditure incurred by a publisher in publishing a book: Items, Paper, Printing, Binding, Advertishing, Misc. Expenditure (in %), 35%, 20%, 10%, 5%, 30% Present the above data in the form of a pie-chart.
View SolutionDraw a pie-diagram for the following data of expenditure pattern in a family: Items, Food, Clothing, Rent, Education, Unforessen events, Midicine Expenditure (in percent), 40%, 20%, 10%, 10%, 15%, 5%
View SolutionThe following data relates to the cost of construction of a house in Delhi. Items, Cement, Steel, Bricks, Timber, Labour, Misc. Expenditure, 30%, 10%, 10%, 15%, 25%, 10% Draw a pie-diagram to represent the above data.
View SolutionRaghav spends 80% of his income. If his income increases by 12% and the savings decrease by 10% then what will be the percentage increase in his expenditure ?
View Solution
