The following table shows the expenditure incurred by a publisher in publishing a book: Items, Paper, Printing, Binding, Advertishing, Misc. Expenditure (in %), 35%, 20%, 10%, 5%, 30% Present the above data in the form of a pie-chart.
Step by step video & image solution for The following table shows the expenditure incurred by a publisher in publishing a book: Items, Paper, Printing, Binding, Advertishing, Misc. Expenditure (in %), 35%, 20%, 10%, 5%, 30% Present the above data in the form of a pie-chart. by Maths experts to help you in doubts & scoring excellent marks in Class 8 exams.
Updated on:21/07/2023Topper's Solved these Questions
Similar Questions
The following data relates to the cost of construction of a house in Delhi. Items, Cement, Steel, Bricks, Timber, Labour, Misc. Expenditure, 30%, 10%, 10%, 15%, 25%, 10% Draw a pie-diagram to represent the above data.
View SolutionDraw a pie-diagram for the following data of expenditure pattern in a family: Items, Food, Clothing, Rent, Education, Unforessen events, Midicine Expenditure (in percent), 40%, 20%, 10%, 10%, 15%, 5%
View Solution
Knowledge Check
The given pie-chart shows the expenditure (in degrees) incurred in making a book.
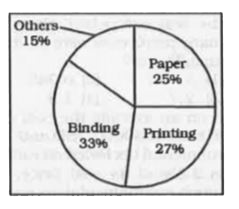
If expenditure on Paper is Rs. 20000, then what is the expenditure (in Rs.) on Binding?A24600B26400C28000D22800The given pie-chart shows the expenditure incurred in making a book.
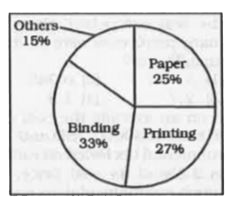
The expenditure on Binding is how much per cent more than the expenditure on Paper?A32B24.24C28.18D34Circle graph given above shows the expenditure incurred in bringing out a book, by a publisher.
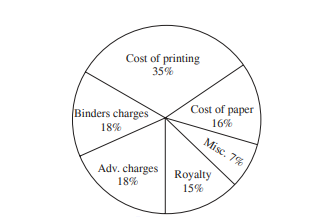
If the cost of printing is Rs.17500, the royalty is -----ARs.8750BRs.7500CRs.3150DRs.6300
The following table shows how a student spends his pocket money during the course of a month. Represent it by a pie-diagram. Items, Food, Entertainment, Other expenditure, Savings Expenditure, 40%, 25%, 20%, 15%
View SolutionThe following table shows the household expenditure of family on different items. Draw a pie chart to represent the given data.
ItemRentFoodClotingEducationOthersExpenditure25%30%10%15%20%
View SolutionFollowing data gives the break up of the cost of production of a book: Printing Paper Binding charges Advertisement Royalty Misc. 30% 15% 15% 20% 10% 15% Draw a pie-diagram depicting the above information.
View SolutionThe given pie chart shows the various expenses (in percent) incurred by publisher on publishing a book.
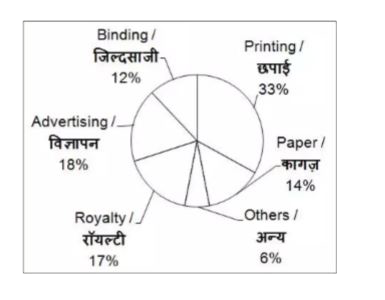
By how much percent the total amount spend on Paper and Binding is less than the amount spend on Printing?
View SolutionTable shows the percentage distribution of the expenditure incurred on different items for publishing a book.
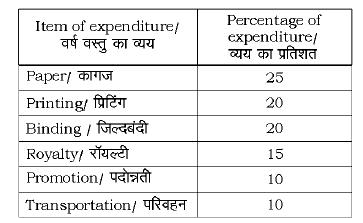
Expenditure on Royalty is less than that on printing by:
View Solution
