The following table shows the favourite games of 240 students of a school. Draw a pie chart for the following data.
¯¯¯¯¯¯¯¯¯¯¯¯¯¯¯¯¯¯¯¯¯¯¯¯¯¯¯¯¯¯¯¯¯¯¯¯¯¯¯¯¯¯¯¯¯¯¯¯¯¯¯¯¯¯¯¯¯¯¯¯¯¯¯¯¯¯¯¯¯¯¯¯¯¯¯¯¯¯¯¯¯¯¯¯¯¯¯¯¯¯¯¯¯¯¯¯¯¯¯¯¯¯¯¯¯¯¯¯¯¯¯¯¯¯¯¯¯¯¯¯Game Football Badminton Criket Volleyball HockeyNumber of 35 30 80 40 55students ––––––––––––––––––––––––––––––––––––––––––––––––––––––––––––––––––––––––––––––
Step by step video, text & image solution for The following table shows the favourite games of 240 students of a school. Draw a pie chart for the following data. {:(bar("Game Football Badminton Criket Volleyball Hockey")),("Number of 35 30 80 40 55"),(ul("students ")):} by Maths experts to help you in doubts & scoring excellent marks in Class 7 exams.
Updated on:21/07/2023Topper's Solved these Questions
- STATISTICSBOOK - PEARSON IIT JEE FOUNDATIONCHAPTER - STATISTICSEXERCISE - CONCEPT APPLICATION Level - 1
14 Videos
- STATISTICSBOOK - PEARSON IIT JEE FOUNDATIONCHAPTER - STATISTICSEXERCISE - Level 2
22 Videos
- STATISTICSBOOK - PEARSON IIT JEE FOUNDATIONCHAPTER - STATISTICSEXERCISE - Short Answer Type
21 Videos
- SIMPLE INTEREST AND COMPOUND INTEREST BOOK - PEARSON IIT JEE FOUNDATIONCHAPTER - SIMPLE INTEREST AND COMPOUND INTEREST EXERCISE - Level 3
9 Videos
Similar Questions
The following table shows the interest of students of a school in different games :

Represent the data by using a simple bar diagram.
View SolutionThe given pie-chart shows favourite sport of students of a school.
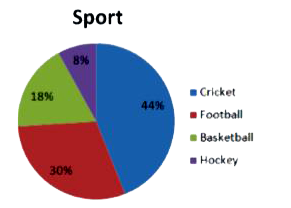
In the given pie-chart, if there were 1280 students in all, how many liked football?
View Solution
Knowledge Check
Why students should play games in school ?
AIt makes them physically strongBIt makes work easier for teachersCIt helps in passing timeDIt develops co-operation and physical balance
The following table shows the percentage of buyers of four different brands of bathing soaps.

Represent the above data by a pie chart.
View SolutionThe given pie chart shows favorite shows of student of a school
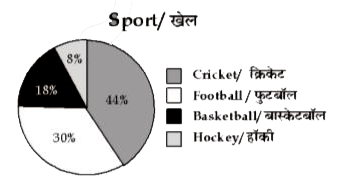
In the given pie chart, if there were 1280 students in all, how many liked football
View SolutionThe following data shows the number of students who attended the school on weekdays. Draw a bar graph to represent information by using appropriate scale.

View SolutionThe following table shows various sports played by students in a school. Draw a pie chart to represent the given data.
SportsChessCricketCarromsFootballNumber of students35704263
View SolutionThe given pie-chart shows favourite sport of students of a school.
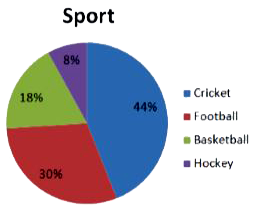
In the given pie-chart, what is the difference in percentage between liking for football and basketball?
View SolutionThe given pie chart shows favorite shows of student of a school
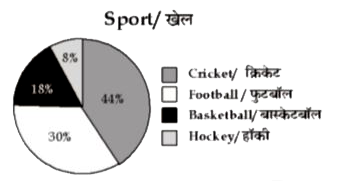
In the given pie chart, what is the difference in percentage between liking for football and basketball
View SolutionThe given pie-chart shows favourite sport of students of a school.
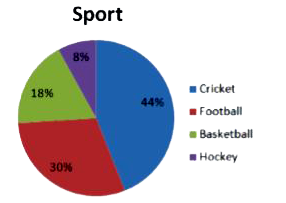
In the given pie-chart, if the school strength was 2500, how many liked cricket more than hockey?
View Solution
