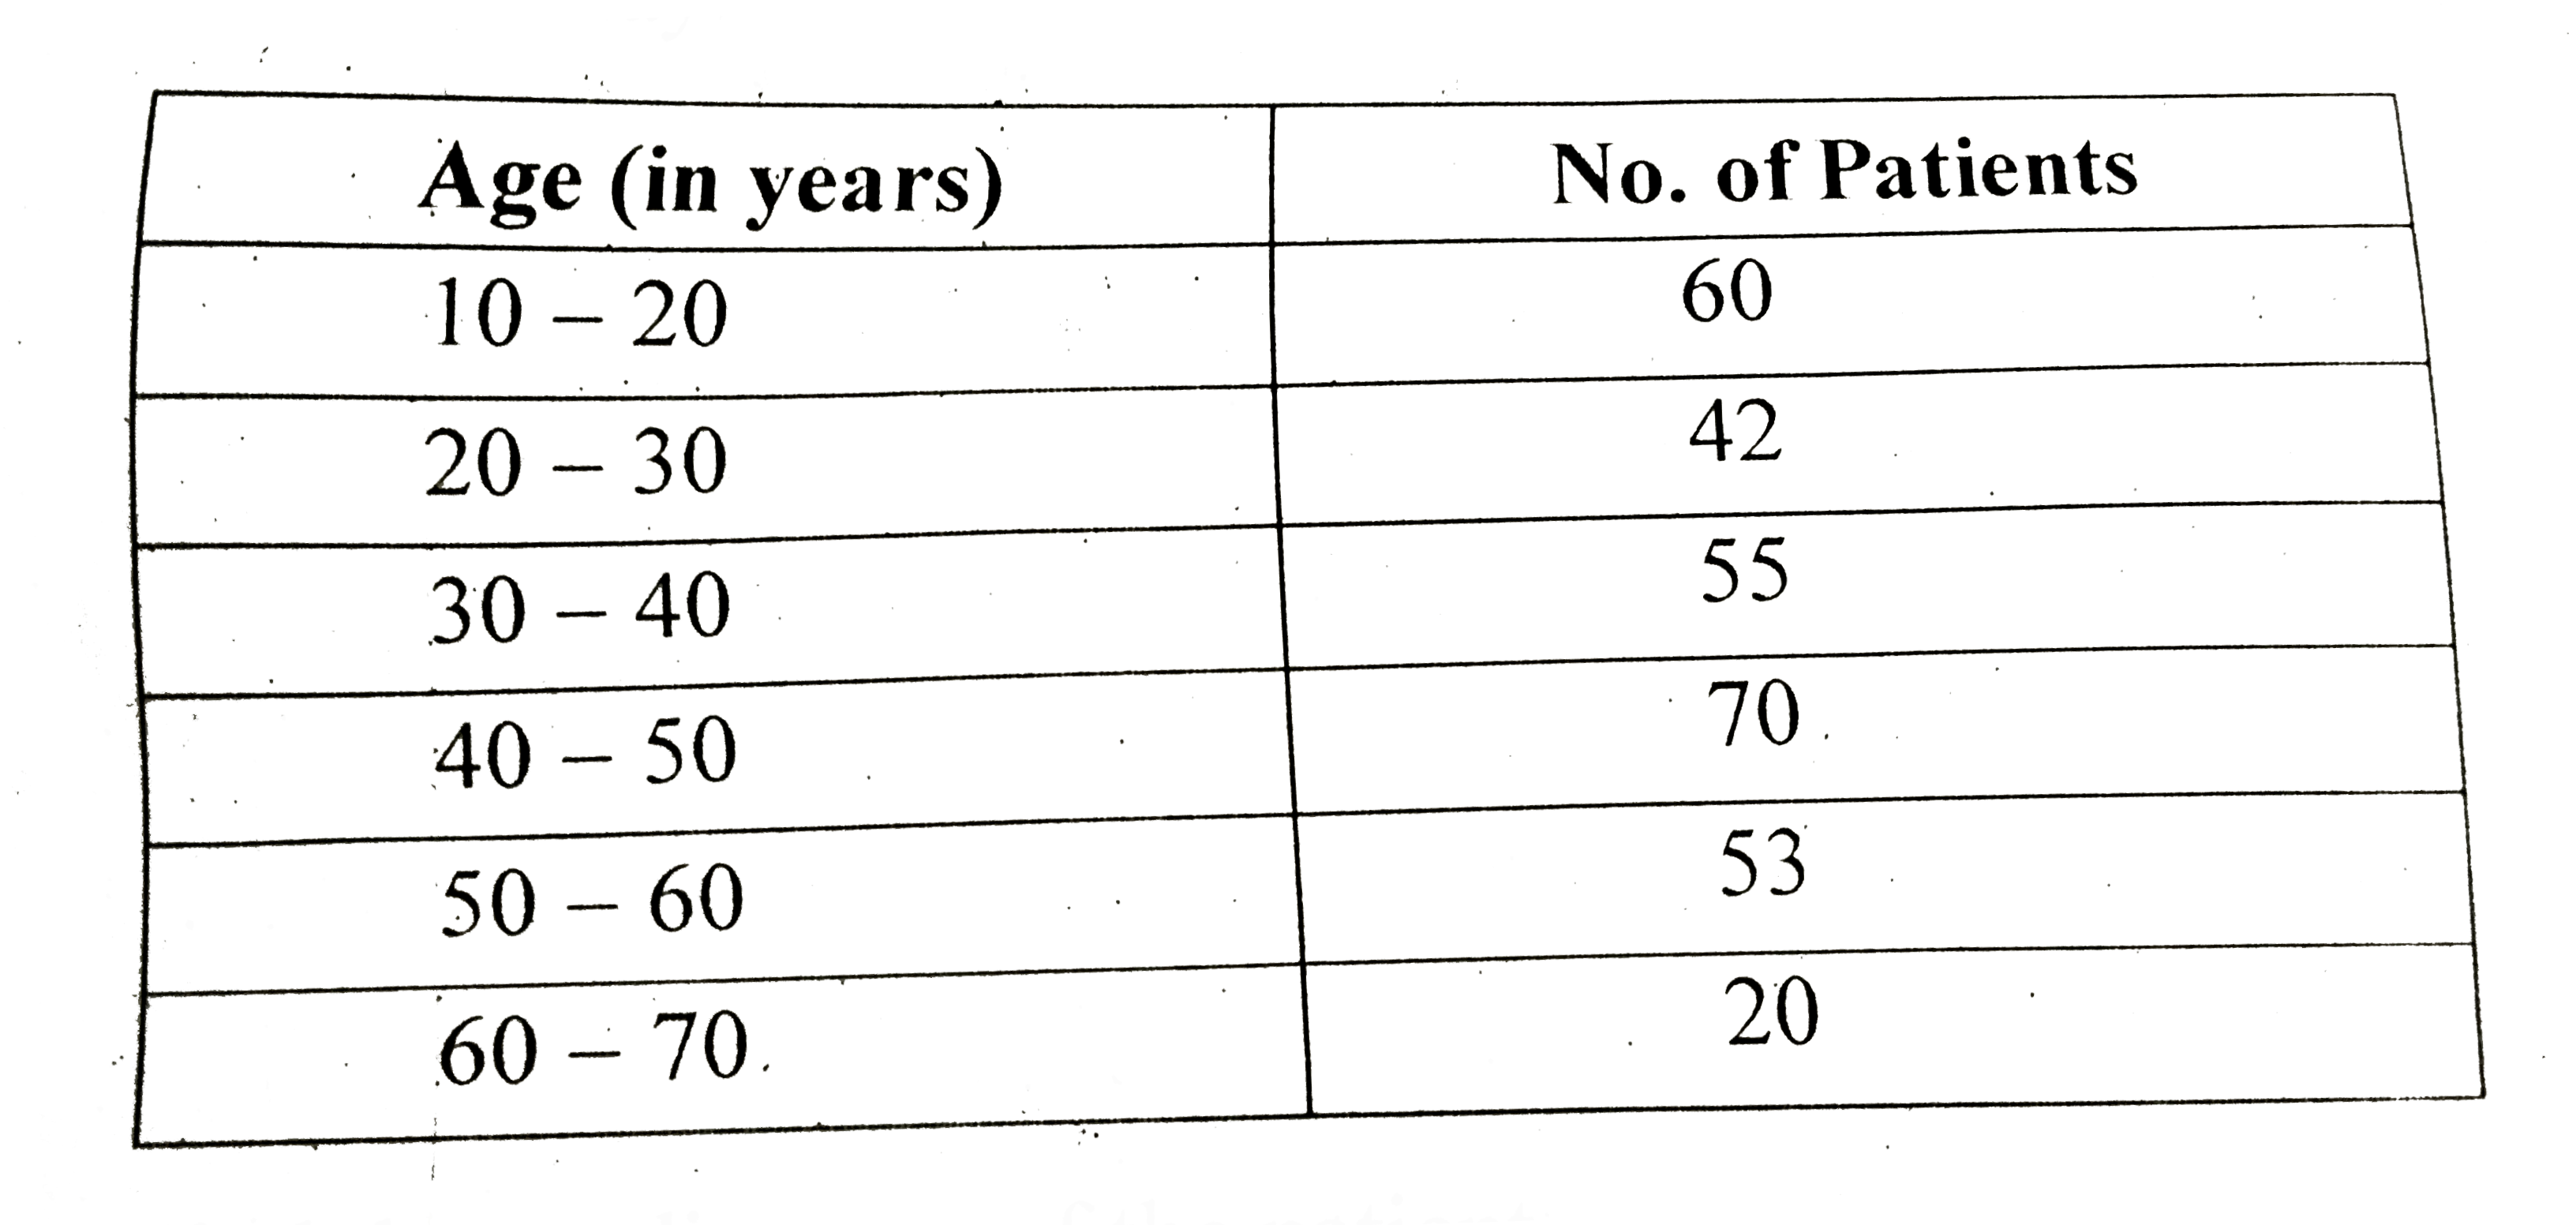
The following table shows the number of patients of differents age groups admitted to a hospital for treatement on a day. Find the median age of the patients.

The correct Answer is:The median age of the patients is 38 years.
Step by step video & image solution for The following table shows the number of patients of differents age groups admitted to a hospital for treatement on a day. Find the median age of the patients. by Maths experts to help you in doubts & scoring excellent marks in Class 10 exams.
Topper's Solved these Questions
- BOOK - NAVNEET PUBLICATION - MAHARASHTRA BOARDCHAPTER - CHALLENGING QUESTIONS EXERCISE - EXAMPLE FOR PRACTICE22videos
CHALLENGING QUESTIONS
- BOOK - NAVNEET PUBLICATION - MAHARASHTRA BOARDCHAPTER - BOARD'S QUESTION PAPER : MARCH 2019EXERCISE - QUESTION30videos
BOARD'S QUESTION PAPER : MARCH 2019
- BOOK - NAVNEET PUBLICATION - MAHARASHTRA BOARDCHAPTER - CHALLENGING QUESTIONSEXERCISE - SECTION 3 (MODEL QUESTION PAPER FOR PRACTICE ) Solve any one of the following subquestions :1videos
CHALLENGING QUESTIONS
Similar Questions
The following table shows ages of 300 patients getting medical treatment in a hospital on a particular day:

Find the median age of the patient.View SolutionThe following table shows the ages of the patients admitted in a hospital during a year:Find the mode and the mean of the data given above. Compare and interpret the two measures of central tendency.
View Solution
Knowledge Check
- Question 1 - Select One
From the following table, how many patients were in the age group 40-60?
 A6B16C45D29
 - Question 2 - Select One
___ means the number of people in different age groups in a given population.
AAge limitBAge structureCOverage limitDNone of these
The following table shows ages of 200 patients (in years) and the number of patients getting medical tretment on a particular day in a hospital in a day.

Find the median age of a patient.View SolutionThe following frequency dsitribution table gives the ages of 80 patients treated in a hospital during a month. Find the mode of the ages of the patients.
 View Solution
The following table shows the number of patients discharged from a hospital with HIV diagnosis in different years: Years:, 2002, 2003, 2004, 2005, 2006 No. of Patients:, 150, 170, 195, 225, 230 Represent this information by a graph.
View SolutionCOVID-19 Pandemic
The COVID-19 pandemic, also known as coronavirus pandemic, is an ongoing pandemic of coronavirus disease caused by the transmission of severe acute respiratory syndrome coronavirus 2 (SARS-CoV-2) among humans.

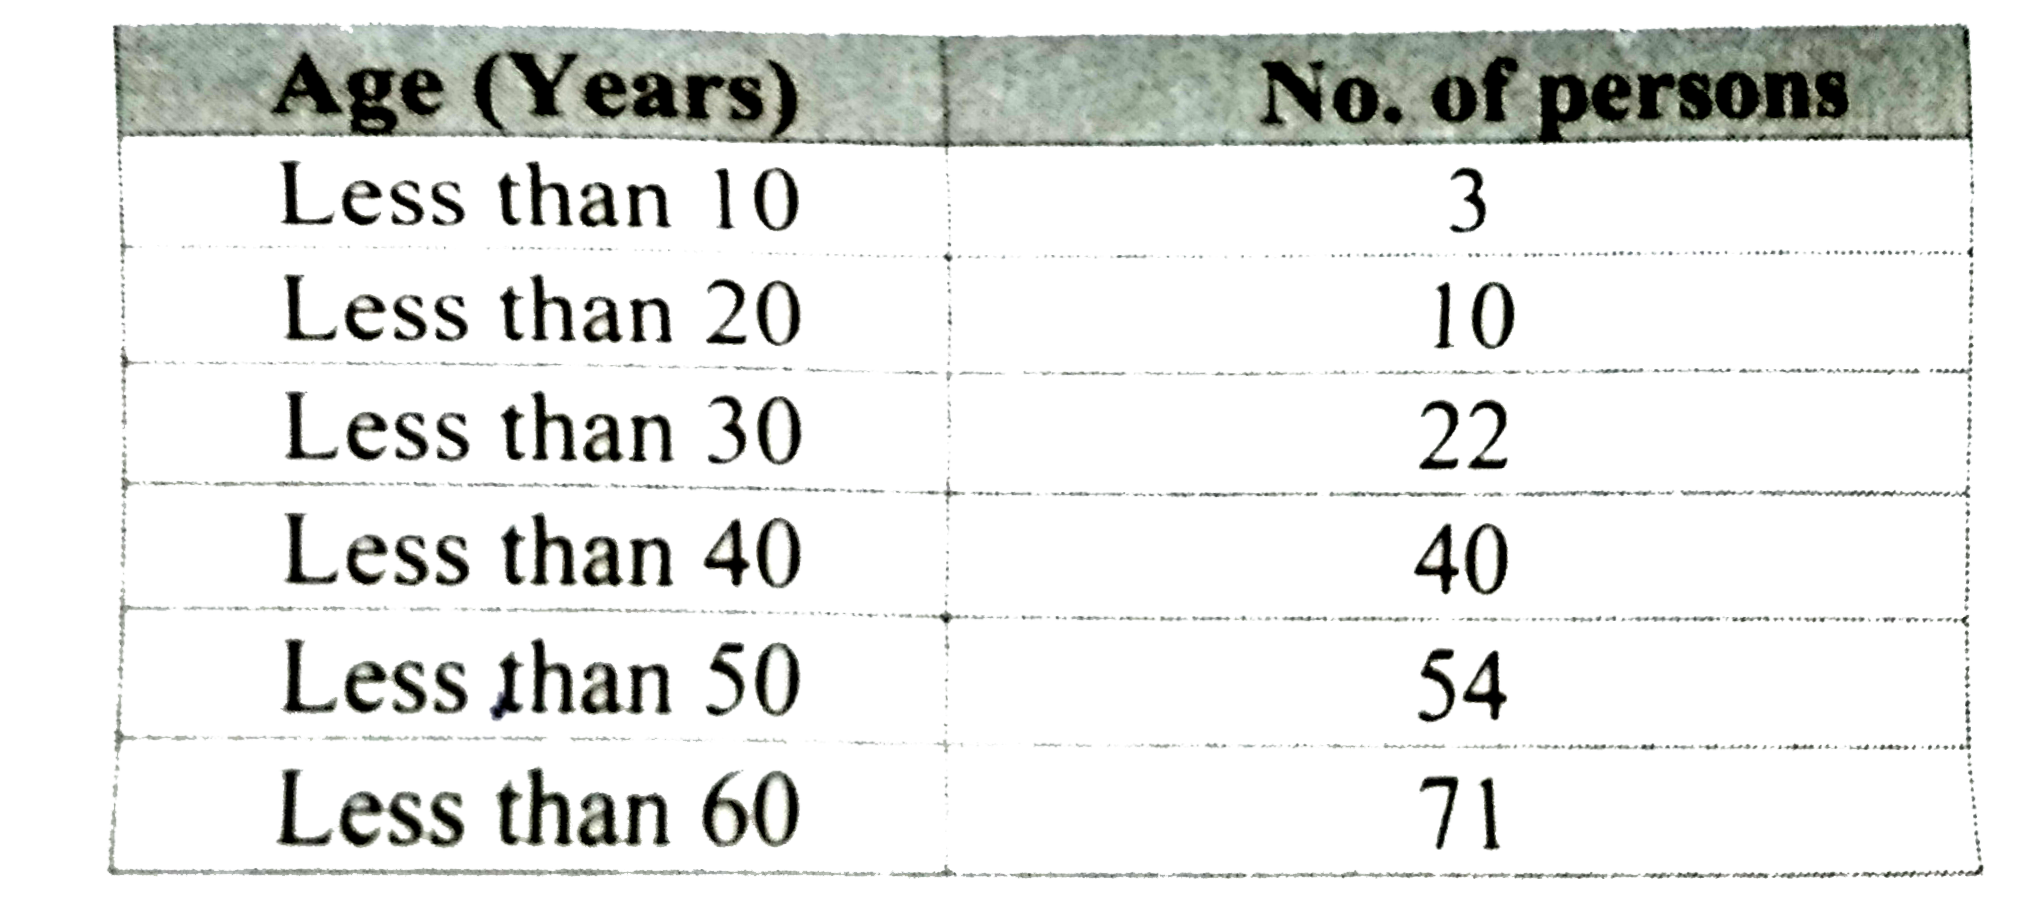
The following tables shows the age distribution of case admitted during a day in two different hospitals .

Refer to table 2.
The median of the given data isView SolutionThe following frequency distribution table gives the ages of 200 patients treated in a hospital in a weak. Find the mode of ages of the patients.
 View Solution
The following table shows the ages of persons who visited a museum on a certain day. Find the median age of the persons visitng the museum.
 View Solution

