The following table shows the sales and advertisement expenditure of a firm

Correlation coefficient = 0.9 , estimate the likely sales for a proposed expenditure of ₹ 10 crores.
The correct Answer is:₹ 64 crores
Step by step video, text & image solution for The following table shows the sales and advertisement expenditure of a firm Correlation coefficient = 0.9 , estimate the likely sales for a proposed expenditure of ₹ 10 crores. by Maths experts to help you in doubts & scoring excellent marks in Class 12 exams.
Updated on:21/07/2023Topper's Solved these Questions
- MODEL TEST PAPER - 7BOOK - ICSECHAPTER - MODEL TEST PAPER - 7EXERCISE - Section - C (In sub-parts (i) and (ii) choose the correct option and in sub-parts (iii) to (v), answer the questions as instructed.)
5 Videos
- MODEL TEST PAPER - 4BOOK - ICSECHAPTER - MODEL TEST PAPER - 4EXERCISE - SECTION - C
10 Videos
- MODEL TEST PAPER - 8BOOK - ICSECHAPTER - MODEL TEST PAPER - 8EXERCISE - Section - C
6 Videos
Similar Questions
The following table shows the expenditure of 60 boys on books. Find the mode of their expenditure:
View SolutionCompute Karl Pearson's Coefficient of Correlation between sales and expenditures of a firm for six months. **
View SolutionThe following table shown the mean and standard deviation of the marks of Mathematics and Physics scored by the students in a school :

The correlation coefficient between the given marks is 0.86 . Estimate the likely marks in Physics if the marks in Mathematics are 92.
View SolutionThe following table shows how a student spends his pocket money during the course of a month. Represent it by a pie-diagram. Items, Food, Entertainment, Other expenditure, Savings Expenditure, 40%, 25%, 20%, 15%
View SolutionThe following table shows the expenditure incurred by a publisher in publishing a book: Items, Paper, Printing, Binding, Advertishing, Misc. Expenditure (in %), 35%, 20%, 10%, 5%, 30% Present the above data in the form of a pie-chart.
View SolutionYou are given the following data, obtain the regression equation and estimate the yield of crops when the rainfall is 29cm. Given that coefficient of correlation between yield and rainfall= 0.52

View SolutionThe following results were obtained with respect to two variable x and y:
∑x=30,∑y=42,∑xy=199,∑x2=184,∑y2=318,n=6.
Find the following:
(i) The regression coefficients.
(ii) Correlation coefficient between x and y.
(iii) Regression equation of y on x.
(iv) The likely value of y when x = 10.
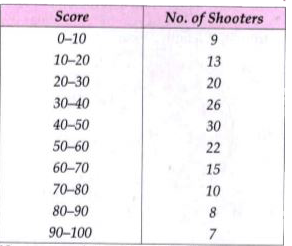
View SolutionThe table shows the distribution of the scores obtained by 160 shooters in a shooting competition. Use a graph sheet and draw an ogive for the distribution. (Take 2 cm = 10 scores on the X-axis and 2 cm = 20 shooters on the Y-axis)

Use your graph to estimate the following :
(i) The median.
(ii) The interquartile range.
(iii) The number of shooters who obtained a score of more than 85%.
View SolutionThe following table shows the marks scored by 140 students in an examination of a certain paper: Marks: 0-10 10-20 20-30 30-40 40-50 No. of students: 20 24 40 36 20 Calculate the average marks by using the assumed mean deviation method.
View SolutionThese questions consists of two statements each printed as Assertion and Reason. While answering these question you are required to choose any one of the following four responses
Assertion A block of weight 10 N is pushed against a vertical wall by a force of 15 N. The coefficient of friction between the wall and the block is 0.6. Then, the magnitude of maximum frictional force is 9 N.
Reason For given system block will remain stationary.
View Solution
