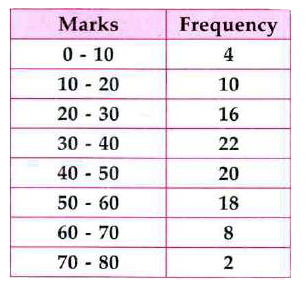
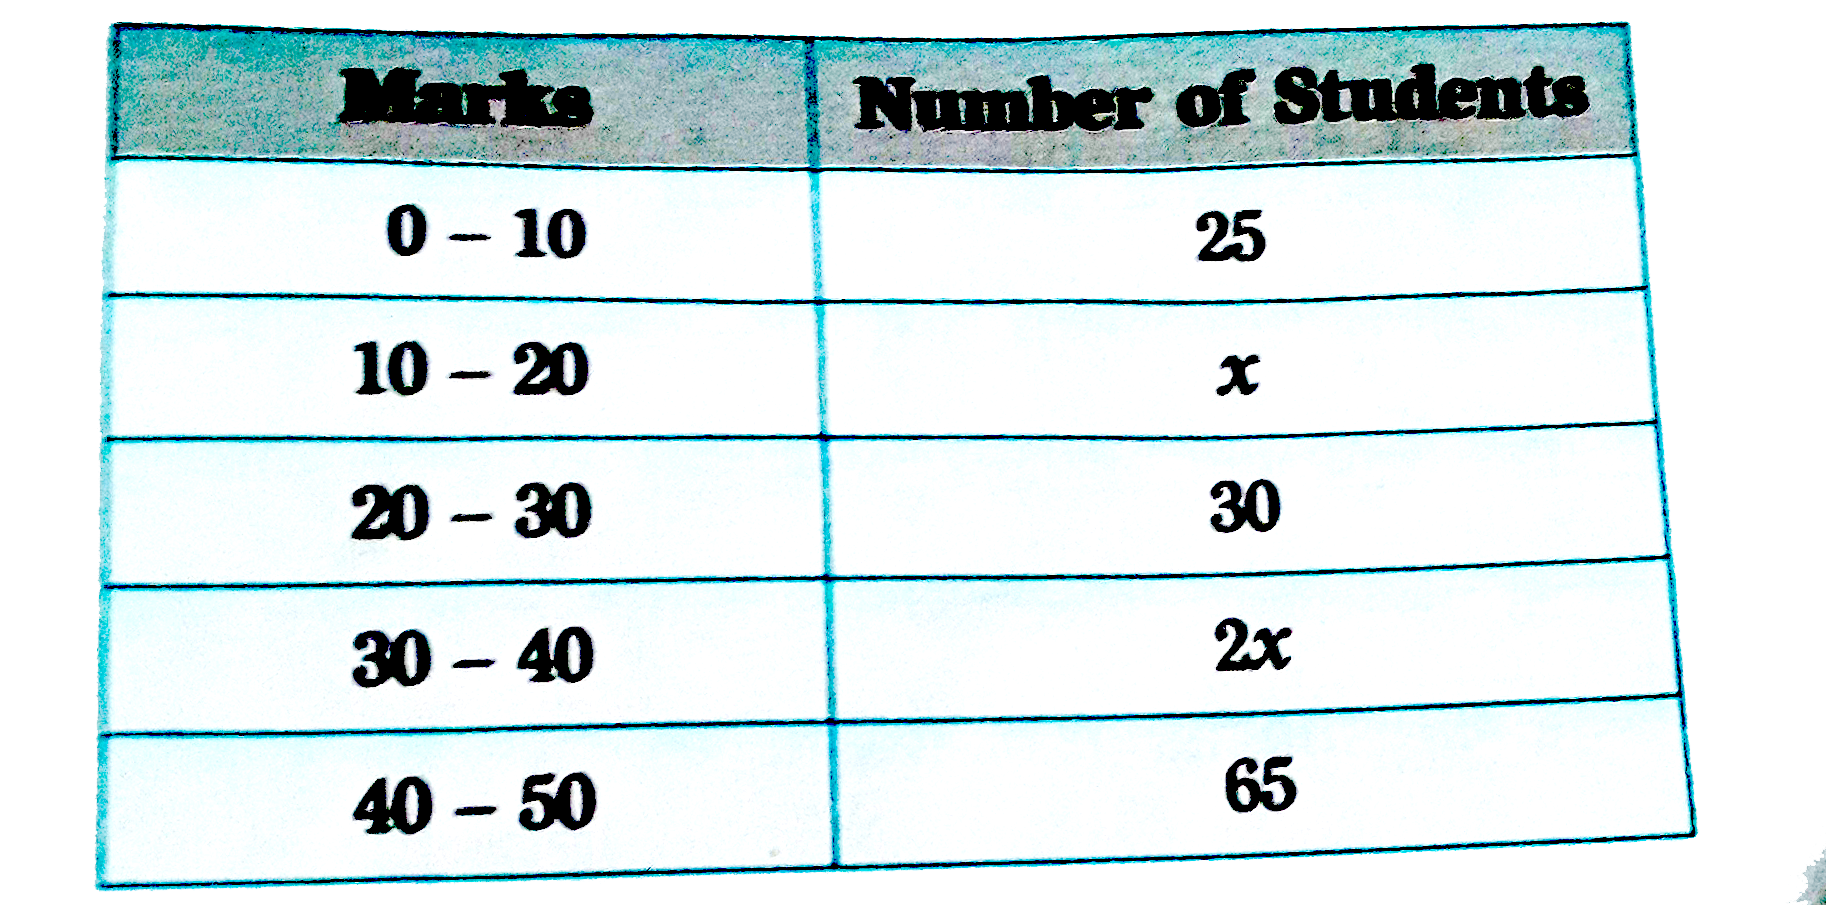
The following tale gives the result of certain examination for 180 students. Find the value of x and draw histogram.

The correct Answer is:x=20
Step by step video & image solution for The following tale gives the result of certain examination for 180 students. Find the value of x and draw histogram. by Maths experts to help you in doubts & scoring excellent marks in Class 10 exams.
Updated on:21/07/2023Topper's Solved these Questions
- STATISTICSBOOK - TARGET PUBLICATIONCHAPTER - STATISTICSEXERCISE - Practise Set 6.1
6 Videos
- STATISTICSBOOK - TARGET PUBLICATIONCHAPTER - STATISTICSEXERCISE - Practise Set 6.2
4 Videos
- STATISTICSBOOK - TARGET PUBLICATIONCHAPTER - STATISTICSEXERCISE - Apply your knowledge
5 Videos
- SIMILARITY BOOK - TARGET PUBLICATIONCHAPTER - SIMILARITY EXERCISE - Chapter Assessment
19 Videos
- TRIGONOMETRY BOOK - TARGET PUBLICATIONCHAPTER - TRIGONOMETRY EXERCISE - Chapter Assessment
18 Videos
Similar Questions
Knowledge Check
Which of the following can affect the results of student in the examination?
A(a) Number of Class works & Home works givenB(b) Working hours and days of the schoolC(c) Number of teacher-parent meetsD(d) All of the above
The following table is based on the marks of the first term examination of 10th class students . Show the information by a histogram. Also, draw a frequency polygon with the help of the histogram :

View SolutionThe following table is based on the marks of the first term examination of 10 th class student. Show the information by a histogram. Also, draw a frequency polygon with the help of the histogram:

View SolutionThe following table gives the marks scored by 100 students in an entrance examination

Represent this data in the form of a histogram.
View SolutionTime allotted for the preparation of an examination by some students is shown in the table. Draw a histogram to show the information.

View SolutionTime alloted for the preparation of an examination by some students is shown in the table. Draw a histogram to show the information.

View SolutionThe following frequency distribution table shows marks obtained by 180 students in Mathematics examination :

Find the value of x.
Also draw a histogram representing the above informations.
View SolutionThe following table shows the marks secored by a student in annual examination in various subjects. Draw a histogram to represent the given data.
SubjectTeluguHindiEnglishMathsScienceSocial StudiesMarks807482949088
View Solution

