The given graph represents the age and number of members of a hiking group who are planning an excursion. Study the graph and answer the following question.
Which age group has the maximum members in the hiking gruoup?
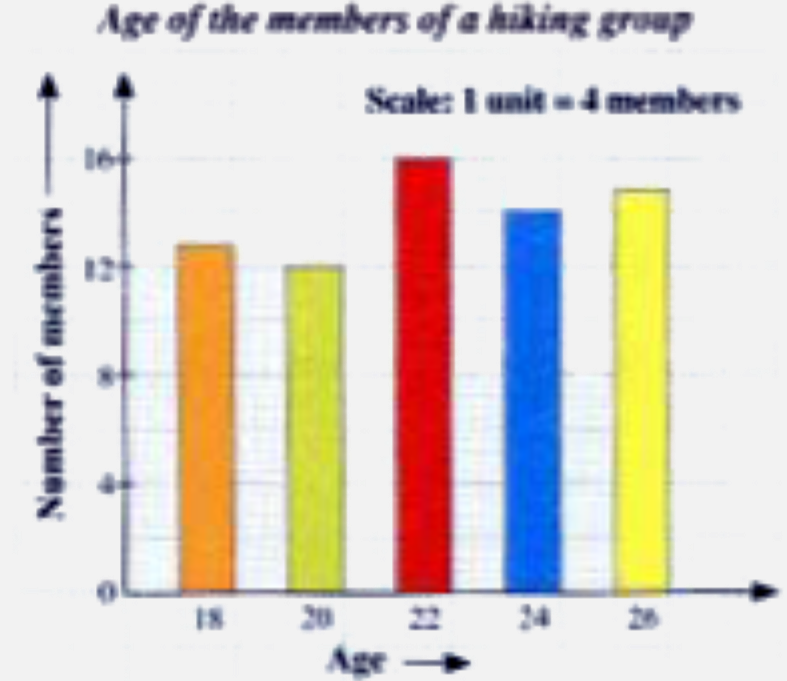
The correct Answer is:22 years
Step by step video & image solution for The given graph represents the age and number of members of a hiking group who are planning an excursion. Study the graph and answer the following question. Which age group has the maximum members in the hiking gruoup? by Maths experts to help you in doubts & scoring excellent marks in Class 7 exams.
Updated on:21/07/2023Topper's Solved these Questions
- DATA HANDLING AND MEASURES OF CENTRAL TENDENCYBOOK - ICSECHAPTER - DATA HANDLING AND MEASURES OF CENTRAL TENDENCYEXERCISE - TRY THIS
19 Videos
- DATA HANDLING AND MEASURES OF CENTRAL TENDENCYBOOK - ICSECHAPTER - DATA HANDLING AND MEASURES OF CENTRAL TENDENCYEXERCISE - REVISION EXERCISE
39 Videos
- CONSTRUCTIONS BOOK - ICSECHAPTER - CONSTRUCTIONS EXERCISE - REVISION EXERCISE
12 Videos
- DATA HANDLING BOOK - ICSECHAPTER - DATA HANDLING EXERCISE - EXERCISE 24D
13 Videos
Similar Questions
The given graph represents the age and number of members of a hiking group who are planning an excursion. Study the graph and answer the following question.
Which age group has the least members in the hiking group?

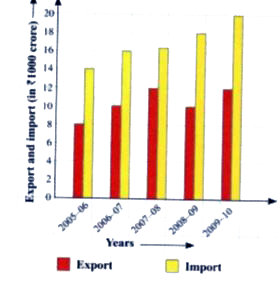
View SolutionRead the bar graph and answer the following questions.
In which year the difference of the values of export and import is maximum?
View Solution
Knowledge Check
Refer to the given graph carefully and answer the following question.

Which of the labelled parts on the graph represents rigor mortis?AXBWCZDY
Study the bar graph representing the number of persons in various age groups in a town shown in Figure. Observe the bar graph and answer the following questions:
(i)What is the percentage of the youngest age-group persons over those in the oldest age group?
(ii)What is the total population of the town?
(iii)What is the number of persons in the age group 60-65?
(iv)What is the age-group of exactly 1200 persons living in the town?
(v)What is the total number of persons living in the town in the age group 50-55?
(vi)What is the total number of persons living in the town in the age group 10-15 and 60-65?
View SolutionStudy the bar graph representing the number of persons in various age groups in a town shown in Figure. Observe the bar graph and answer the following questions: What is the percentage of the youngest age-group persons over those in the oldest age group? What is the total population of the town? What is the number of persons in the age-group 60-65? How many persons are more in the age-group 10-15 then in the age group 30-35? What is the age-group of exactly 1200 persons living in the town? What is the total number of persons living in the town in the age-group 50-55? What is the total number of persons living in the town in the age-groups 10-15 and 60-65? Whether the population in general increases, decreases or remains constant with the increase in the age-group.
View SolutionObserve the bar graph given below :
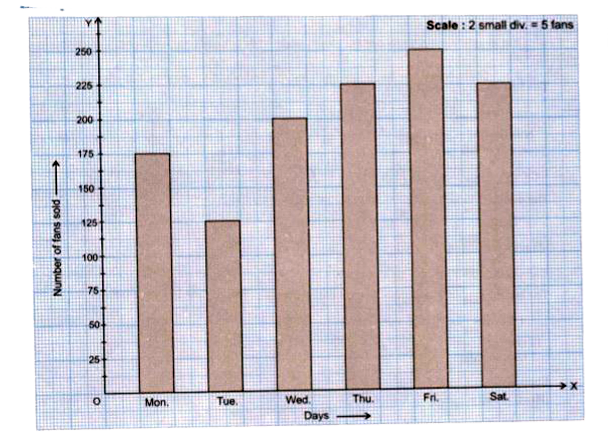
Read the bar graph carefully and answer the following questions :
On which day of the week was the sale maximum?
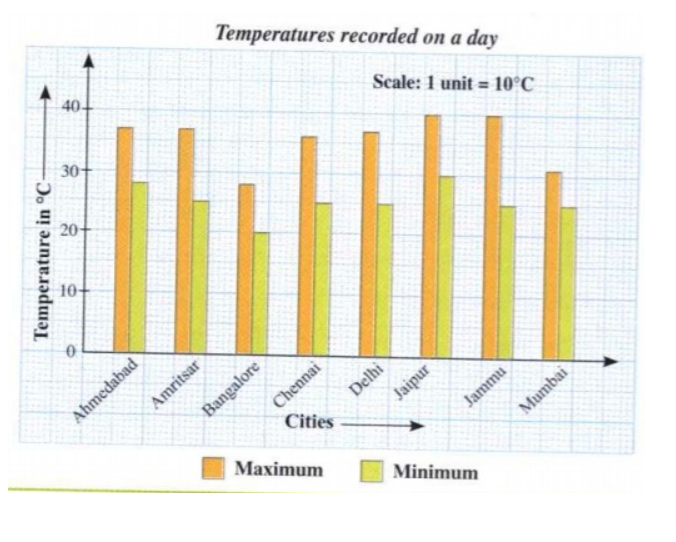
View SolutionThe following graph gives the minimum and maximum temperatures of various cities on a specific day. Read the graph and answer the following questions
Name the city which has the minimum difference between its minimum and maximum temperatures.

View SolutionExmine the given graph carefully.
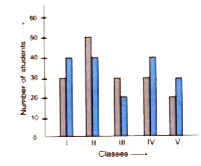
In the graph show above represents the number of girls in a particular class and represents the number of boys in the same class.
Read and answer the following questions.
(i) Which class has the least number of students ?
(ii) Which class has maximum number of students ?
(iii) What is the ratio between the number of girls and the number of boys of class V.
View SolutionThe following graph gives the minimum and maximum temperatures of various cities on a specific day. Read the graph and answer the following questions
Which are the hottest and the coldest cities on the given day?
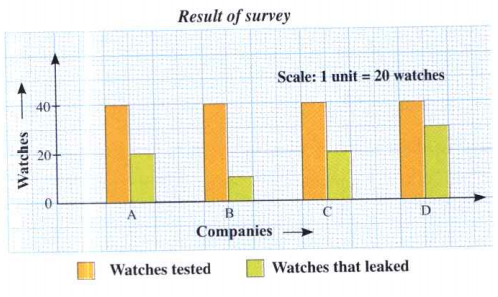
View SolutionThe following graph shows the result of a survey to test water resistant watches made by four different companies. Read the graph and answer the following question.
Which company has the best watches?
View Solution
