The given graph represents the total runs scored by two batsmen A and B durin each of the ten different matches in the year 2017. Study the graph and answer the questions that follow :
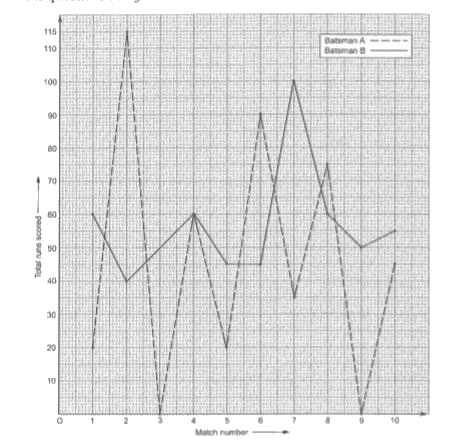
(i) What information is given on the two axes in the given graph ?
(ii) In which two matches did batsman B score the same number of runs ?
(iii) Were the runds scored by the two batsmen same in any of the matches ? If so , in which match?
(iv) Among the two batsmen, who is steadier ? How do you judge it ?
Step by step video & image solution for The given graph represents the total runs scored by two batsmen A and B durin each of the ten different matches in the year 2017. Study the graph and answer the questions that follow : (i) What information is given on the two axes in the given graph ? (ii) In which two matches did batsman B score the same number of runs ? (iii) Were the runds scored by the two batsmen same in any of the matches ? If so , in which match? (iv) Among the two batsmen, who is steadier ? How do you judge it ? by Maths experts to help you in doubts & scoring excellent marks in Class 8 exams.
Updated on:21/07/2023Topper's Solved these Questions
- LINE GRAPHS AND LINEAR GRAPHSBOOK - RS AGGARWALCHAPTER - LINE GRAPHS AND LINEAR GRAPHSEXERCISE - Exercise 23
25 Videos
- INTRODUCTION TO COORDINATE GEOMETRYBOOK - RS AGGARWALCHAPTER - INTRODUCTION TO COORDINATE GEOMETRYEXERCISE - EXERCISE B (OBJECTIVE QUESTIONS)
7 Videos
- LINEAR EQUATIONSBOOK - RS AGGARWALCHAPTER - LINEAR EQUATIONSEXERCISE - TEST PAPER-8 (D) (Write .T. for true and .F. for false for each of the following:)
1 Video
Similar Questions
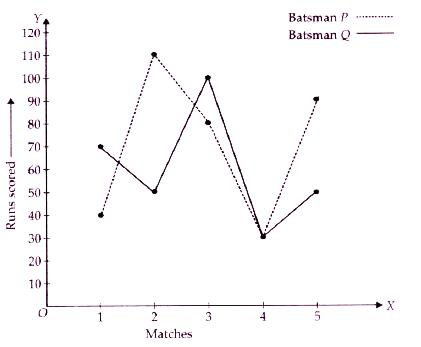
Performance based graph) The given graph shows the total runs scored by two batmans P and Q during each of the five different matches in the year 2011. study the graph and answer the following questions :
What information is given on the axes?
View Solution(A graph on “performance”)The given graph (Fig 15.7) represents the total runs scored by two batsmen A and B, during each of the ten different matches in the year 2007. Study the graph and answer the following questions.(i) What information is given on the two axes?(ii) Which line shows the runs scored by batsman A?(iii) Were the run scored by them same in any match in 2007? If so, in which match?(iv) Among the two batsmen, who is steadier? How do you judge it?
View Solution
Knowledge Check
What is the average run scored by the batsman man in the five matches?
AA.50BB.49CC.45DD.46.25The given bar graph shows the biscuit exports of India over a period of five years. Study the graph and answer the questions that follows
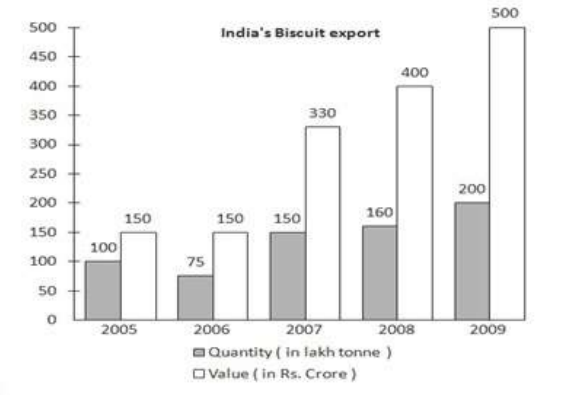
In which two year was the value per tonne equal?A2006 and 2007B2008 and 2009C2007 and 2008D2005 and 2006The given bar graph represents the number of boys and girls in five different schools. Study the graph and answer the question that follows
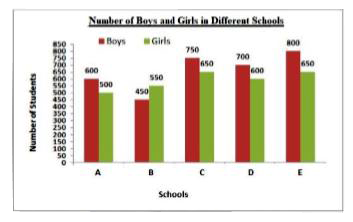
In which school is the percentage of girls the lowest ?AABBCEDC
Performance based graph) The given graph shows the total runs scored by two batmans P and Q during each of the five different matches in the year 2011. study the graph and answer the following questions :
Which line shows the runs scored by batmans Q?
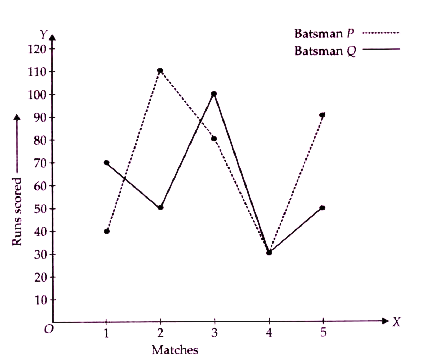
View SolutionPerformance based graph) The given graph shows the total runs scored by two batmans P and Q during each of the five different matches in the year 2011. study the graph and answer the following questions :
Were the run scored by them same in any match in 2011? if so, in which match? .
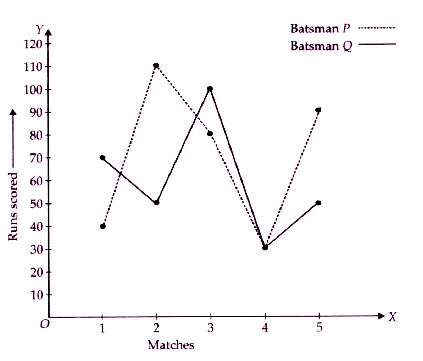
View SolutionRead the bar graph given below and answer the following questions:
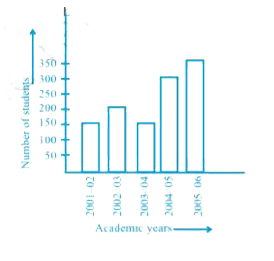
What information is given by the þar graph?
View SolutionRead the following bar graph given in figure and answer the following questions.
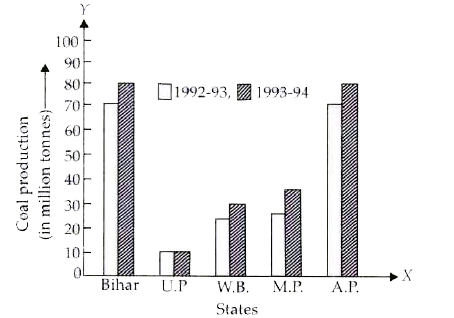
(i) What information is given by this bar graph?
View SolutionThe given bar graph represents the number of bodys and girls in five different schools. Study the graph and answer the question that follows
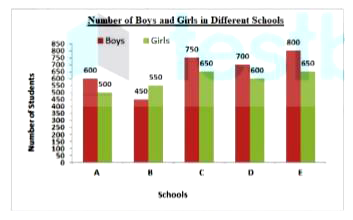
What is the average number of boys in schools A, B, C, D and E?
View Solution