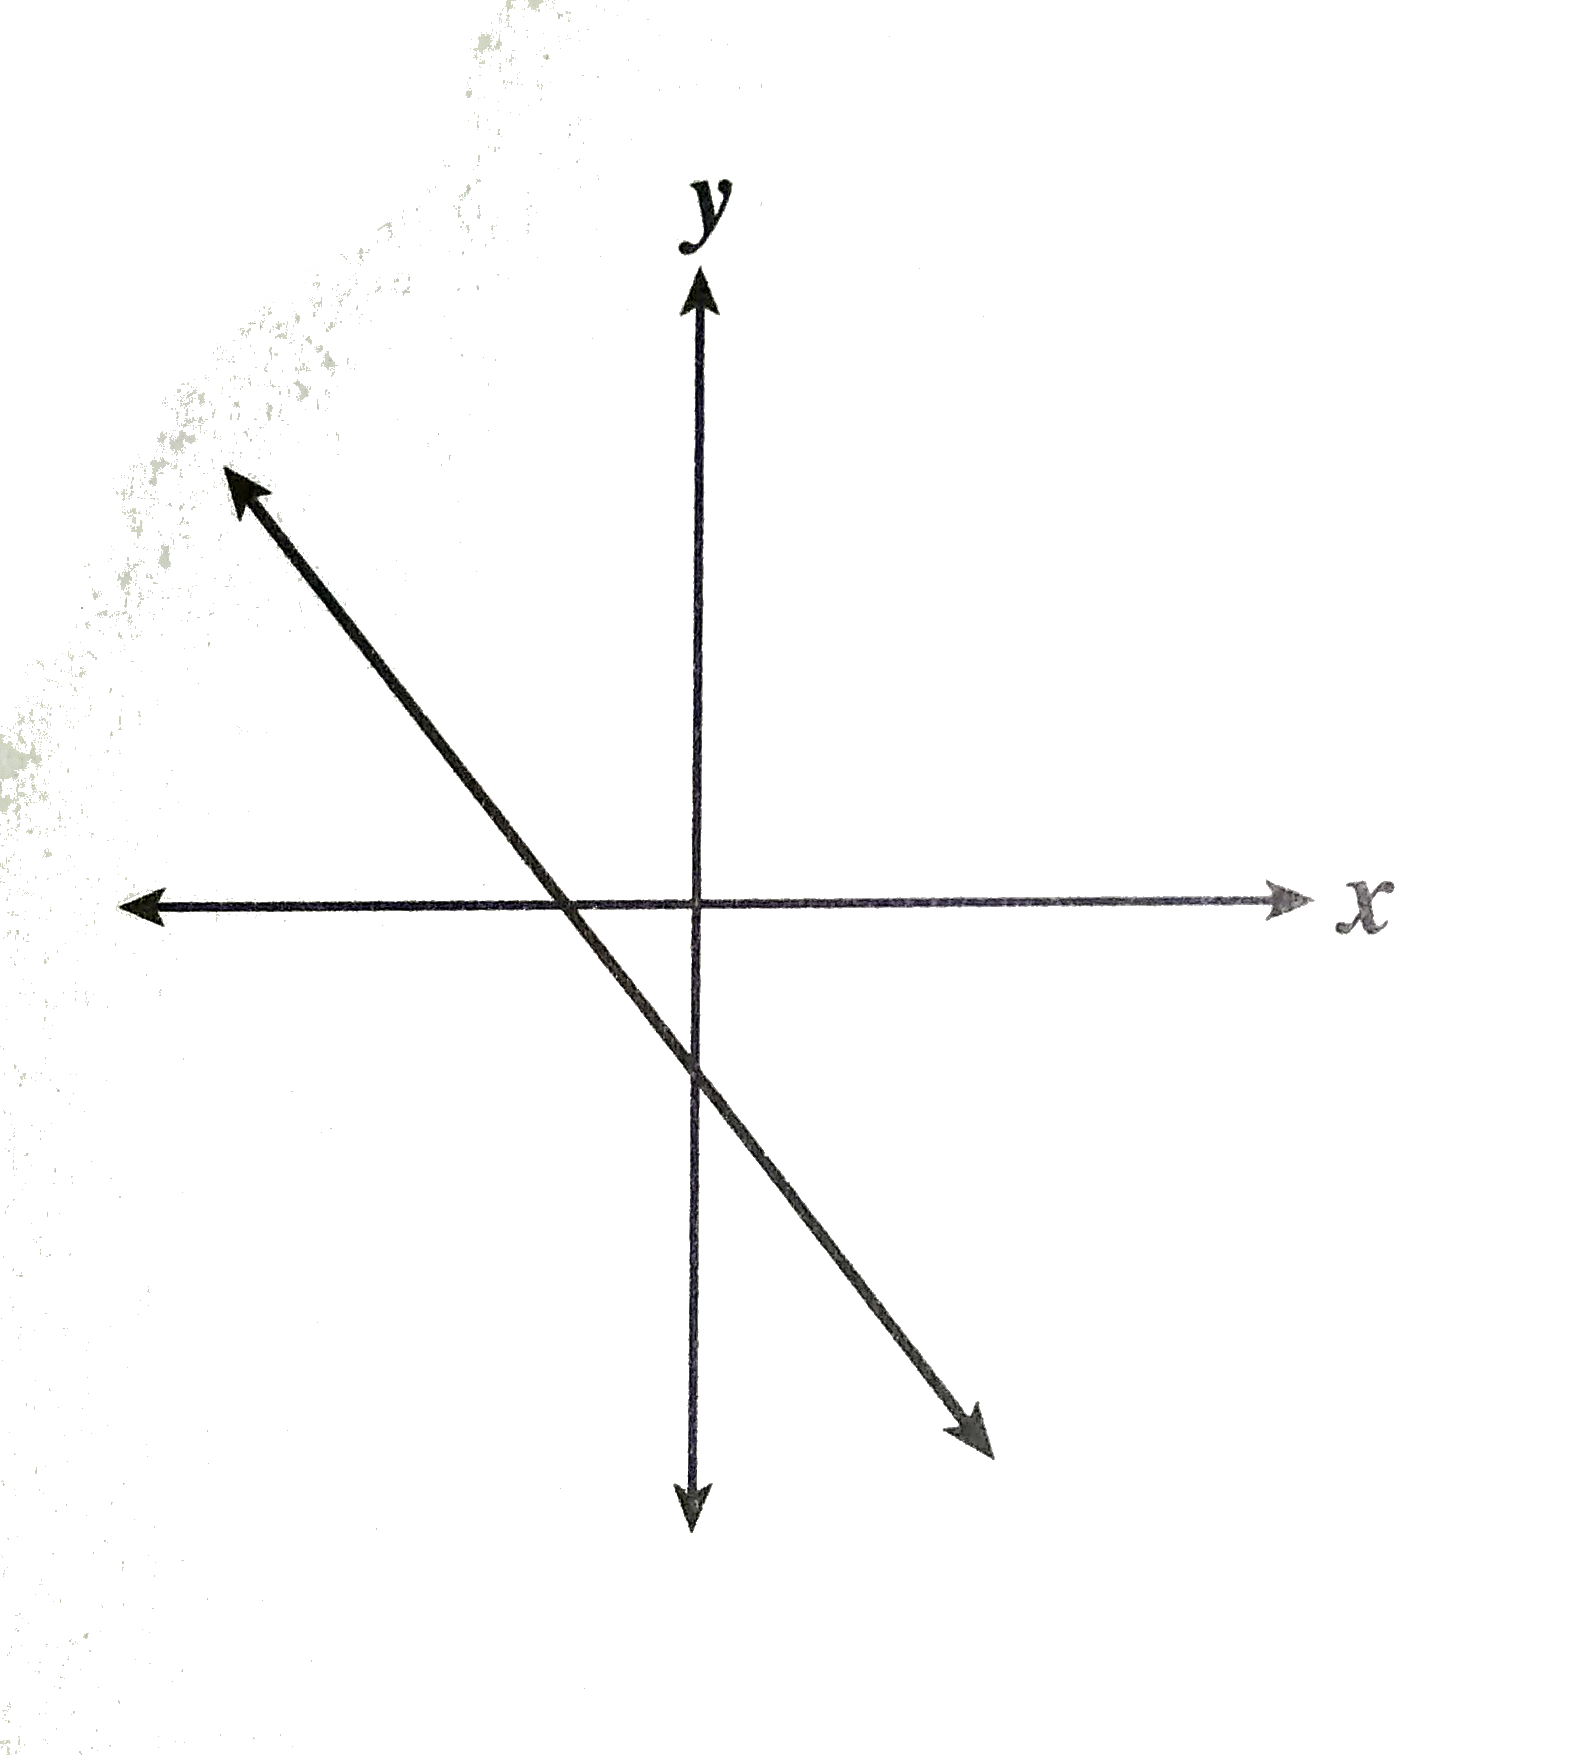
The given graph represents which of the following

A
x∈(−∞,−2)
B
x∈(−∞,−2]
C
x∈(−2,∞]
D
x∈[−2,∞)
Video Solution
Text Solution
The correct Answer is:B
The given graph represents all values less than -2 including -2.
⇒x∈(−∞,−2]
|
Topper's Solved these Questions
- LINEAR INEQUALITIESBOOK - NCERT EXEMPLAR ENGLISHCHAPTER - LINEAR INEQUALITIESEXERCISE - Long Answer Type Question
6 Videos
- LIMITS AND DERIVATIVES BOOK - NCERT EXEMPLAR ENGLISHCHAPTER - LIMITS AND DERIVATIVES EXERCISE - FILLERS
4 Videos
- MATHEMATICAL REASONING BOOK - NCERT EXEMPLAR ENGLISHCHAPTER - MATHEMATICAL REASONING EXERCISE - OBJECTIVE TYPE QUESTIONS
21 Videos
Similar Questions
Knowledge Check
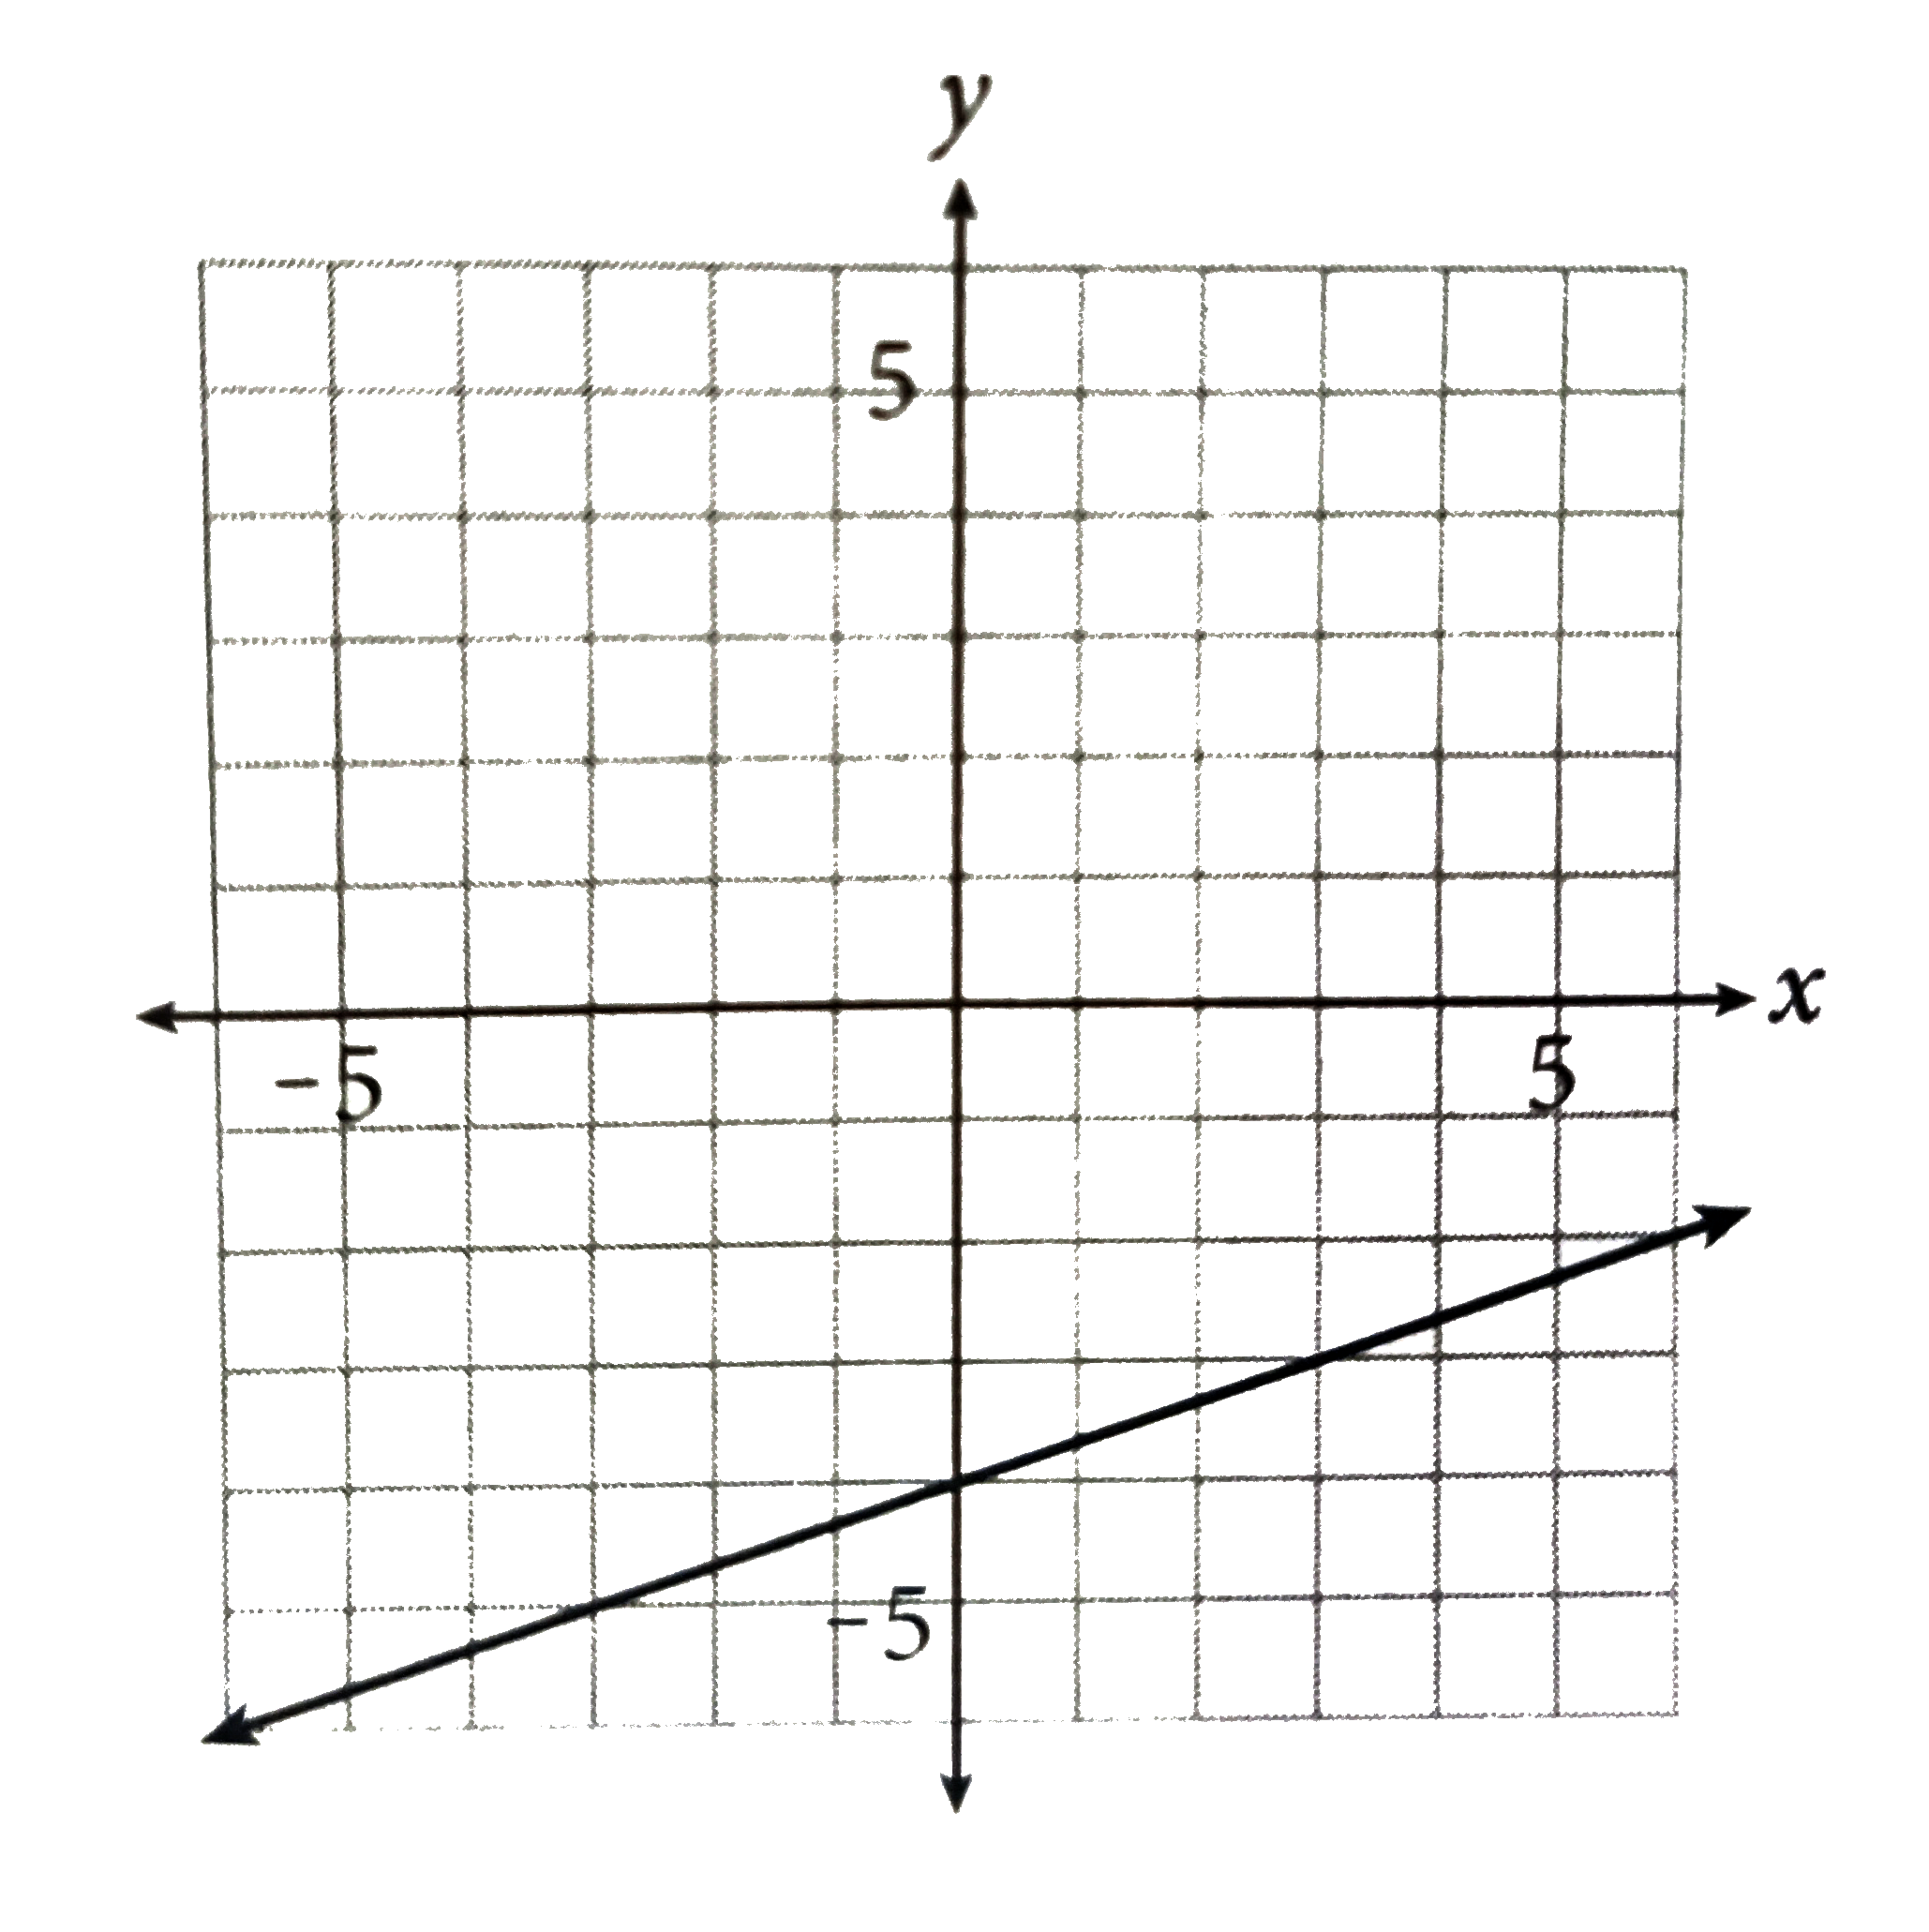
The graph shown represents which of the following equations ?Ay=−3x+4By=−13x+4Cy=13x−4Dy=3x−4The given acceleration-time graph represents which of the following physical situation?
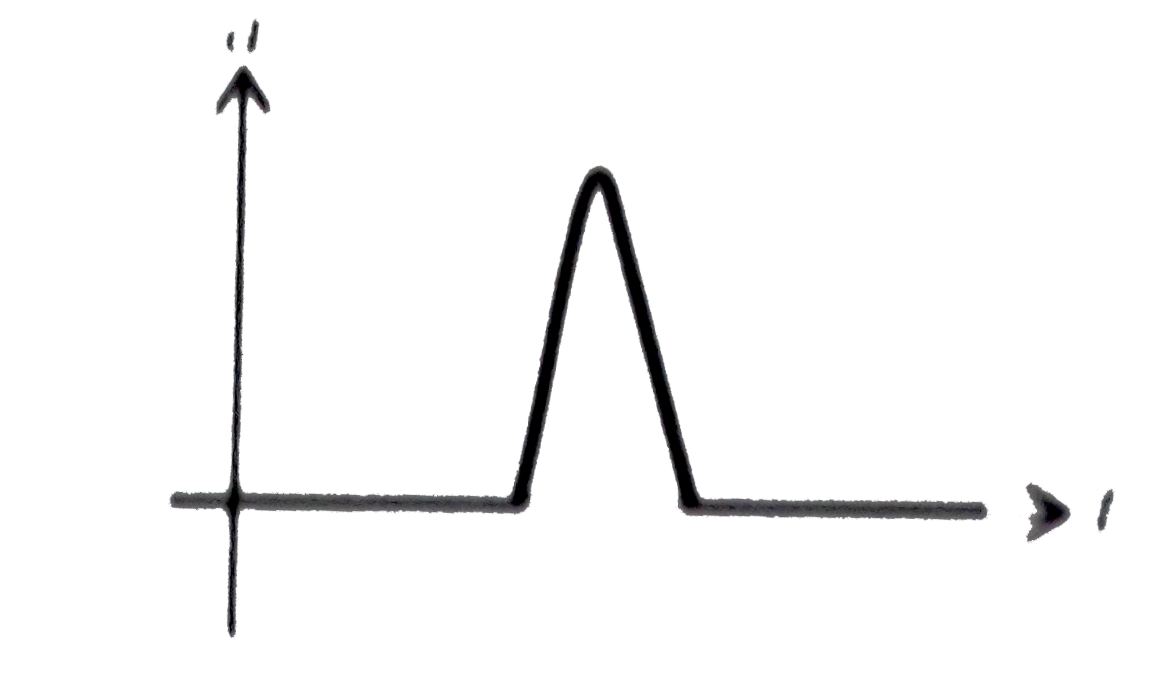 AA cricket ball moving with a uniform speed is hit with a bat for a very short time interval.BA ball is falling freely from the top of a tower.CA car moving with constant velocity on a straight road.DA football is kicked into the air vertically upwards.
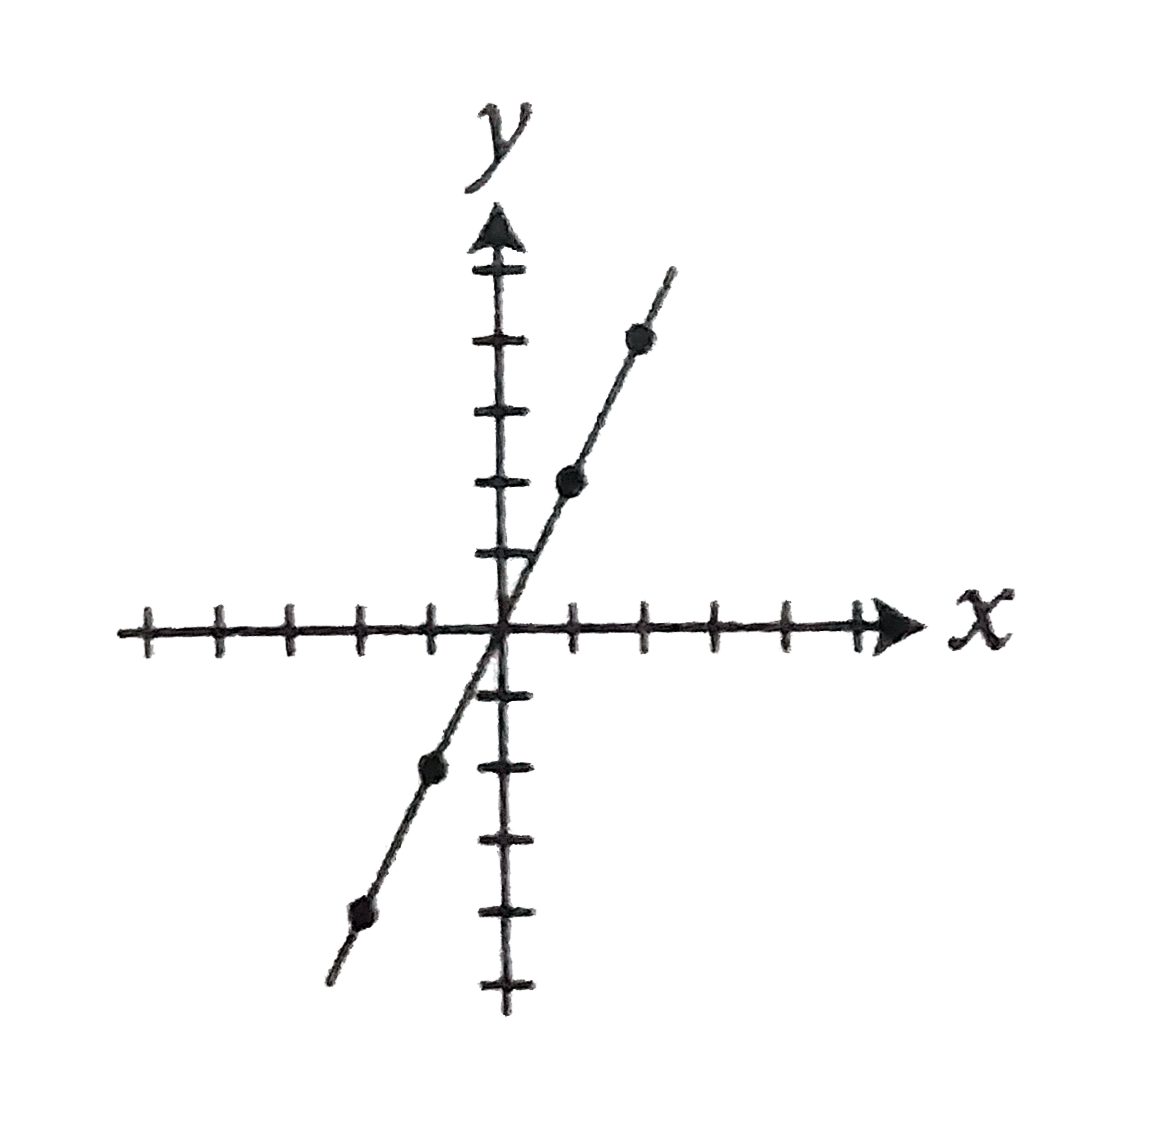
The graph above shows y=2x. Which of the following graphs represents y=|2x|?A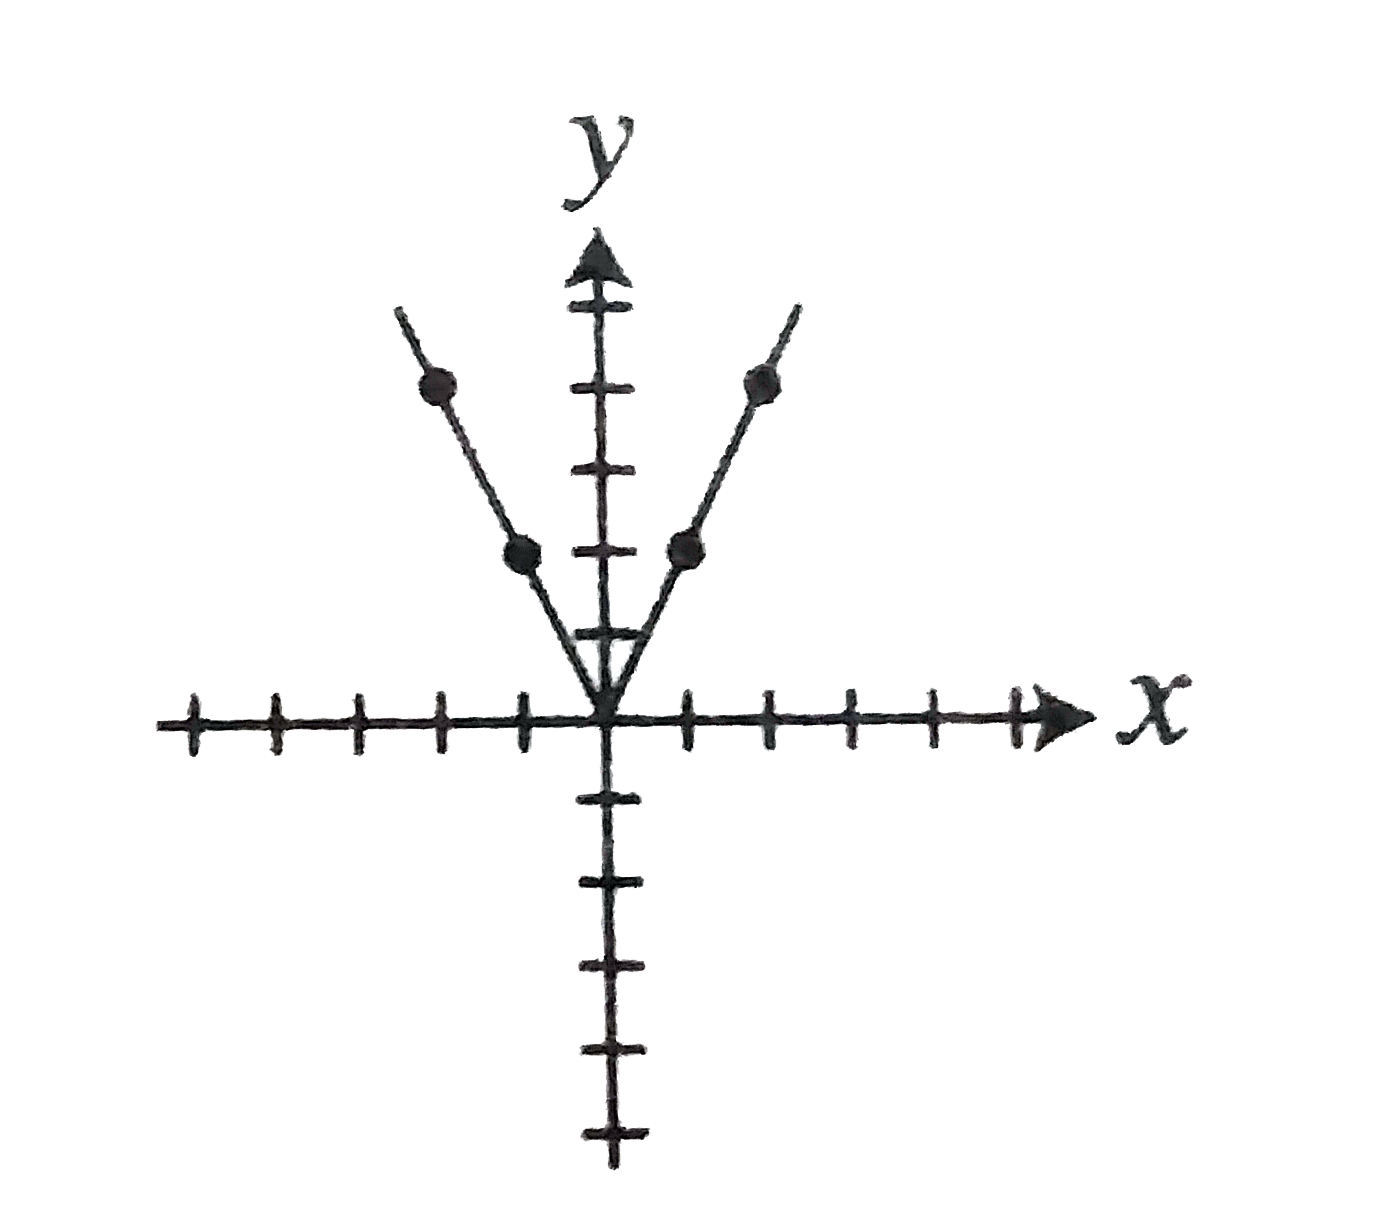 B
B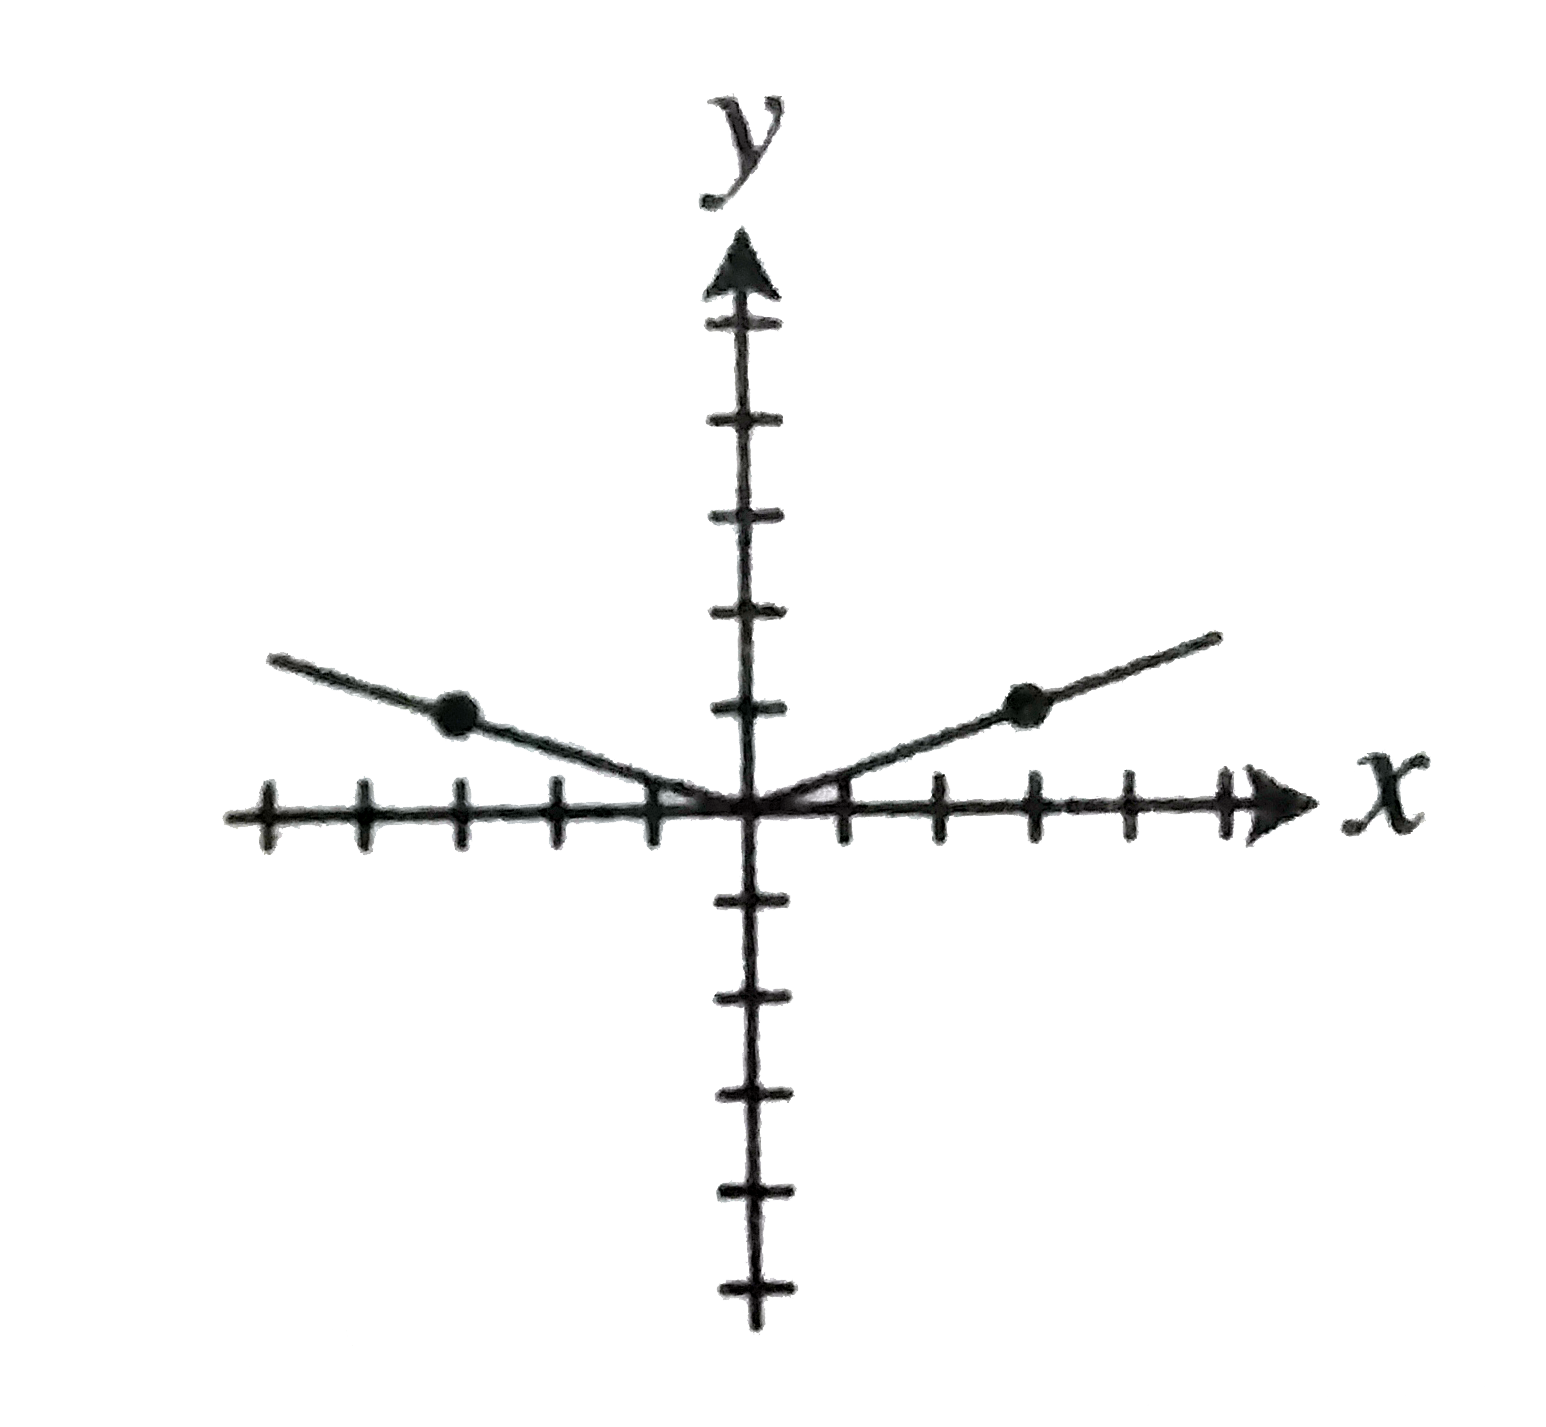 C
C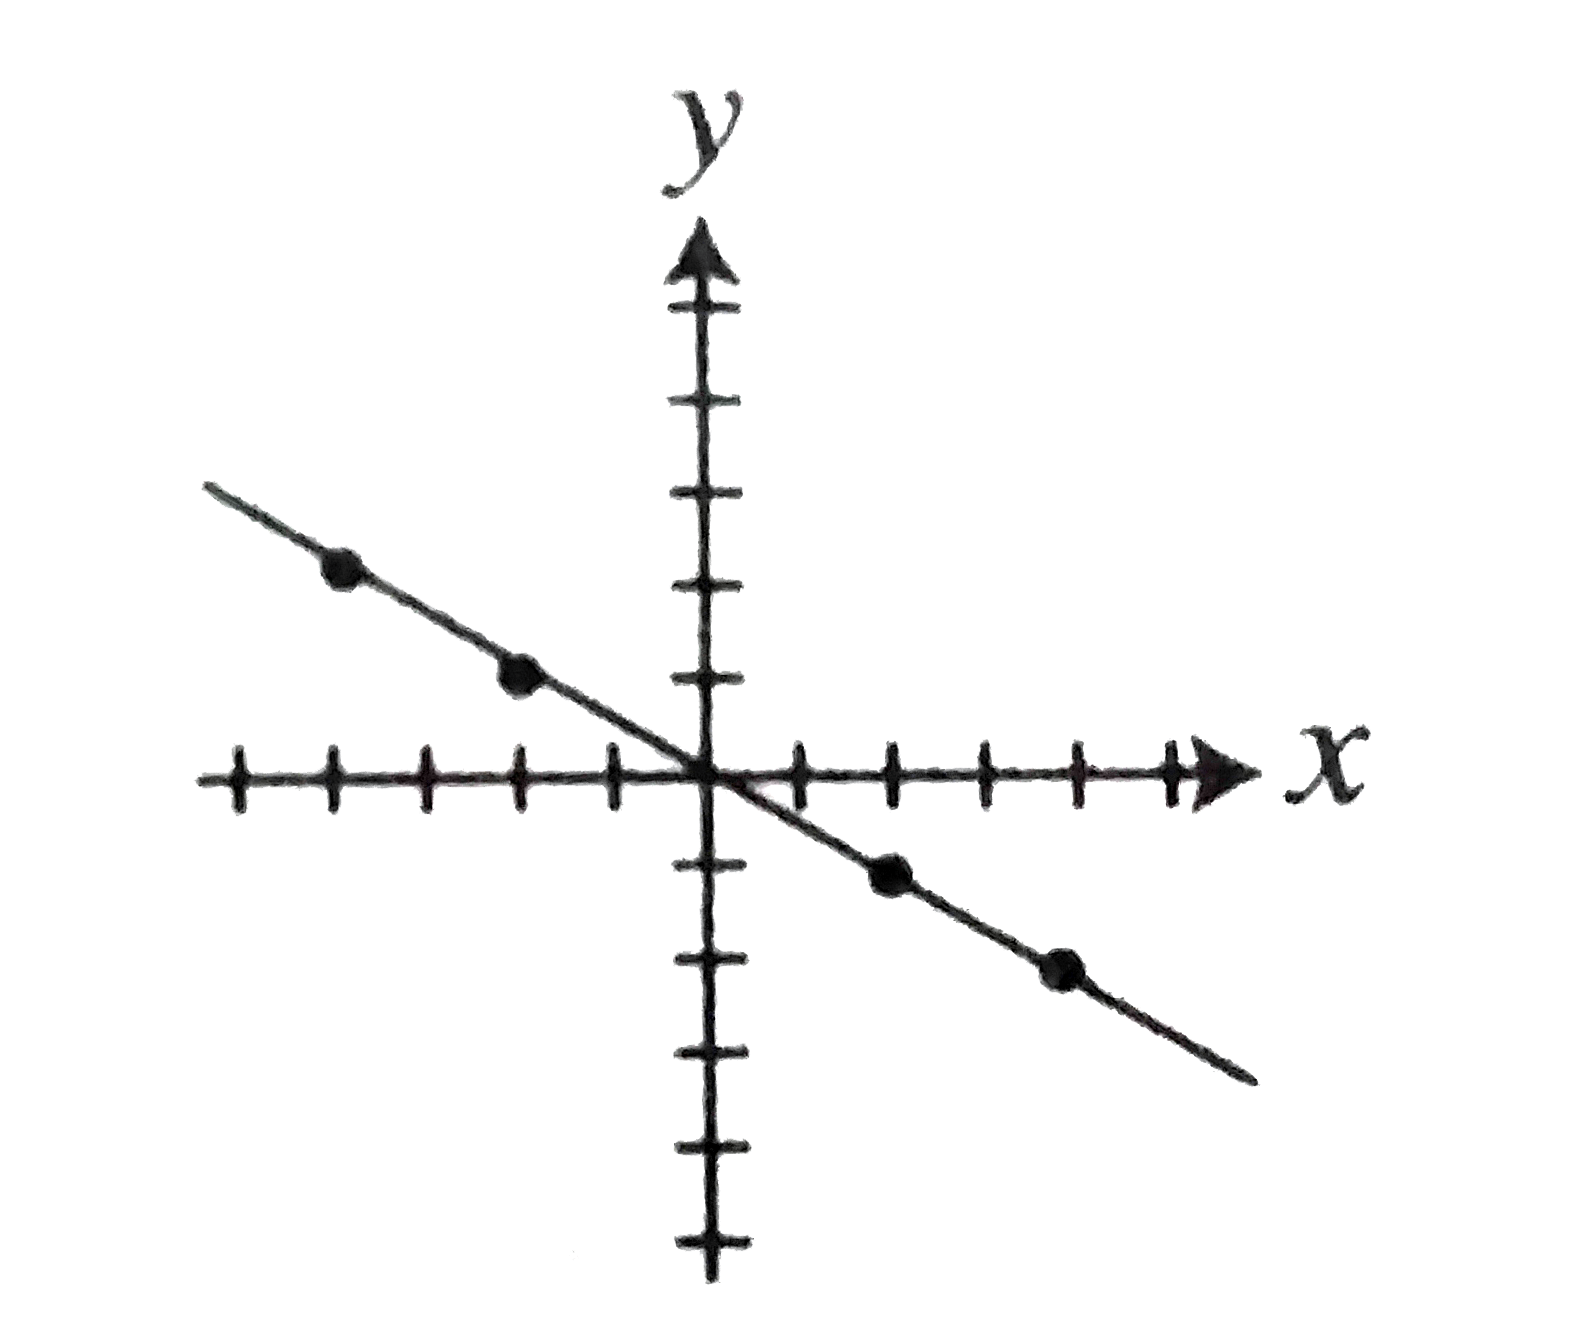 D
D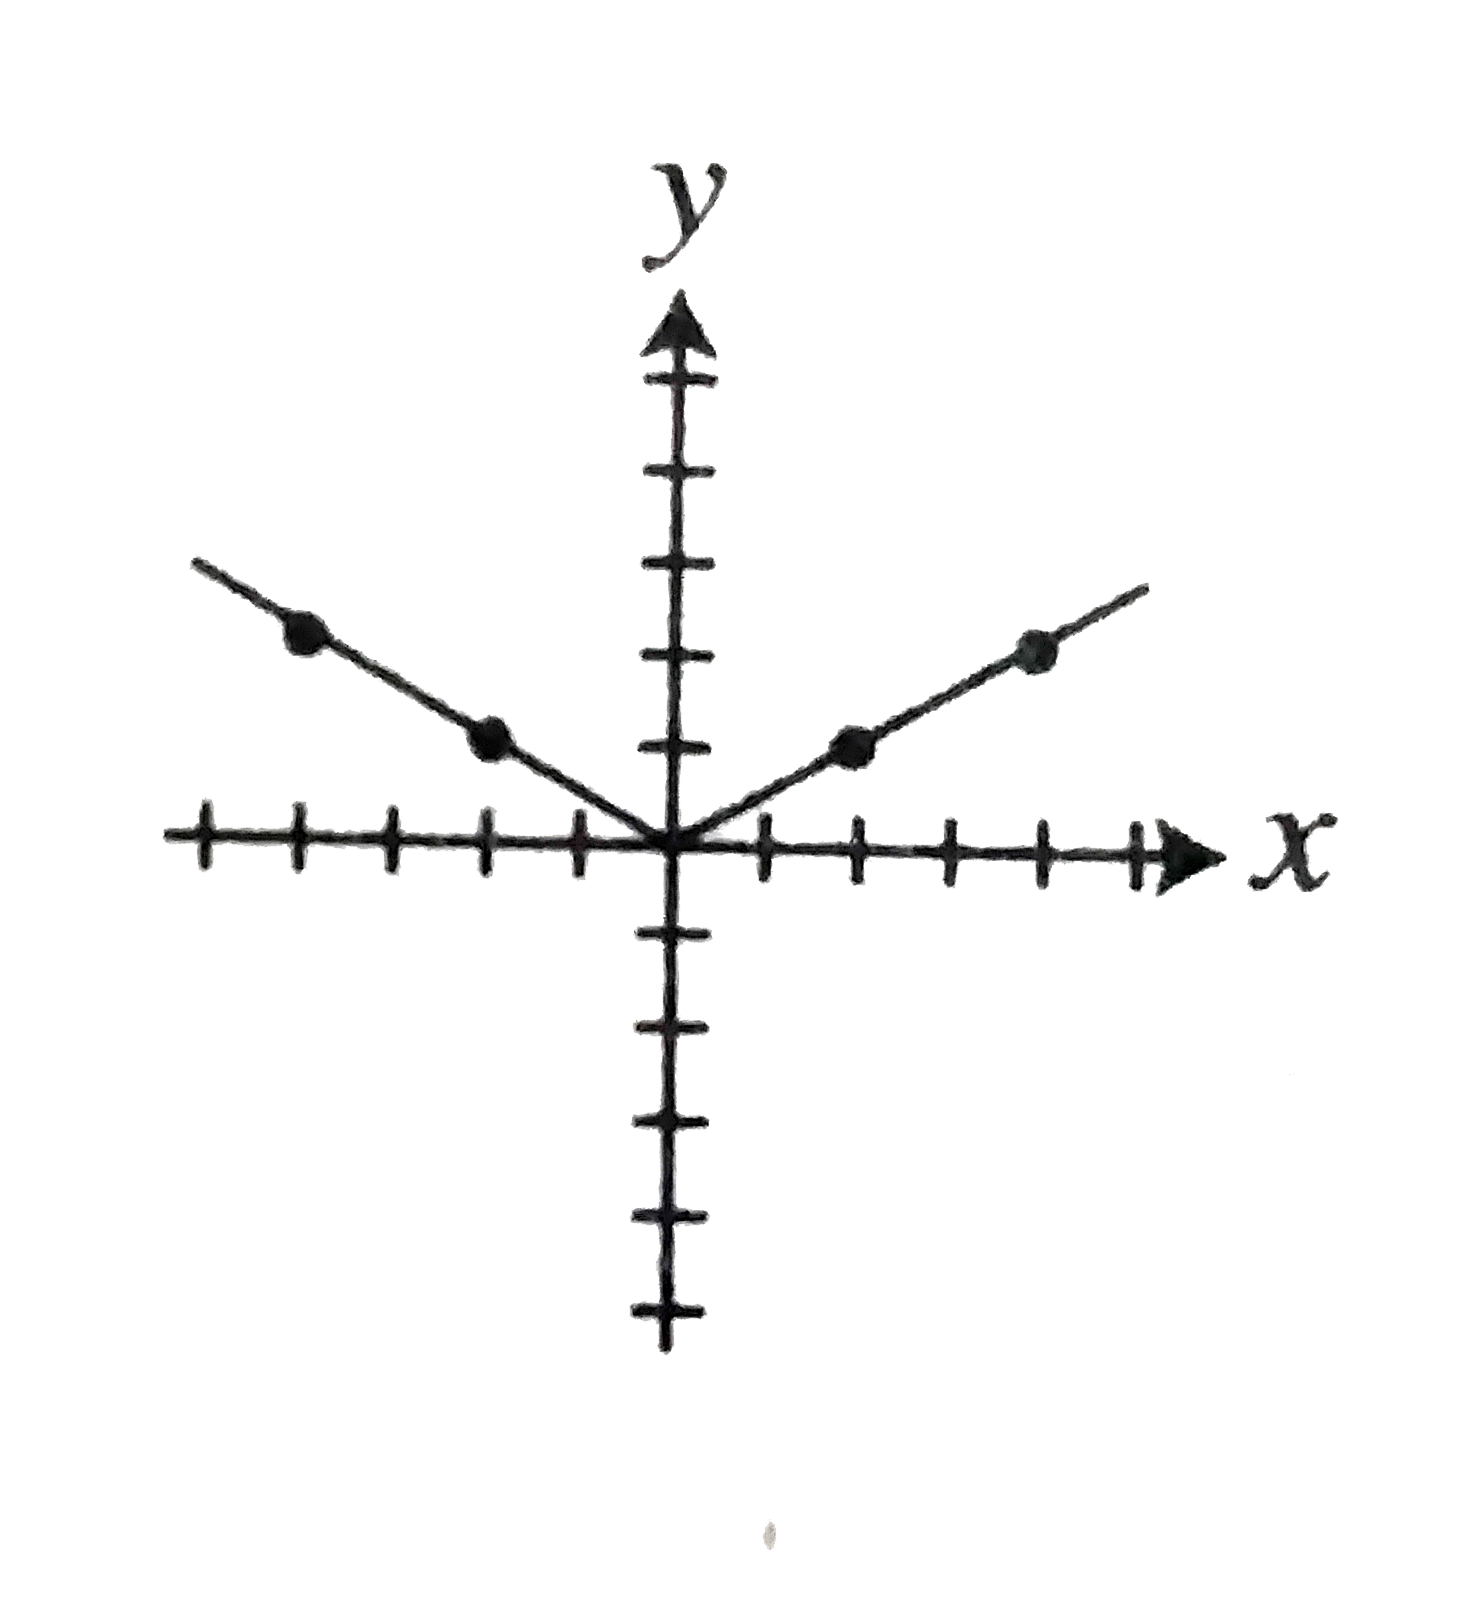
From the given graph
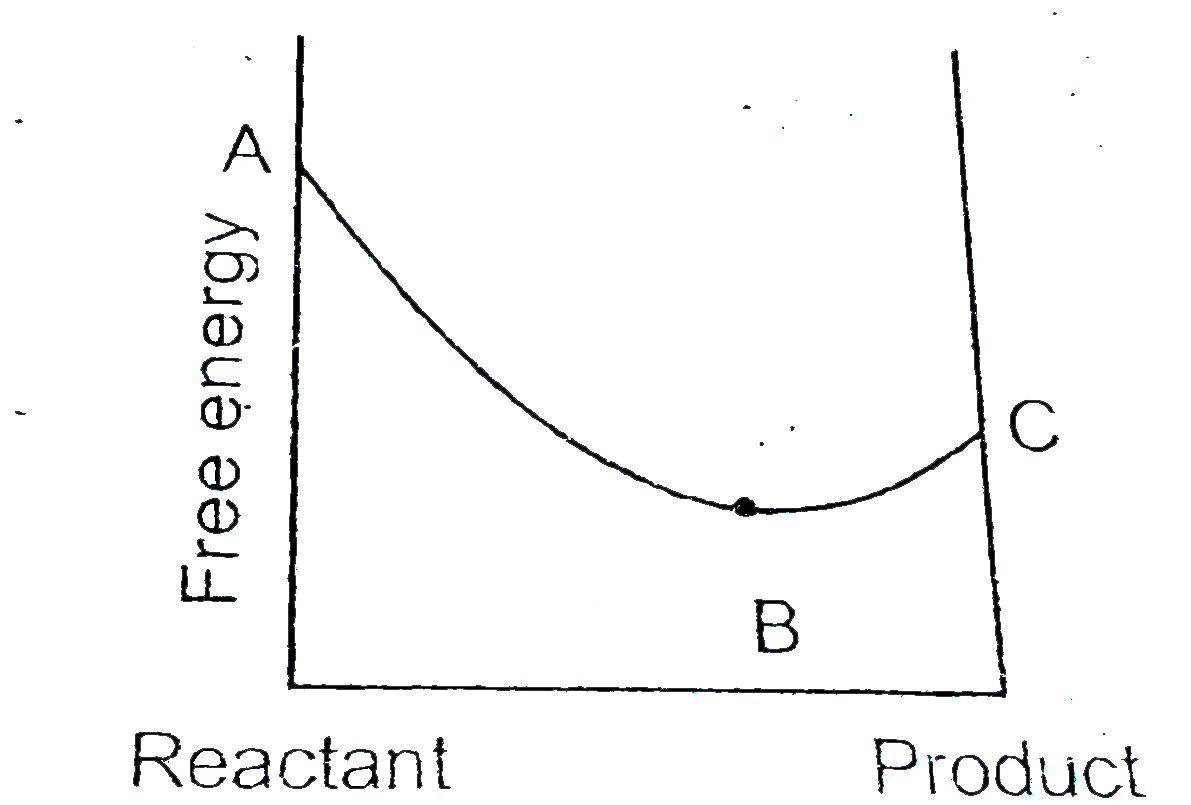
Which of the following statement is correct ?
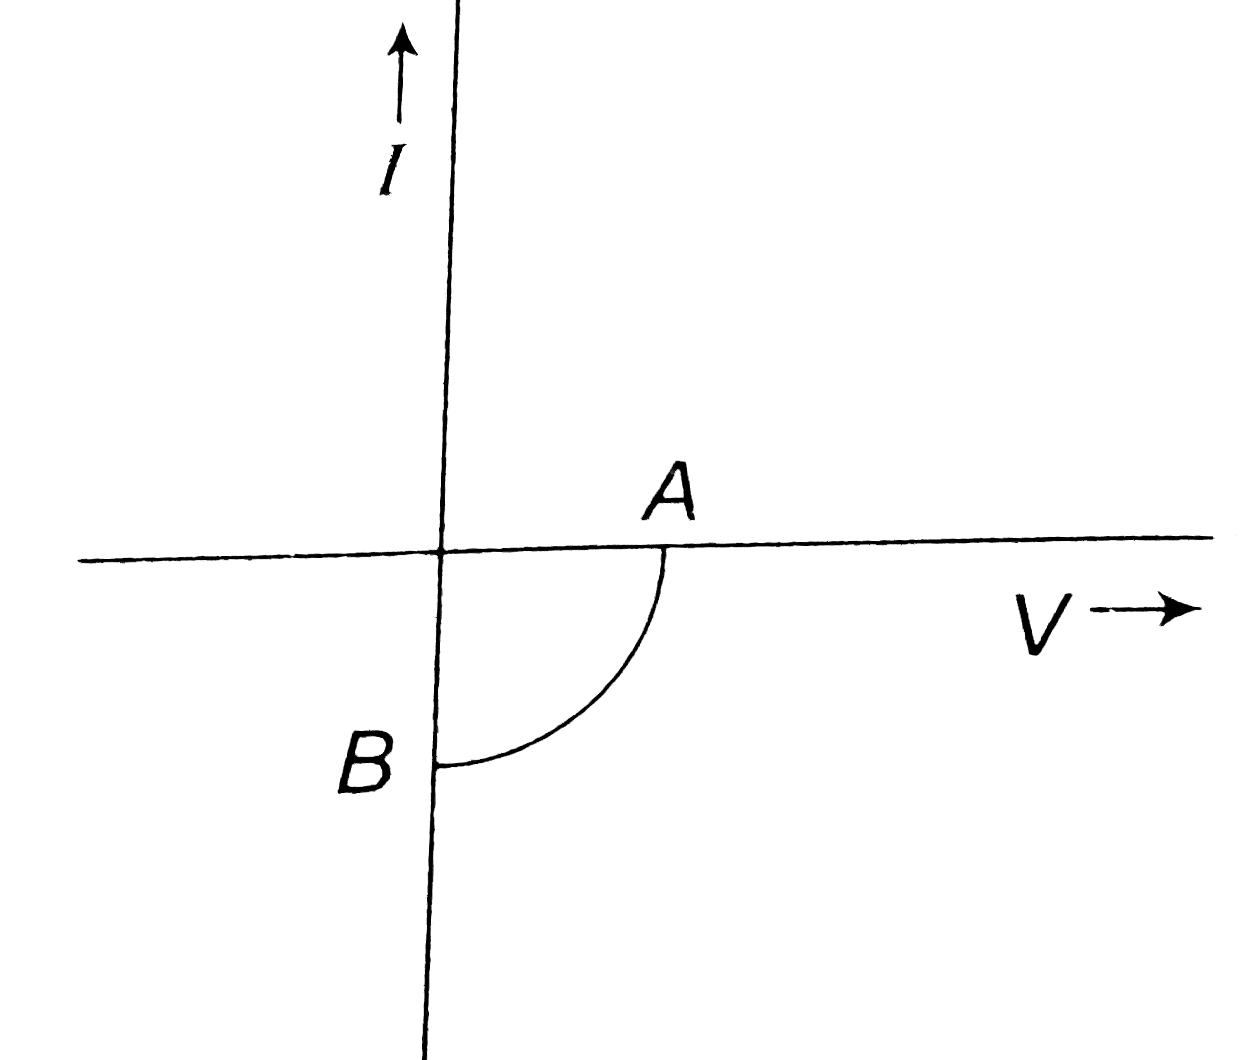
View SolutionThe given graph represents V−I characteristic for a semiconductor device.
which of the following statement is correct?
View SolutionThe given graph represents the variations of compressibility factor Z=pv/nRT vs P for three real gases Which of the following statements is wrong?
View Solution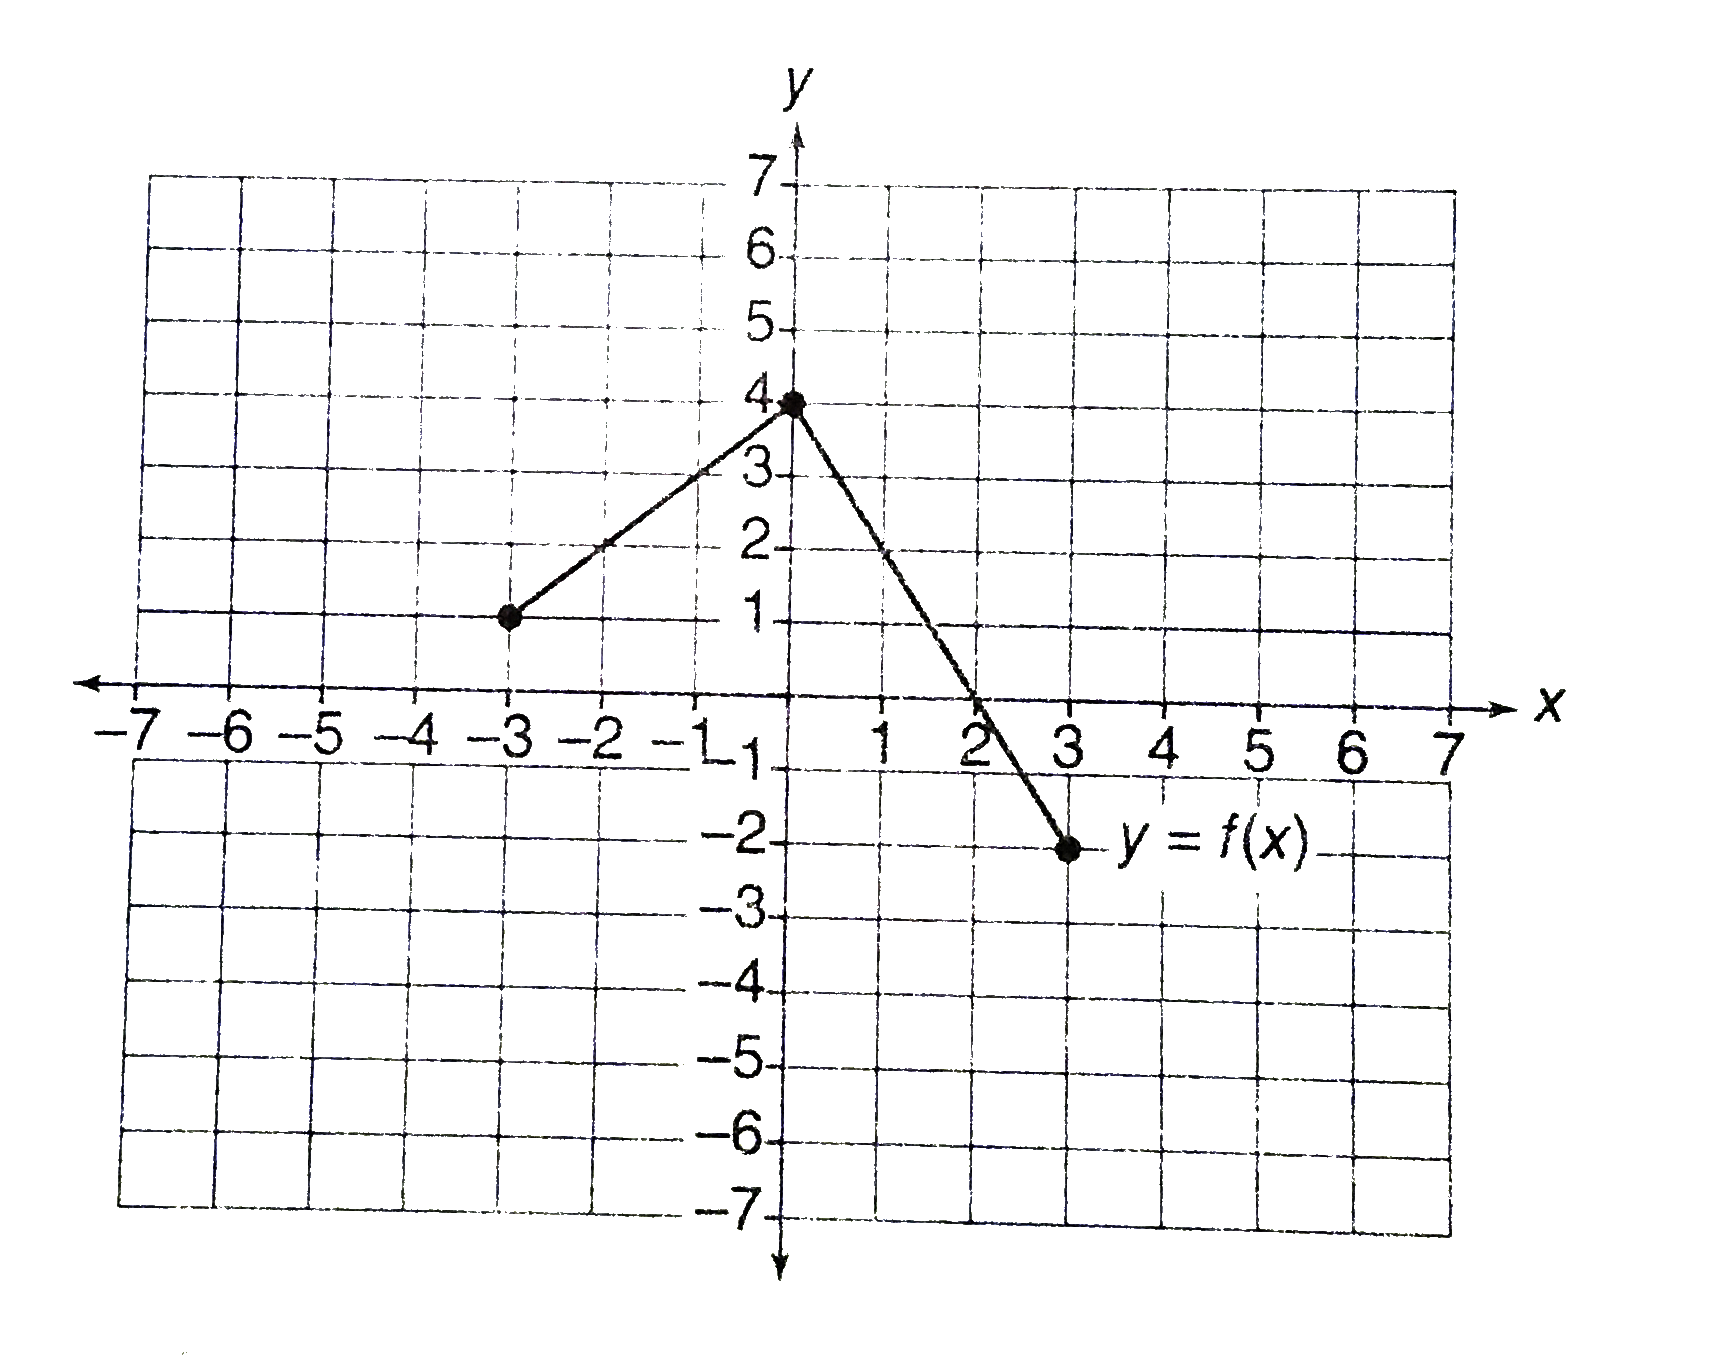
If the accomanying figure above shows the graph of function f, which of the following could represent the graph of y=f(x+1)?
View SolutionIf (x,y) represents a point on the the graph of y=2x+1, which of the following could be a portion of the graph of the set of points (x,y2)?
View Solution

