The given graph shows the sale of story books in a bookshop for the first 6 months.
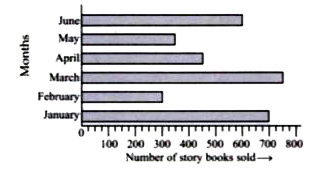
In which month, the sale of story books was 54 of the sale of books in June ?
February
March
April
May
The correct Answer is:B
Step by step video & image solution for The given graph shows the sale of story books in a bookshop for the first 6 months. In which month, the sale of story books was (5)/(4) of the sale of books in June ? by Maths experts to help you in doubts & scoring excellent marks in Class 6 exams.
Updated on:21/07/2023Topper's Solved these Questions
- DATA HANDLING BOOK - MTG IIT JEE FOUNDATIONCHAPTER - DATA HANDLING EXERCISE - Exercise (Subjective Problems (Integer/Numerical Value Type )
10 Videos
- BASIC GEOMETRICAL IDEASBOOK - MTG IIT JEE FOUNDATIONCHAPTER - BASIC GEOMETRICAL IDEASEXERCISE - OLYMPIAD/HOTS CORNER
10 Videos
- DECIMALSBOOK - MTG IIT JEE FOUNDATIONCHAPTER - DECIMALSEXERCISE - OLYMPIAD/HOTS CORNER
20 Videos
Similar Questions
Read the following bar graph shown in Figure and answer the following questions: What is the information given by the bar graph? In which month was the sale of the book maximum? In which month was the sale of the book minimum? What is the total sale of the book during these five months?
View SolutionThe given bar graph represents the sale of cars in five different states in a month.
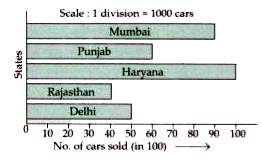
Which state sold 5000 cars ?
View Solution
Knowledge Check
Total of the Sales Book is posted to
Acredit of the Sales Account.Bcredit of the Purchases Account.Ccredit of the Capital AccountDcredit of Customer's Accounts.The line chart given blow represents the sales (in 00) of trousers ans shirts for five months.
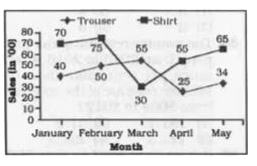
In March sale of trousers is what per cent of sale of shirts?A83.33B54.54C125D183.33The line chart given below shows the sales (in crores) of company A and B from July to December.
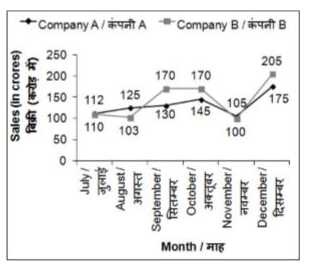
For how many months the sales of company B is more than the sales of company A?Aa)2Bb)3Cc)1Dd)4
The given bar graph shows the sale of different brands of shirts in a shop in one month.
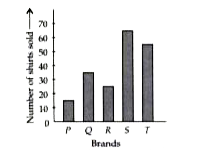
(i) How many total shirts are sold in the month ?
View SolutionThe given bar graph represents the sale of cars in five different states in a month.
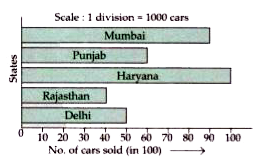
Which state sold maximum number of cars ?
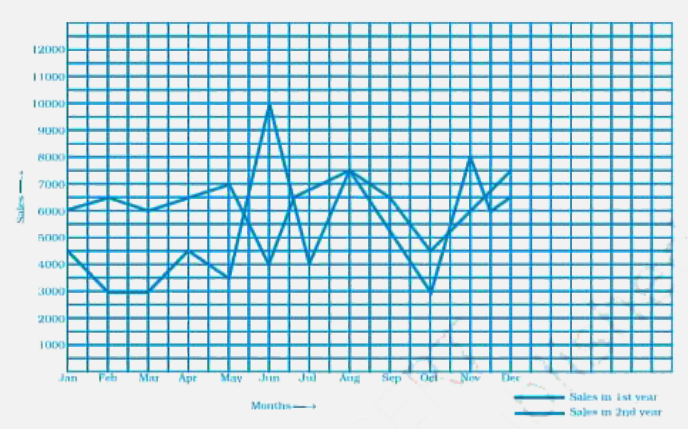
View SolutionFollowing graph shows a comparison of the approximate sale of items manufactured by a company for the first two years of its operation.
(a) In which months there was maximum difference in the sale of items of two years?
(b) In which year was there more stability in the sale of items ?
(c) In which month the sale remains the same in both the years ?
(d) In which month was the sales of first year less than that of second year?
View SolutionThe line chart given below represents the sales (in 00) of trousers and shirts for five months.
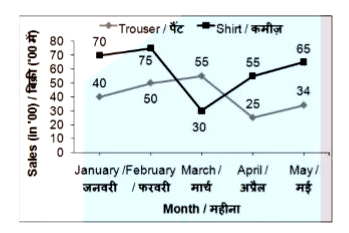
In January sale of is what trousers percent of sale of Shirts ?
View SolutionThe given bar chart shows the sales of books in four metro branches ofa company for the years 2014 and 2015
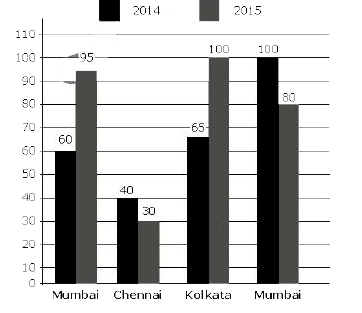
In the given bar chart the ratio the total sales between Mumbai and Delhi is
View Solution
