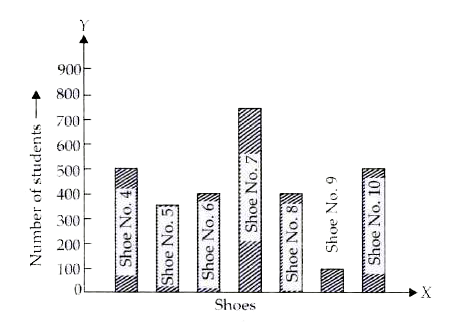
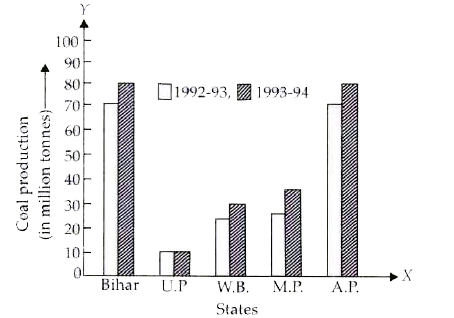
Read the following bar graph shown in Figure and answer the following questions: What is the information given by the bar graph? In which month was the sale of the book maximum? In which month was the sale of the book minimum? What is the total sale of the book during these five months?
Step by step video & image solution for Read the following bar graph shown in Figure and answer the following questions: What is the information given by the bar graph? In which month was the sale of the book maximum? In which month was the sale of the book minimum? What is the total sale of the book during these five months? by Maths experts to help you in doubts & scoring excellent marks in Class 6 exams.
Updated on:21/07/2023Topper's Solved these Questions
Similar Questions
Knowledge Check
In the given bar chart, which month sale shows the maximum increase in 2018 as against 2017
AAprilBMarchCJanuaryDMay
Read the graph and answer the following questions
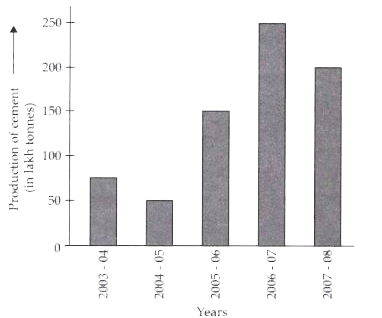
What information is conveyed by the bar graph
View SolutionRead the bar graph and answer the following questons.
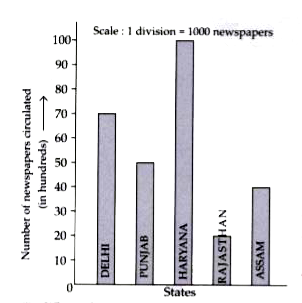
What information is given by graph ?
View SolutionRead the following bar graph and answer the following question: What information is given by the bar graph? In which year the export is minimum? In which year the import is maximum? In which year the difference of the values of export and import is maximum?
View SolutionRead the following bar graph (Figure) and answer the following questions: What information is given by the bar graph? What was the production of cement in the year 1980-81? What is the minimum and maximum productions of cement and corresponding years?
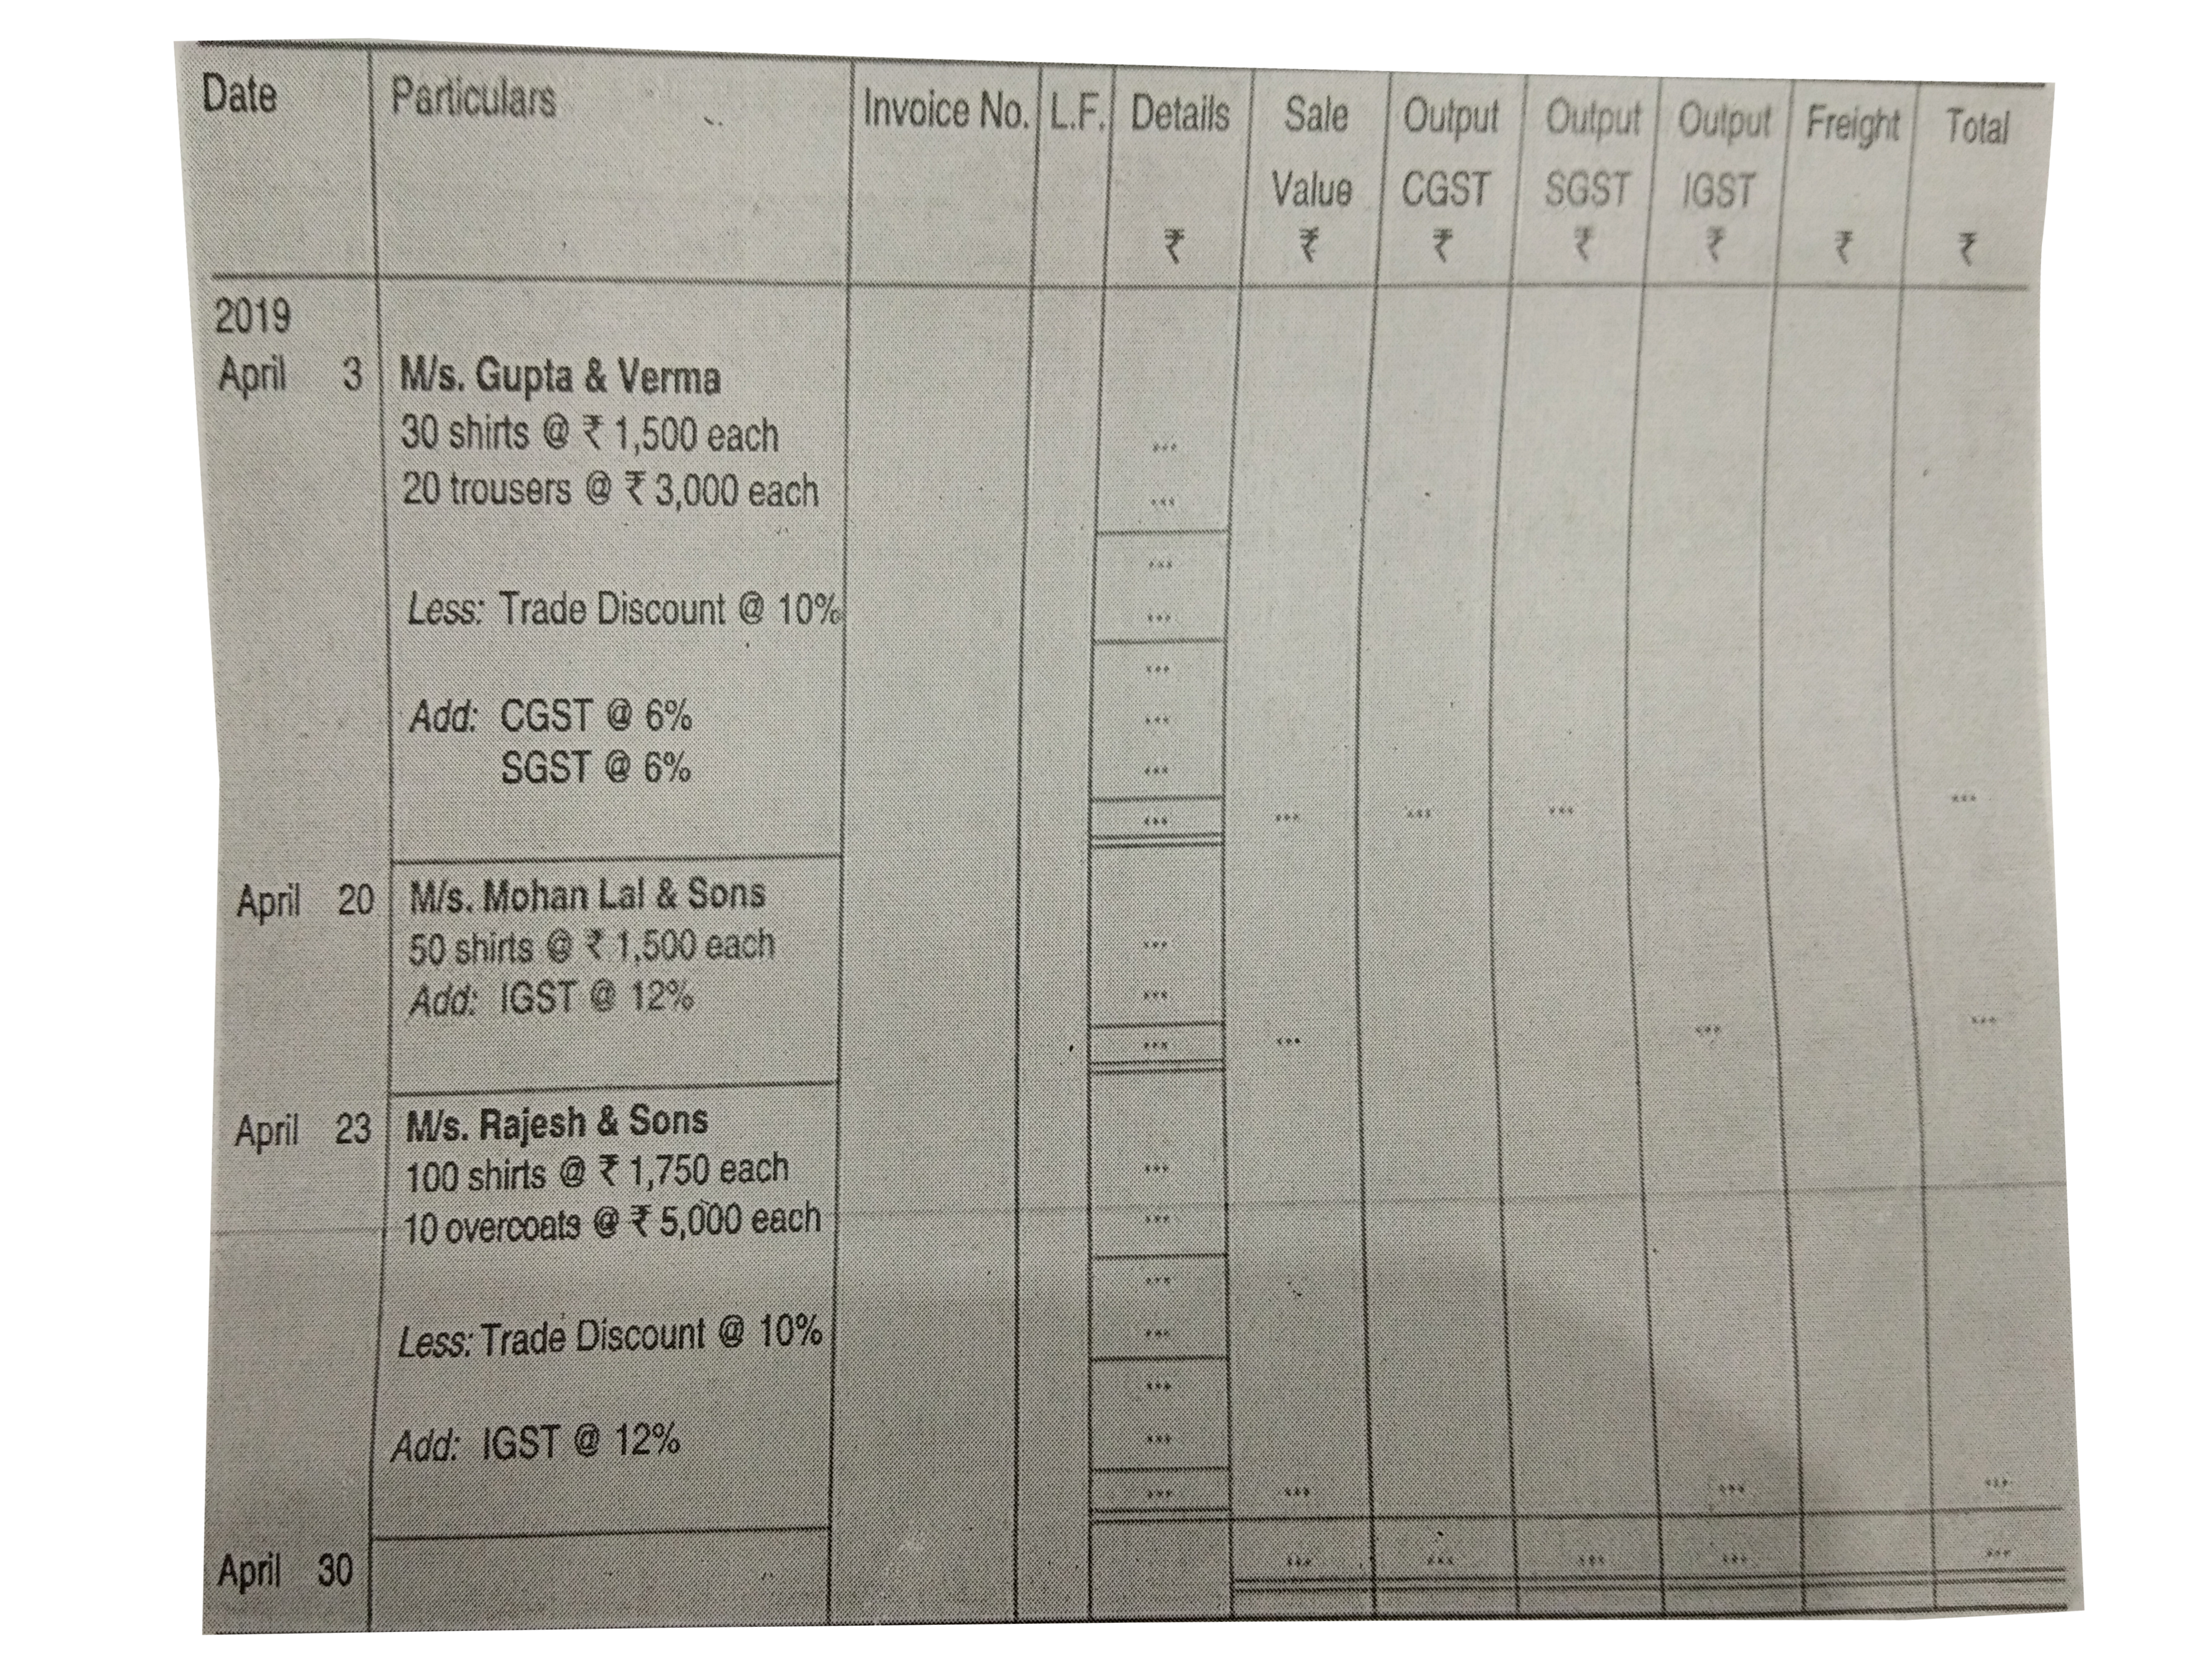
View SolutionIn the following Sales Book, determine the missing information:
View SolutionThe given graph shows the sale of story books in a bookshop for the first 6 months.
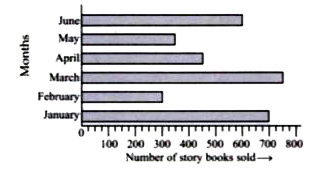
In which month, the sale of story books was 54 of the sale of books in June ?
View SolutionStudy the double bar graph shown below and answer the questions that follow:
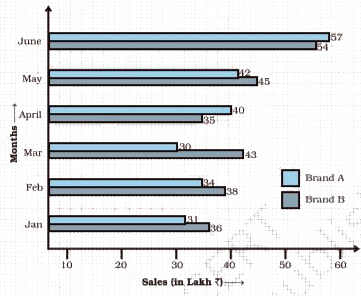
(a) What information is represented by the above double bar graph?
(b) In which month sales of Brand A decreased as compared to the previous month?
(c) What is the difference in sales of both the Brands for the month of June?
(d) Find the average sales of Brand B for the six months.
(e) List all months for which the sales of Brand B was less than that of Brand A.
(f) Find the ratio of sales of Brand A as compared to Brand B for the month of January.
View Solution

