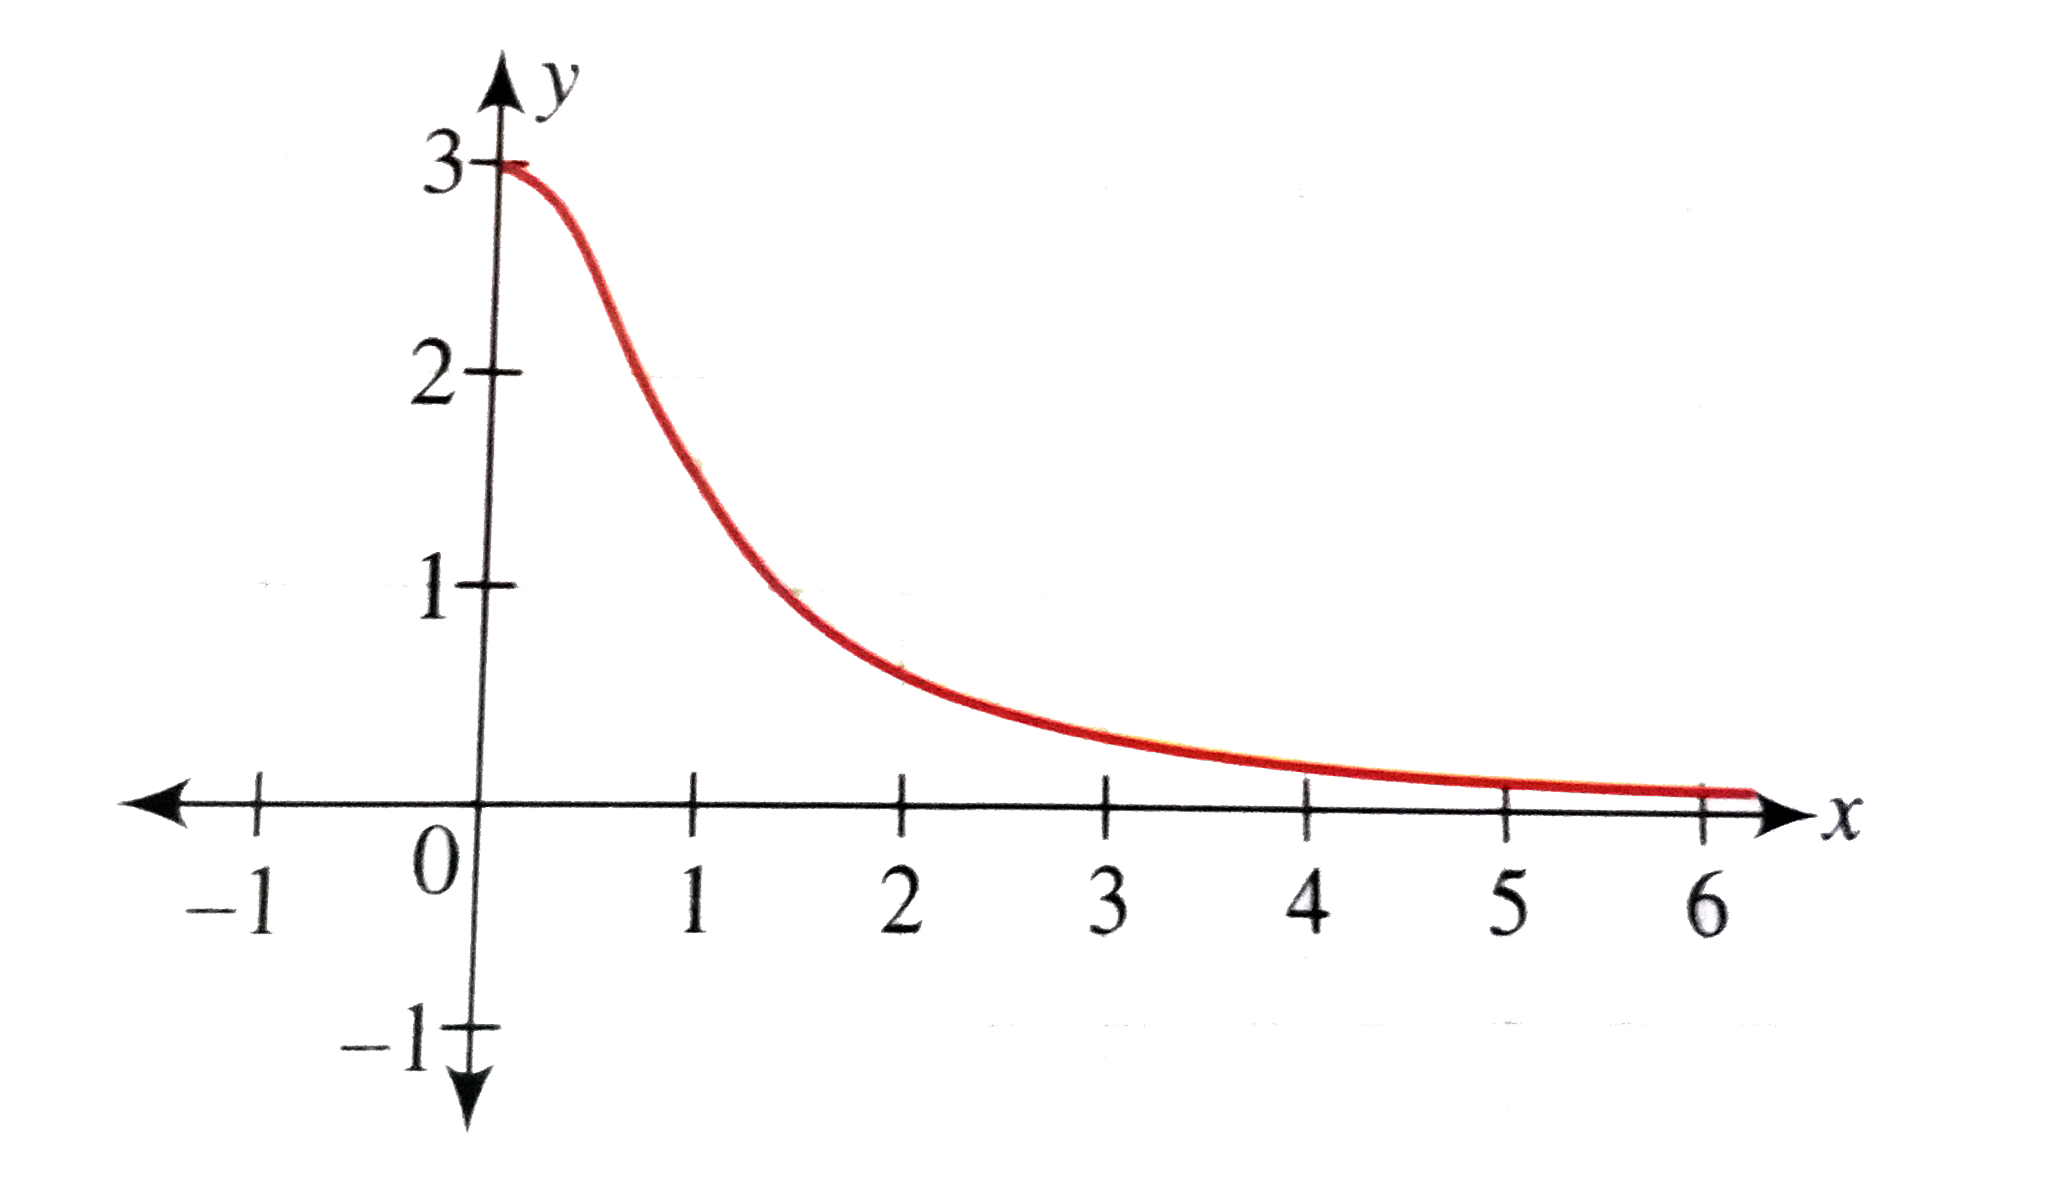
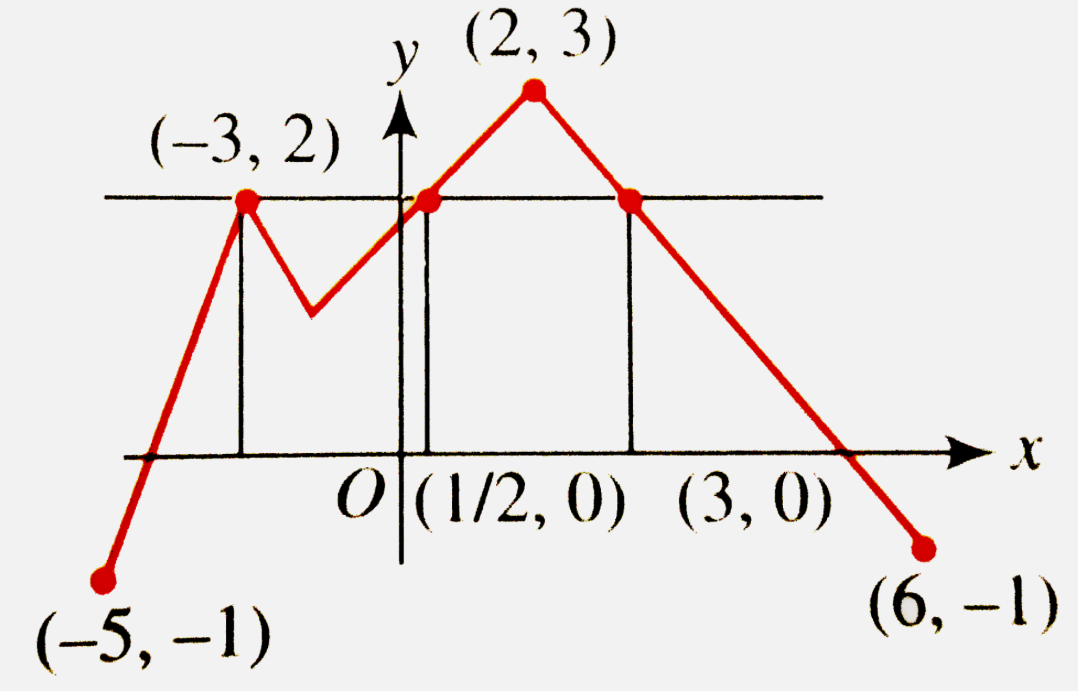
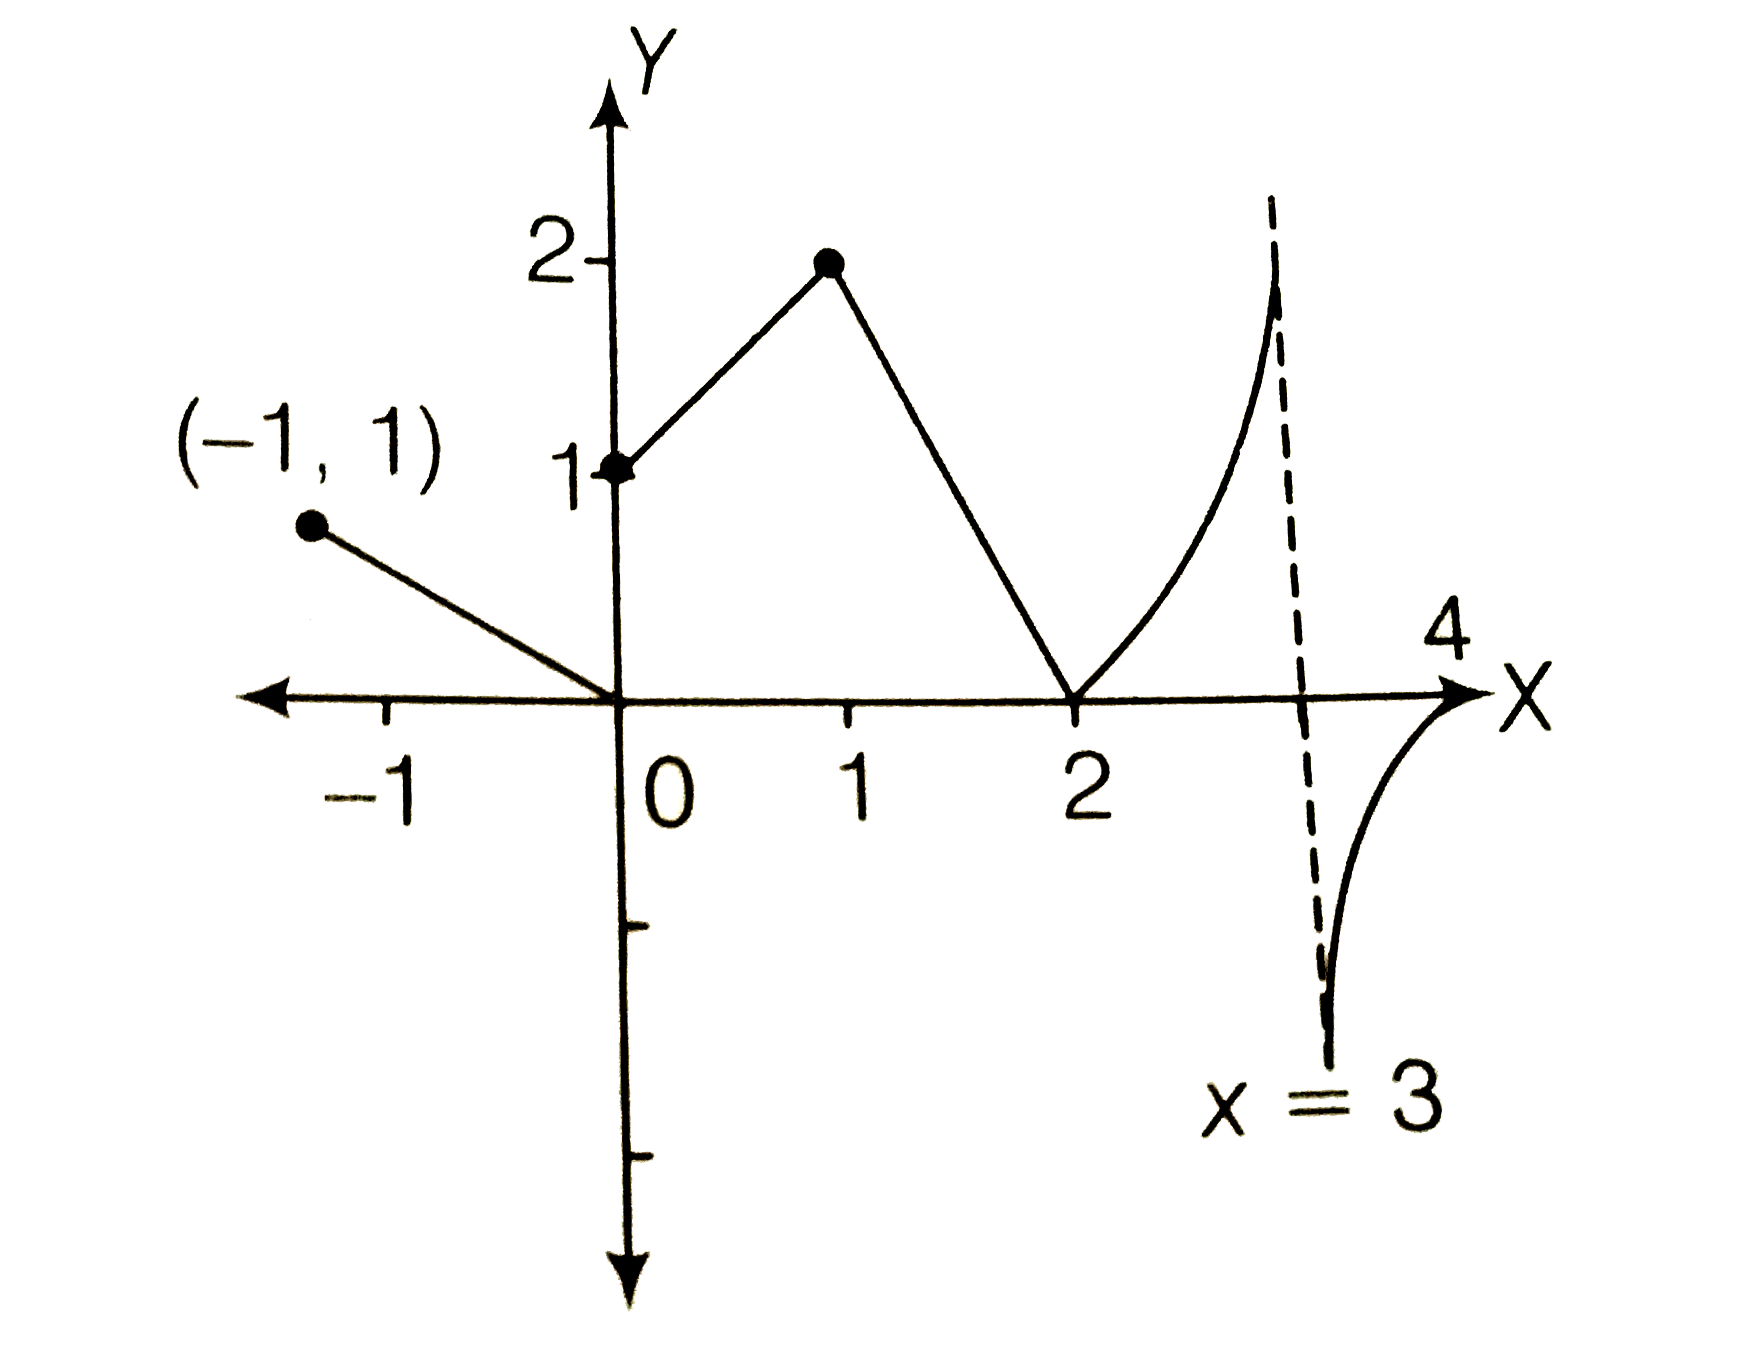
The graph of y=f(x) is as shown in the following figure.
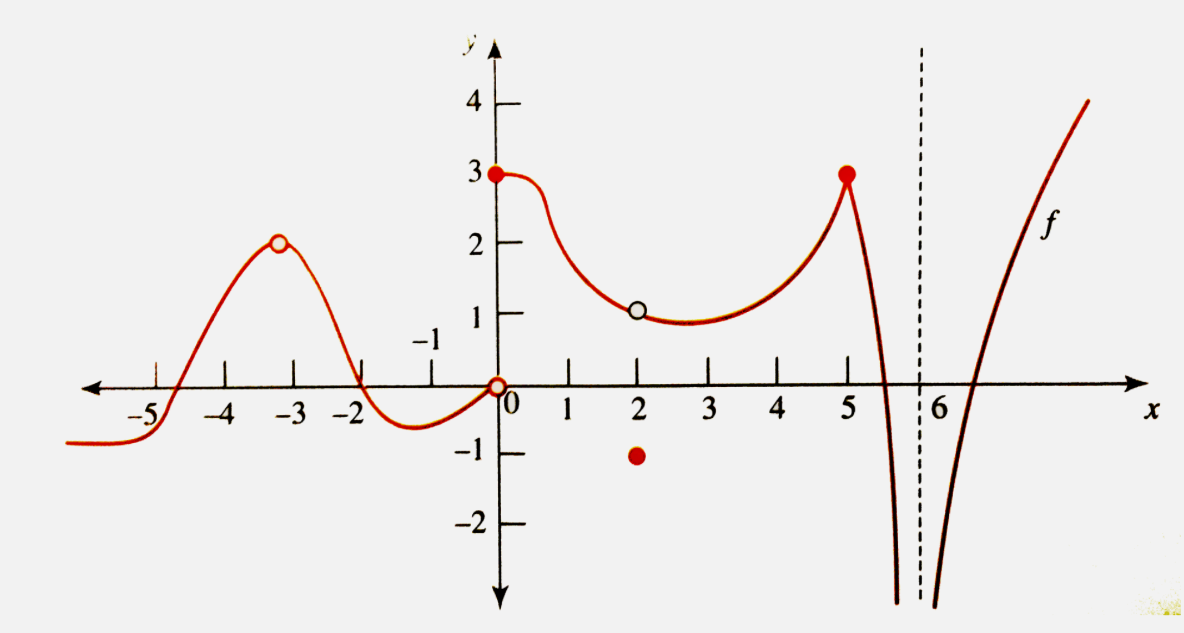
Identify the points of discontinuity and give the reason for the same.
Video Solution
Text Solution
y = f(x) is discontinuous at x =- 3 as the value of the function is missing at this point. Assigning proper value to f(-3) [from the graph f(-3) = 2], f(x) can be made continuous at this point.
y = f(x) is discontinuous at x = 0 as there is a jump in the value of the function at this point. Here limx→0−f(x)andlimx→0+f(x)=3. At this point, the function cannot be made continuous.
At x = 2, the function is discontinuous as the value of the value of the function is not same as the limiting value of function.
That is, limx→2f(x)=1 (limit of the function exists), but f(2) =- 1.
At x = 6, the function is discontinuous as the value of the function is decreasing indefinitely when x is approached from either its left or its right.
|
Topper's Solved these Questions
- GETTING STARTED WITH GRAPHSBOOK - CENGAGE ENGLISHCHAPTER - GETTING STARTED WITH GRAPHSEXERCISE - ILLUSTRATION 1.17
1 Videos
- GETTING STARTED WITH GRAPHSBOOK - CENGAGE ENGLISHCHAPTER - GETTING STARTED WITH GRAPHSEXERCISE - ILLUSTRATION 1.18
1 Videos
- GETTING STARTED WITH GRAPHSBOOK - CENGAGE ENGLISHCHAPTER - GETTING STARTED WITH GRAPHSEXERCISE - ILLUSTRATION 1.15
1 Videos
- FUNCTIONSBOOK - CENGAGE ENGLISHCHAPTER - FUNCTIONSEXERCISE - Comprehension Type
7 Videos
- GRAPH OF INVERSE TRIGONOMETRIC FUNCTIONSBOOK - CENGAGE ENGLISHCHAPTER - GRAPH OF INVERSE TRIGONOMETRIC FUNCTIONSEXERCISE - Exercises
18 Videos
Similar Questions
Knowledge Check
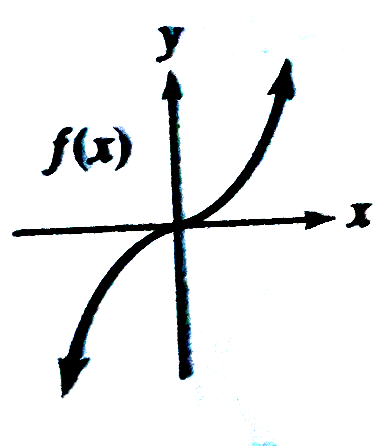
The graph of f(x) is shown above , Which of the following represents the graph of f(x-3) ?A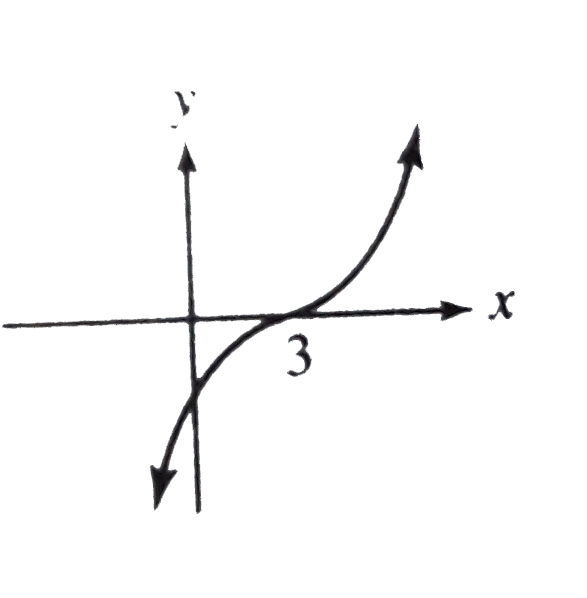 B
B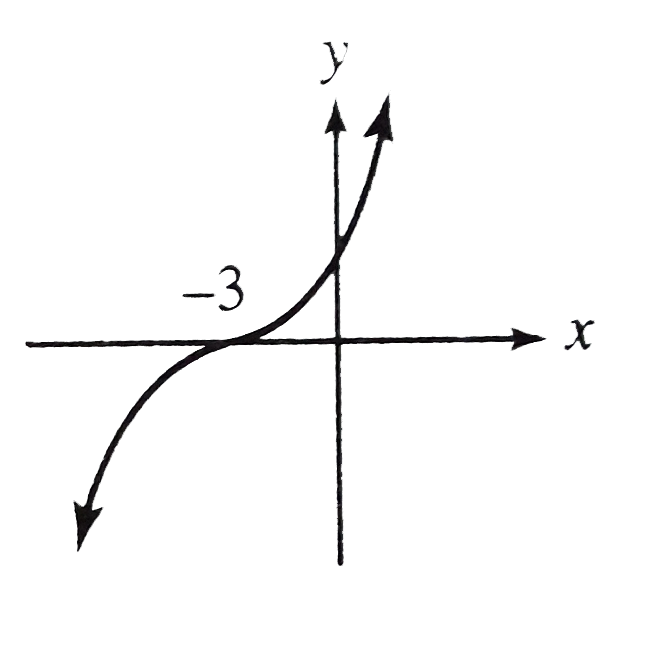 C
C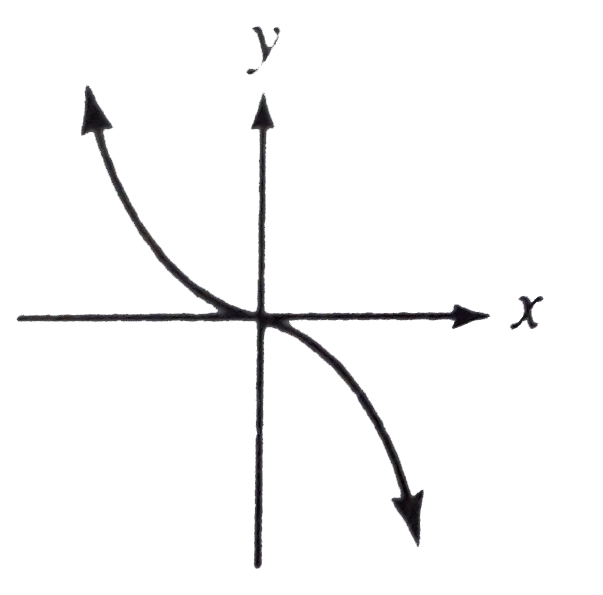 D
D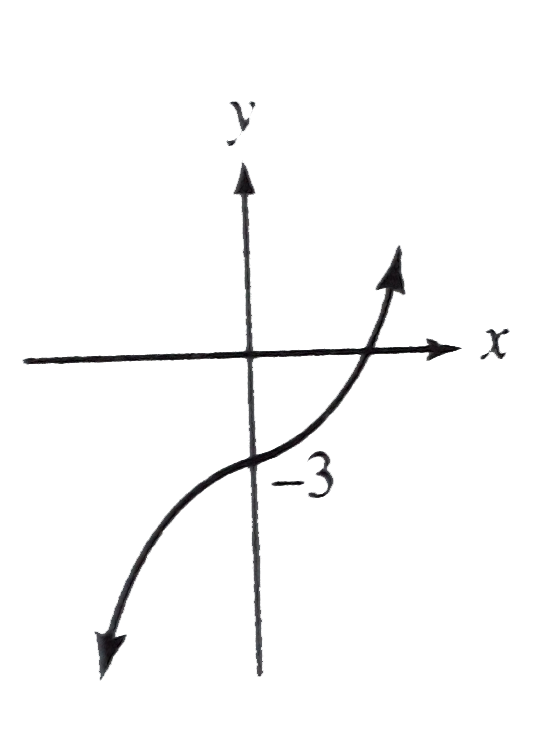
The graph of y=f(x) is shown below.
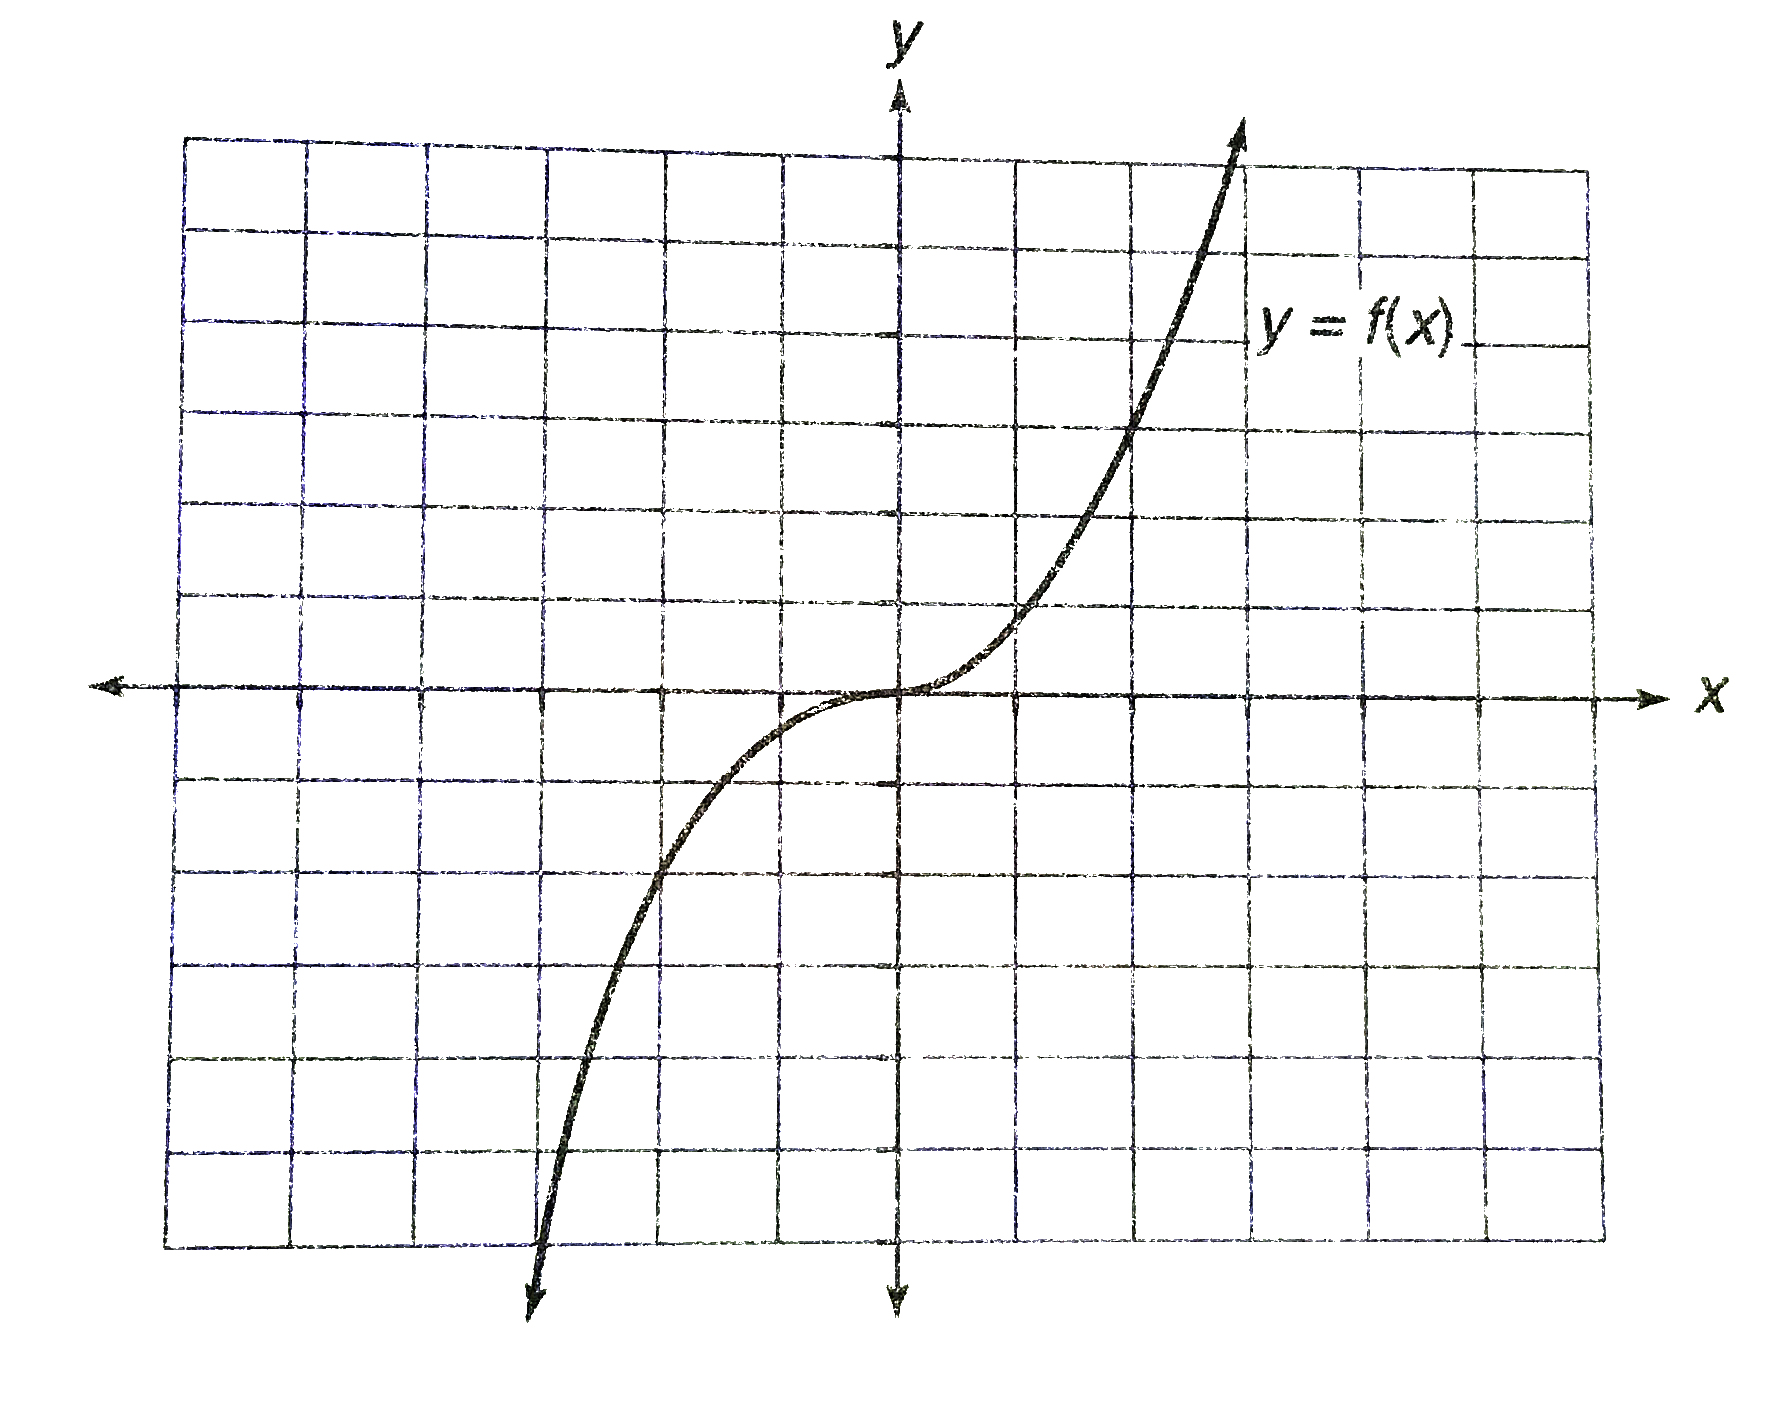
Which of the following could represents the graph of y=f(x−2)+1?A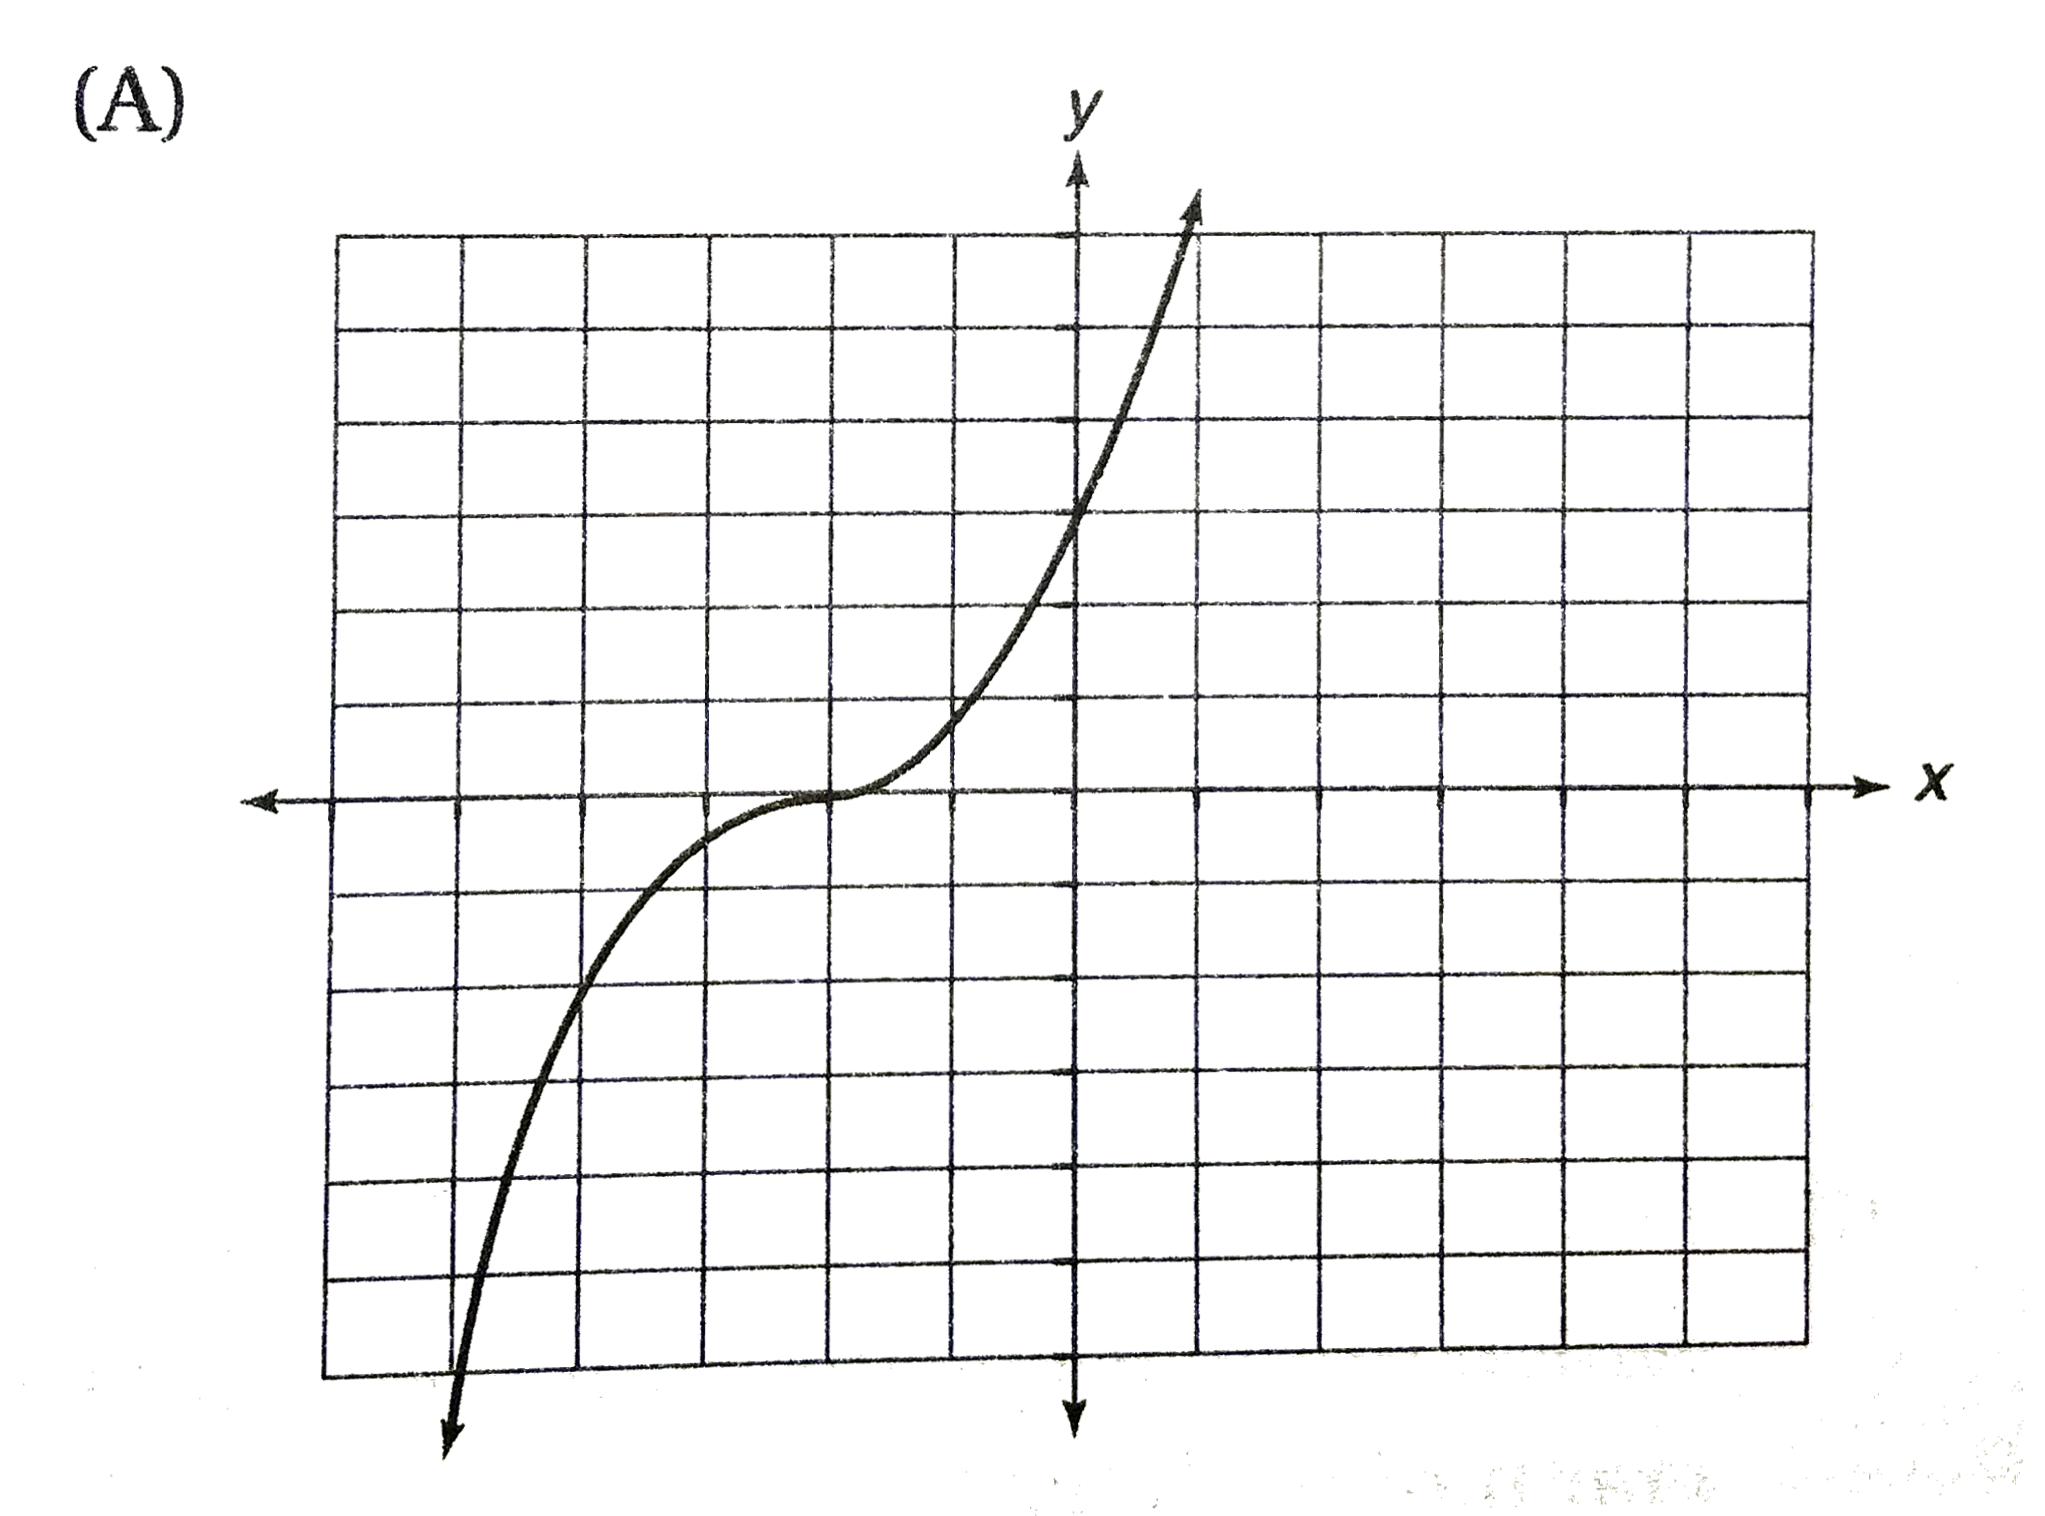 B
B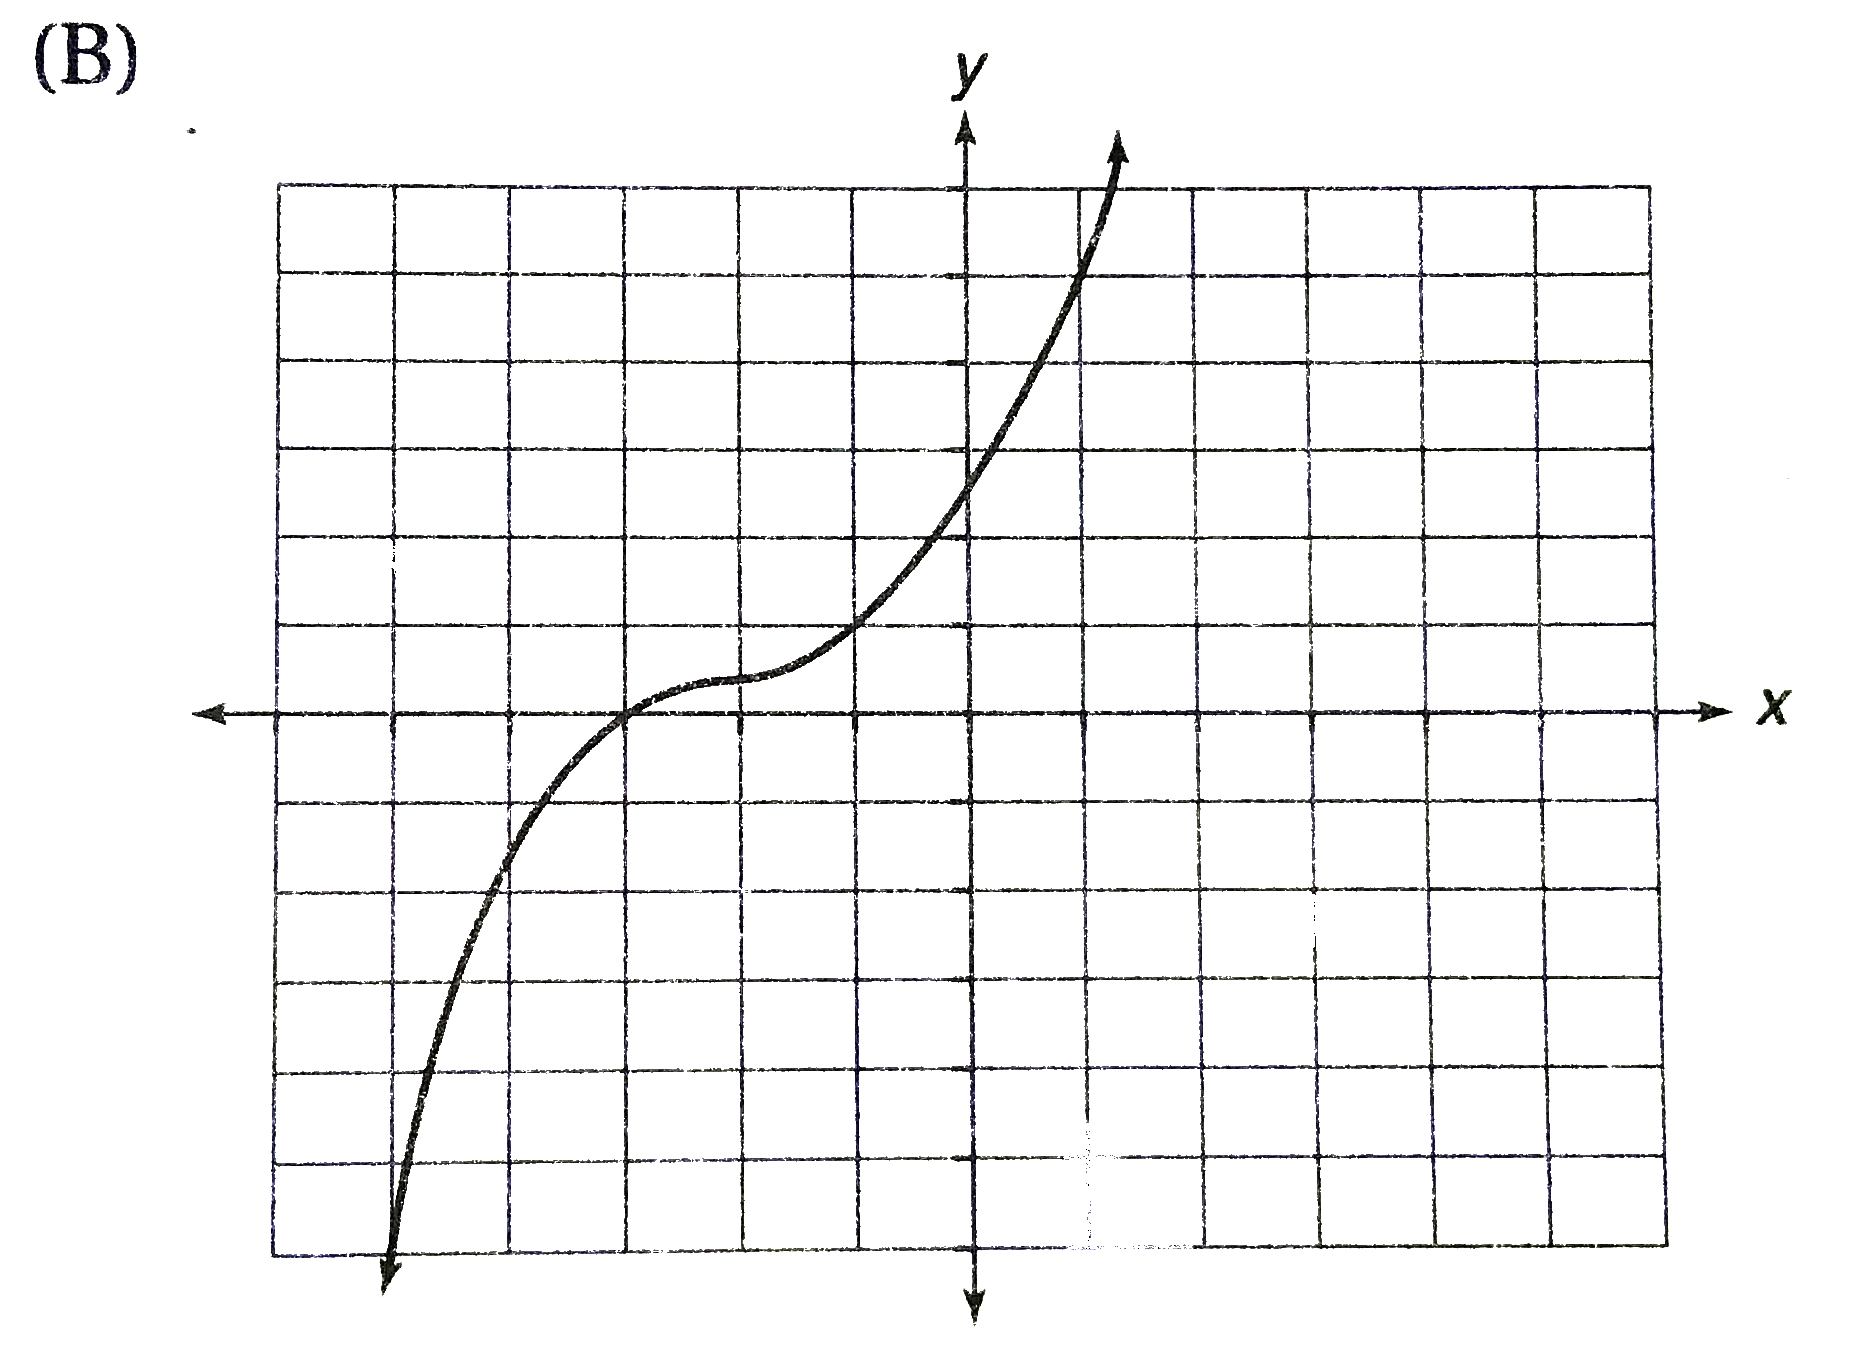 C
C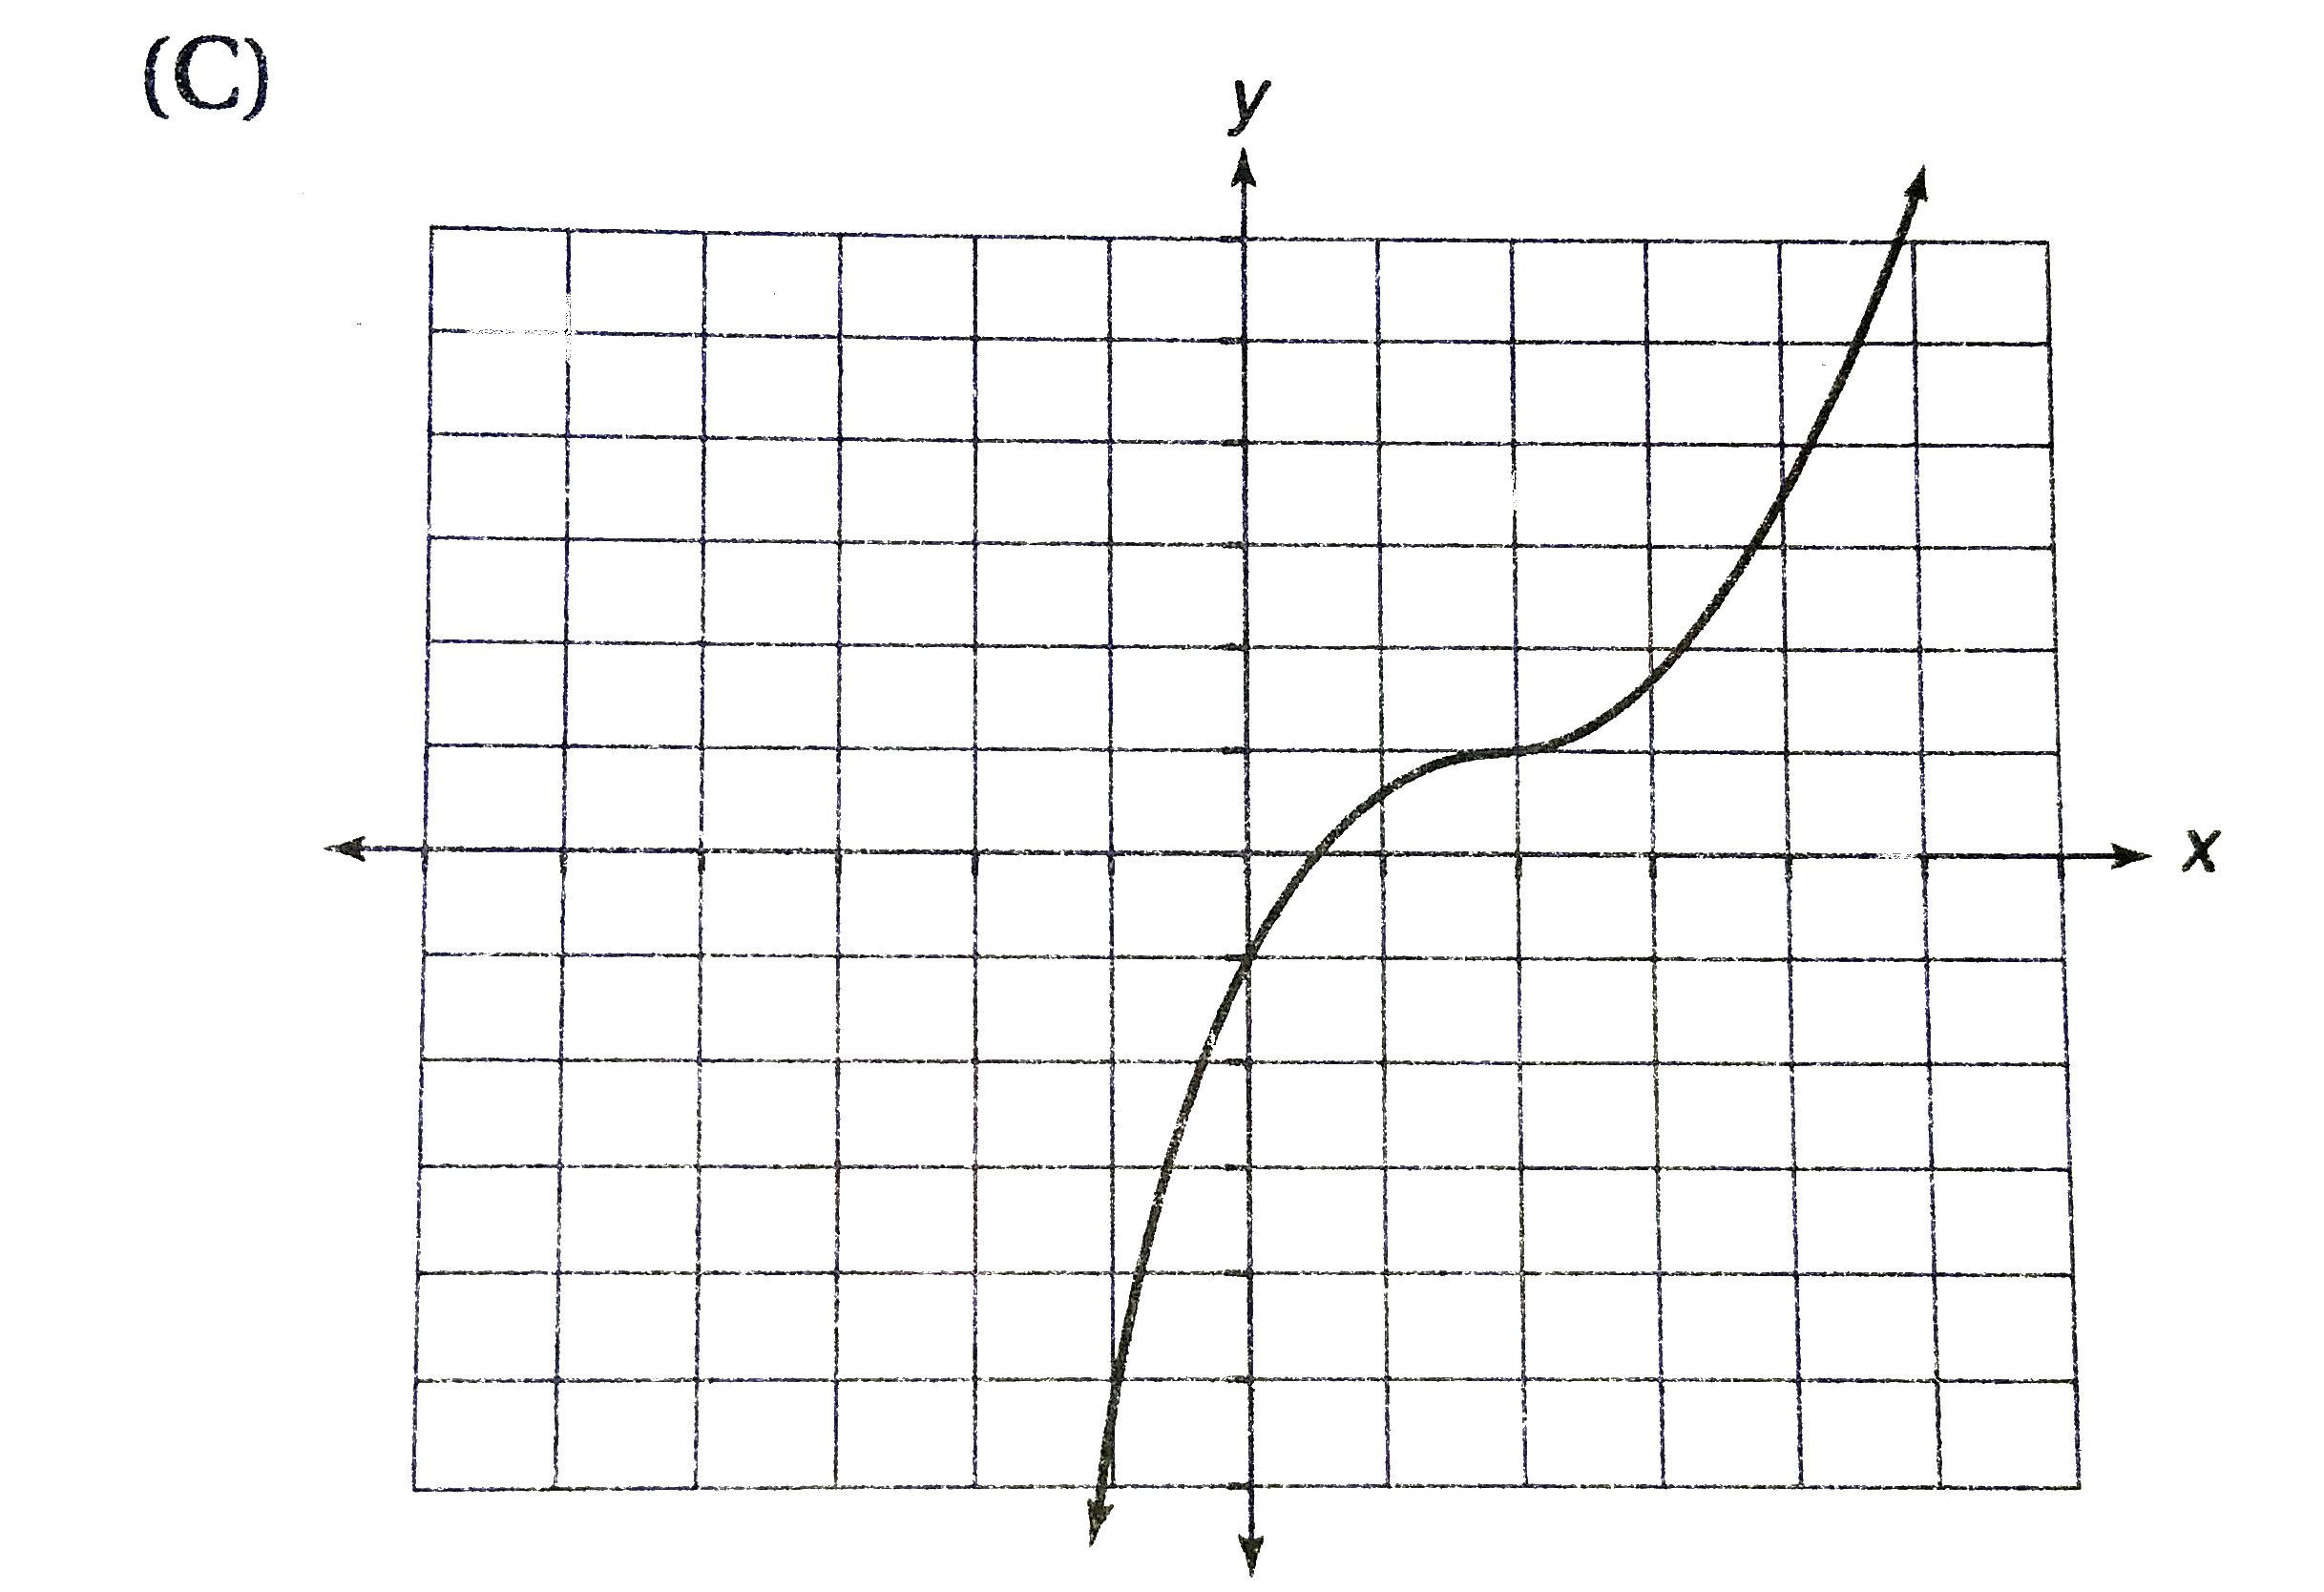 D
D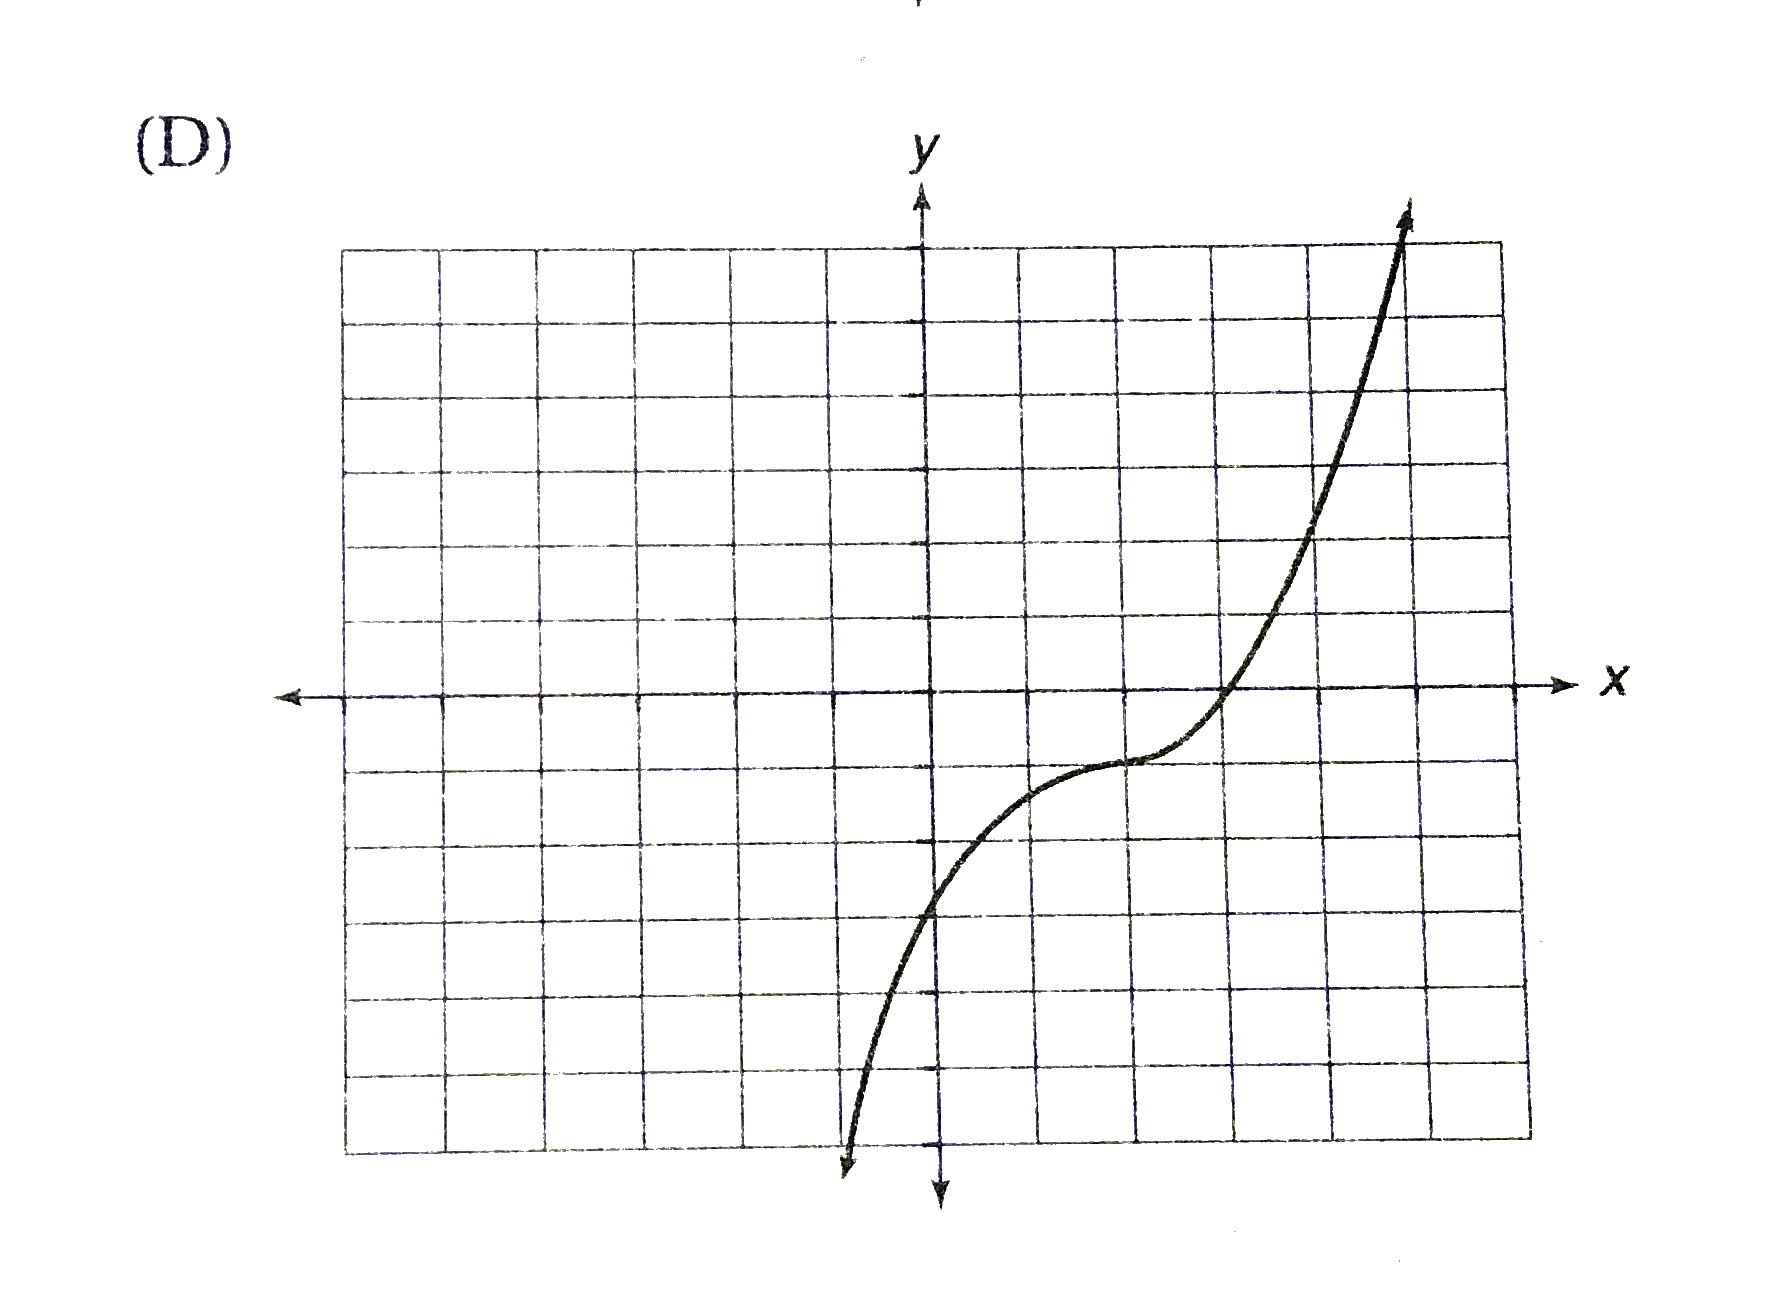
The graph of y = f(x) is shown, find the number of solution of f(f(x)) = 2.
View SolutionThe graph of y =g(x) =f(X) is as shown in the following figure analyse this graph and answer the following question
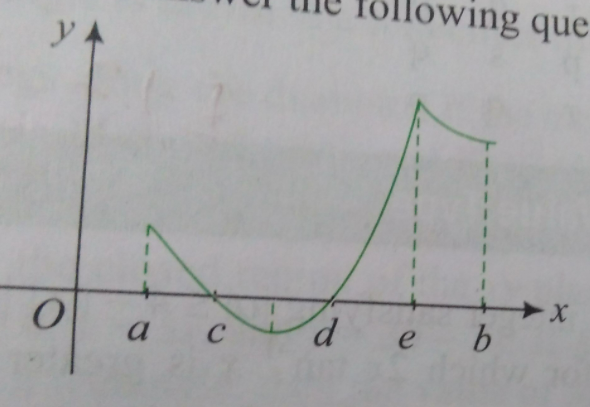
Number of points of inflectionn the graph of y = f(x) for a<x<b has
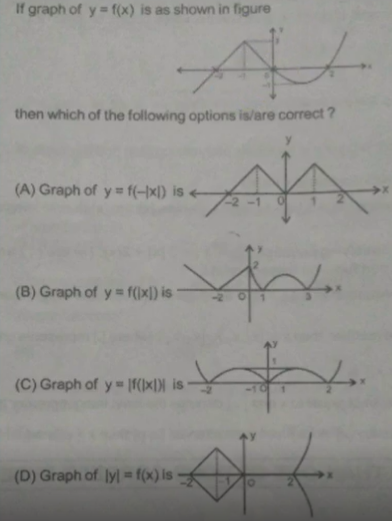
View SolutionIf graph of y= f(x) is as shown in figure, then which of the following options is/are correct?
View SolutionIf the graph of y=|f(x)| is as shown in figure
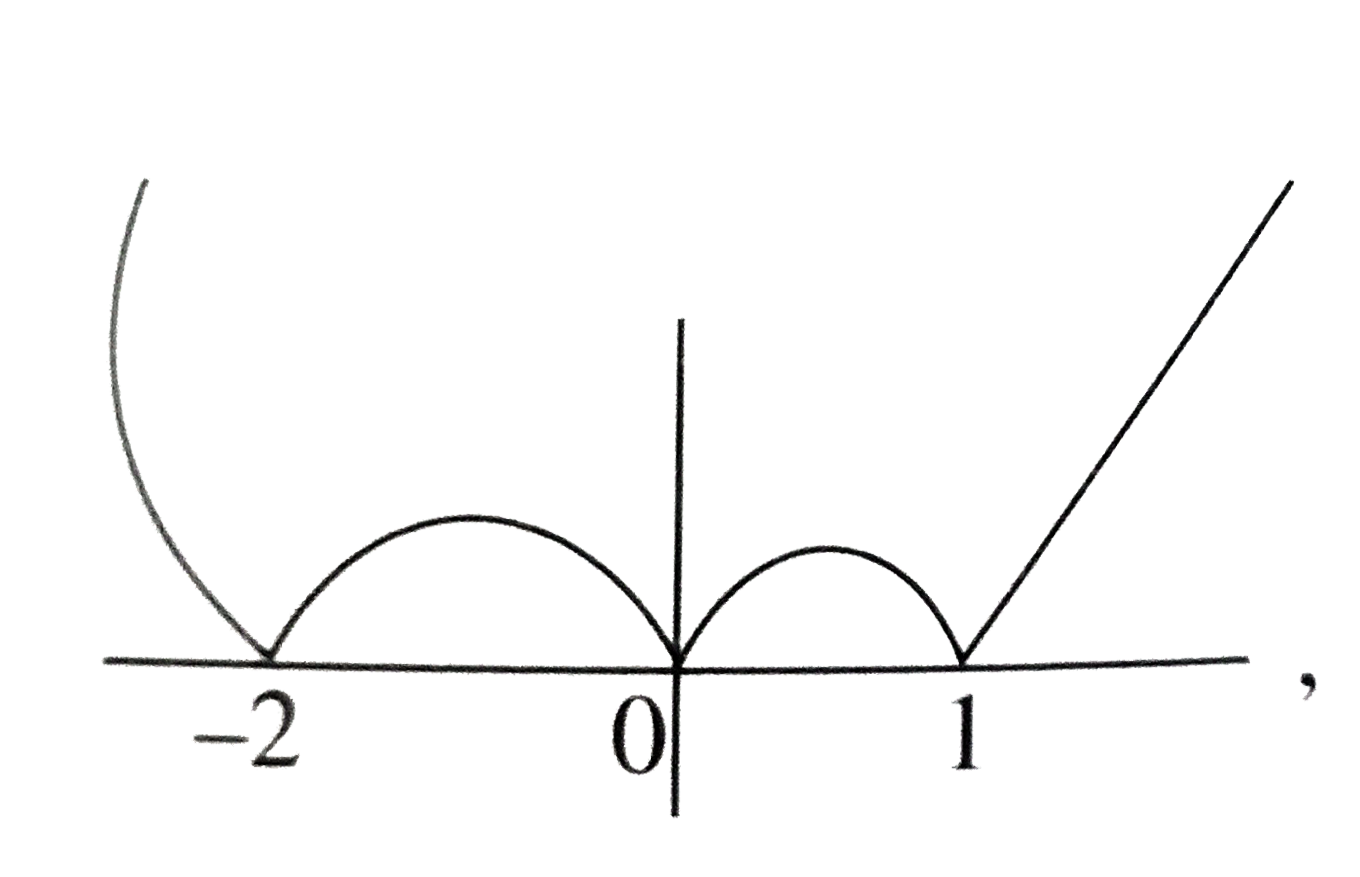 then the graph of y=f(x) may be
View SolutionThe graph of the function y=f(x) is shown in the adjacent figure then correct statement is
View SolutionGraph of y=f(x) is as shown in the following figure.
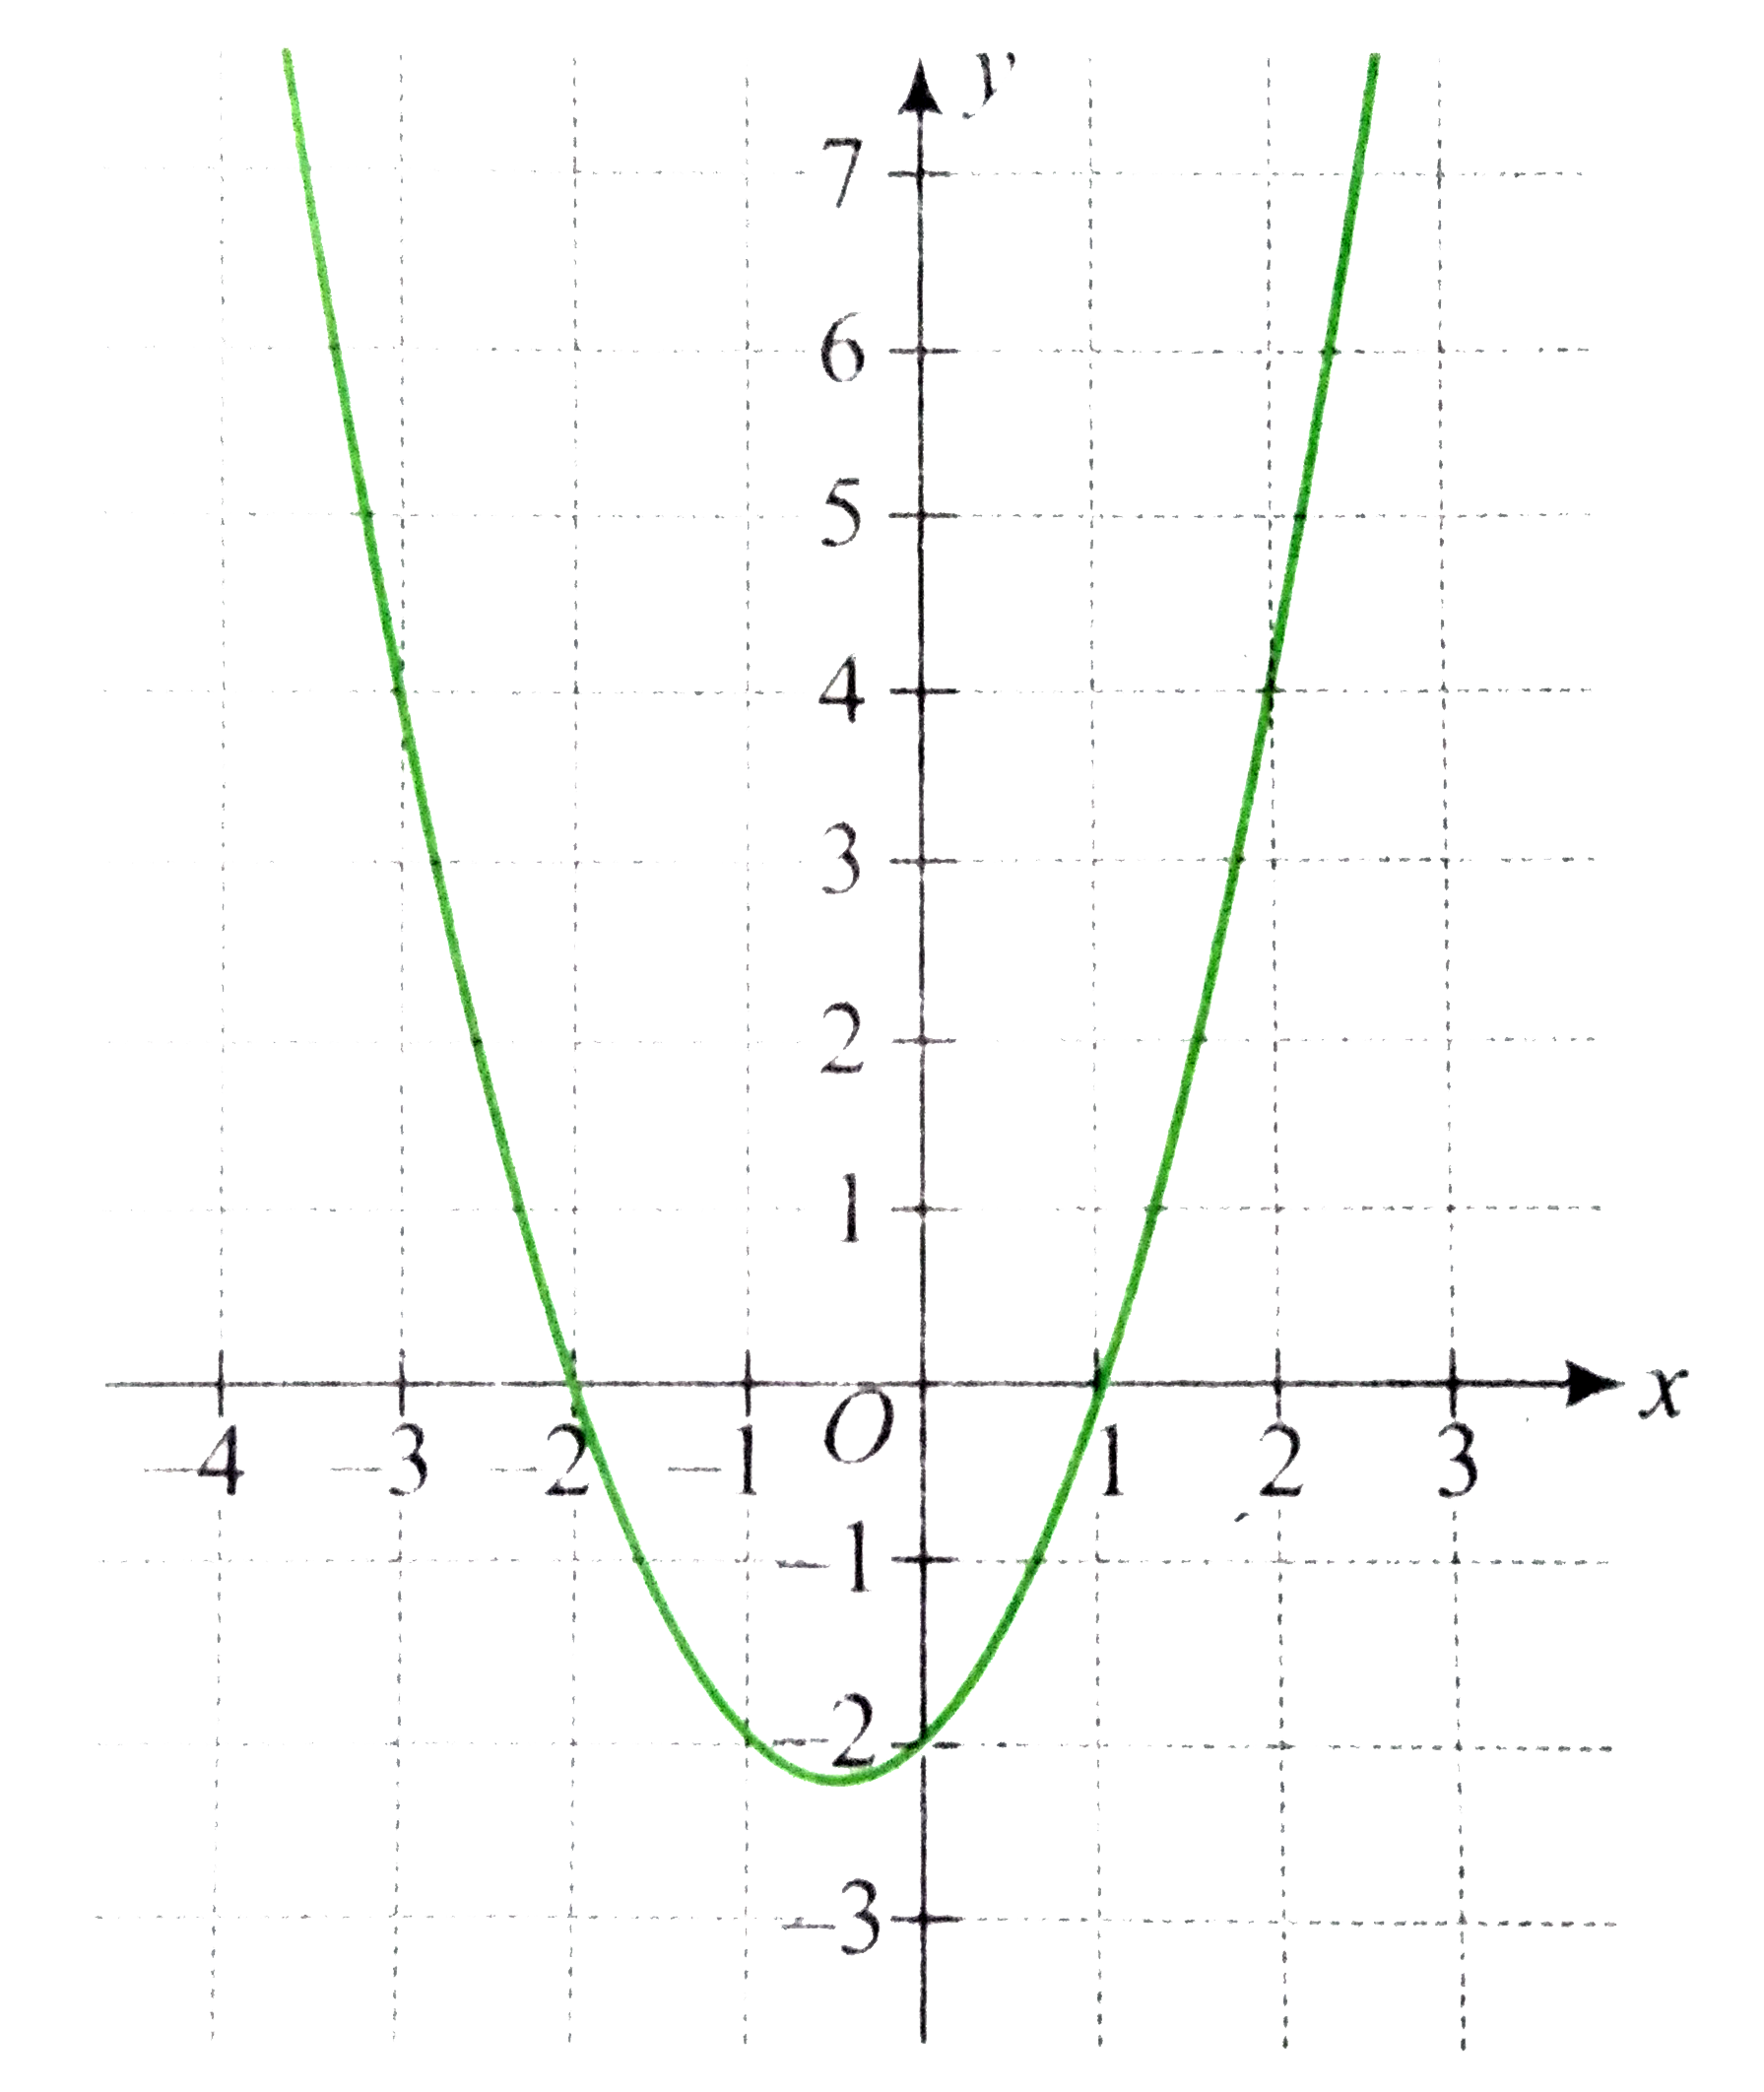
Find the roots of the following equations
f(x)=0
f(x)=4
f(x)=x+2
View Solution

