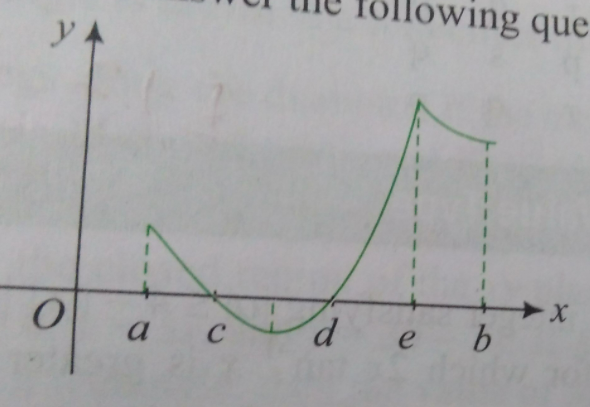
The graph of y =g(x) =f(X) is as shown in the following figure analyse this graph and answer the following question

Which of the following is not true about the graph of y = f(x) ,a<x<b
always increasing
discontinous at one point
first increases then decreases
none of these
The correct Answer is:3

The graph of y =f (x) is always concave upwards so f(X) gt0 at every point where it exist so graph of y=f(x) always increasing whenever defined cleary y=f(x) is discontinous at x=e
Topper's Solved these Questions
- MONOTONICITY AND MAXIMA MINIMA OF FUNCTIONSBOOK - CENGAGECHAPTER - MONOTONICITY AND MAXIMA MINIMA OF FUNCTIONSEXERCISE - Matrix Match Type
12 Videos
- MONOTONICITY AND MAXIMA MINIMA OF FUNCTIONSBOOK - CENGAGECHAPTER - MONOTONICITY AND MAXIMA MINIMA OF FUNCTIONSEXERCISE - Exercise (Numerical)
20 Videos
- MONOTONICITY AND MAXIMA MINIMA OF FUNCTIONSBOOK - CENGAGECHAPTER - MONOTONICITY AND MAXIMA MINIMA OF FUNCTIONSEXERCISE - Exercise (Comprehension)
42 Videos
- METHODS OF DIFFERETIATIONBOOK - CENGAGECHAPTER - METHODS OF DIFFERETIATIONEXERCISE - Question Bank
13 Videos
- MONOTONOCITY AND NAXINA-MINIMA OF FUNCTIONSBOOK - CENGAGECHAPTER - MONOTONOCITY AND NAXINA-MINIMA OF FUNCTIONSEXERCISE - Comprehension Type
6 Videos
Similar Questions
The graph of y =g(x) =f(X) is as shown in the following figure analyse this graph and answer the following question

Number of points of inflectionn the graph of y = f(x) for a<x<b has
View SolutionThe graph of y=f(x) is as shown in the following figure. Draw the graph of y=[f(x)].

View SolutionThe graph of y=f(x) is as shown in the following figure. Draw the graph of y=[f(x)].

View SolutionThe graph of y=f(x) is as shown ,Which of the following is/are CORRECT?
View SolutionGraph of y=f(x) is given as shown in the following figure. Draw the graph of y=sgn(f(x)).
View SolutionGraph of y=f(x) is as shown in the following figure.

Find the roots of the following equations
f(x)=0
f(x)=4
f(x)=x+2
View SolutionGraph of y=f(x) is as shown in the following figure.

Find the roots of the following equations
f(x)=0
f(x)=4
f(x)=x+2
View SolutionThe graph of y=|f(x)| is as shown in the following figure Fig Graph of y=f(x) may be a, b, c d is fig
View SolutionThe graph of y=|f(x)| is as shown in the following figure Fig Graph of y=f(x) may be a, b, c d is fig
View SolutionGiven the graph of y=f(x), which of the following is graph of y=f(1−x)
View Solution
