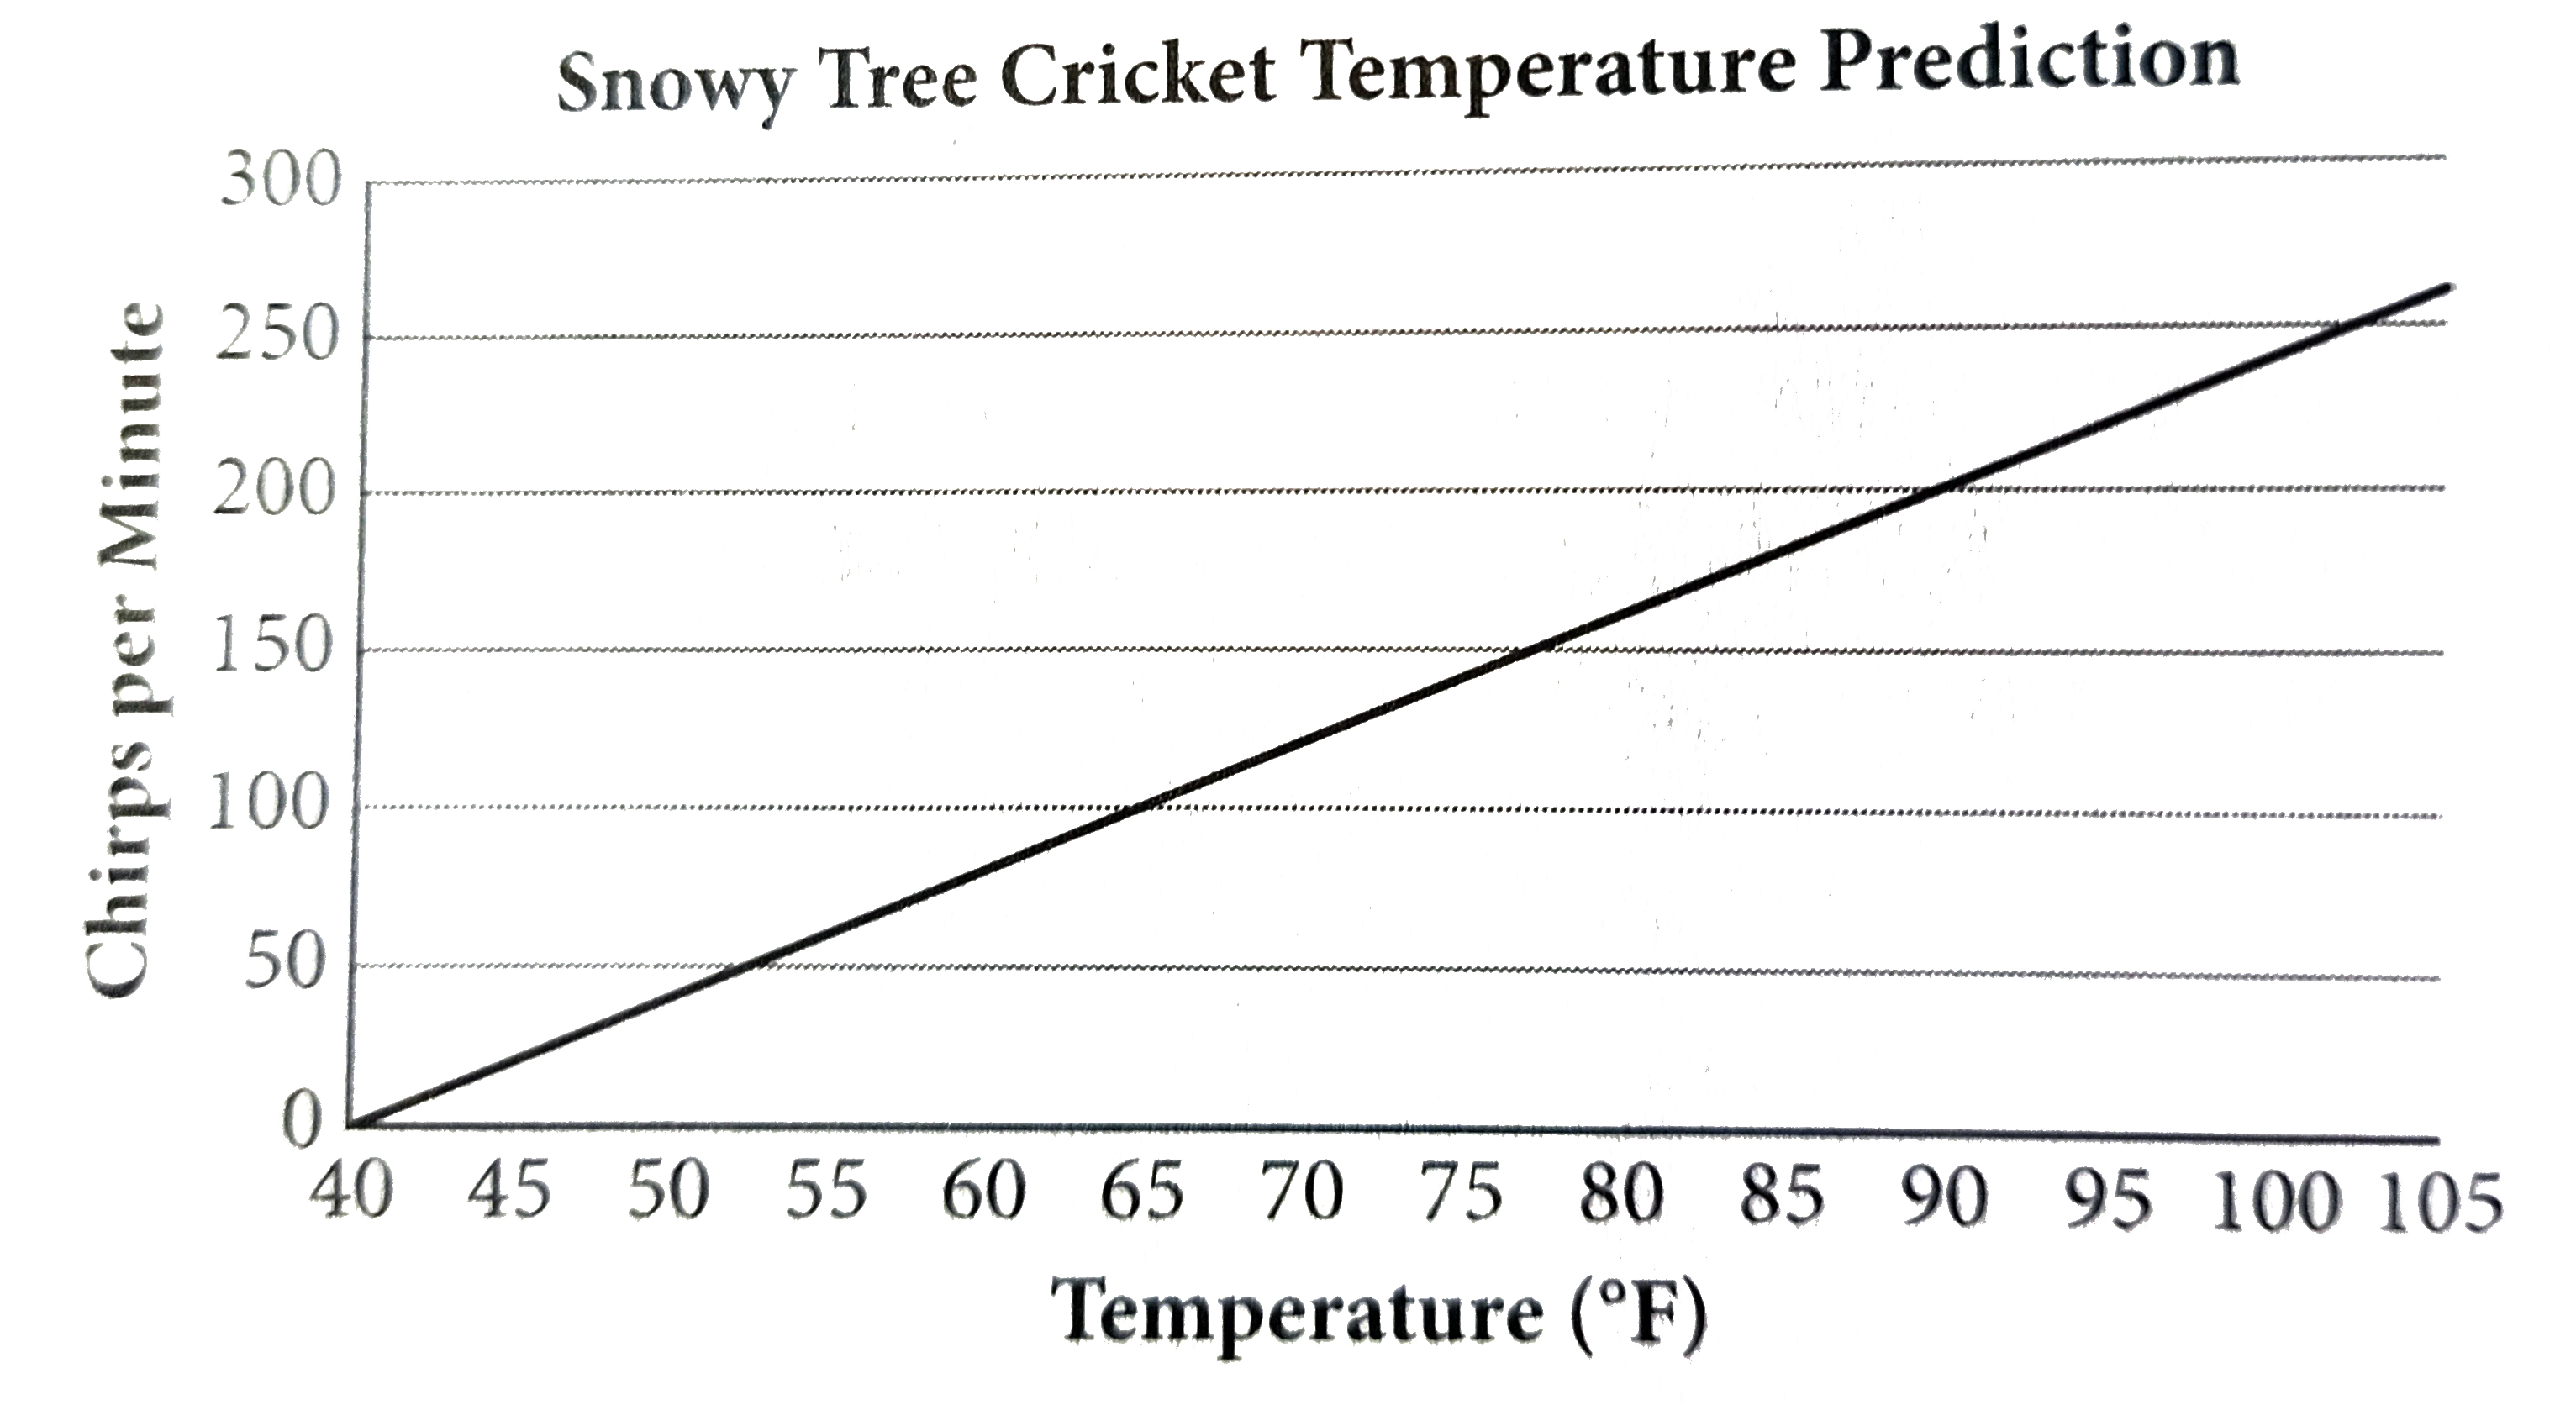
The graph shows the correlation between ambient air temperature, t, in degress Fahrenheit and the number of chirps, c, per minute that a snowy tree cricket makes at that temperature. Which of the following equations represents the line shown in the graph ?
c=4t−160
c=14t−160
c=12t−40
c=4t+160
The correct Answer is:A
Start by finding the slope of the line by picking a pair of points, such as (40,0)and(65,100):m=1−−−065−40=10015=4. Choices (B) and (C ) have slopes other than 4, so eliminate them. Choice (A) and (D) have y-intercepts of -160 and 40, respectively. Now real the axis labeels carefully : the horixzontal axis begins at 40 (not 0). The line is trending downward as x-values get smaller, so the y-intercept (when x=0) must be well below 0 on the verttical axis. Therefore, the answer must be (A).
Topper's Solved these Questions
- LINEAR EQUATIONS AND GRAPHSBOOK - KAPLANCHAPTER - LINEAR EQUATIONS AND GRAPHSEXERCISE - SOLVING EQUATIONS
1 Videos
- LINEAR EQUATIONS AND GRAPHSBOOK - KAPLANCHAPTER - LINEAR EQUATIONS AND GRAPHSEXERCISE - WORD PROBLEMS
1 Videos
- LINEAR EQUATIONS AND GRAPHSBOOK - KAPLANCHAPTER - LINEAR EQUATIONS AND GRAPHSEXERCISE - LINEAR GRAPH
1 Videos
- INEQUALITIESBOOK - KAPLANCHAPTER - INEQUALITIESEXERCISE - MODELING REAL-LIFE SITUATIONS WITH INEQUALITIES
1 Videos
- PAIRED PASSAGES AND PRIMARY SOURCE PASSAGES BOOK - KAPLANCHAPTER - PAIRED PASSAGES AND PRIMARY SOURCE PASSAGES EXERCISE - HOW MUCH HAVE YOU LEARNED
11 Videos
Similar Questions
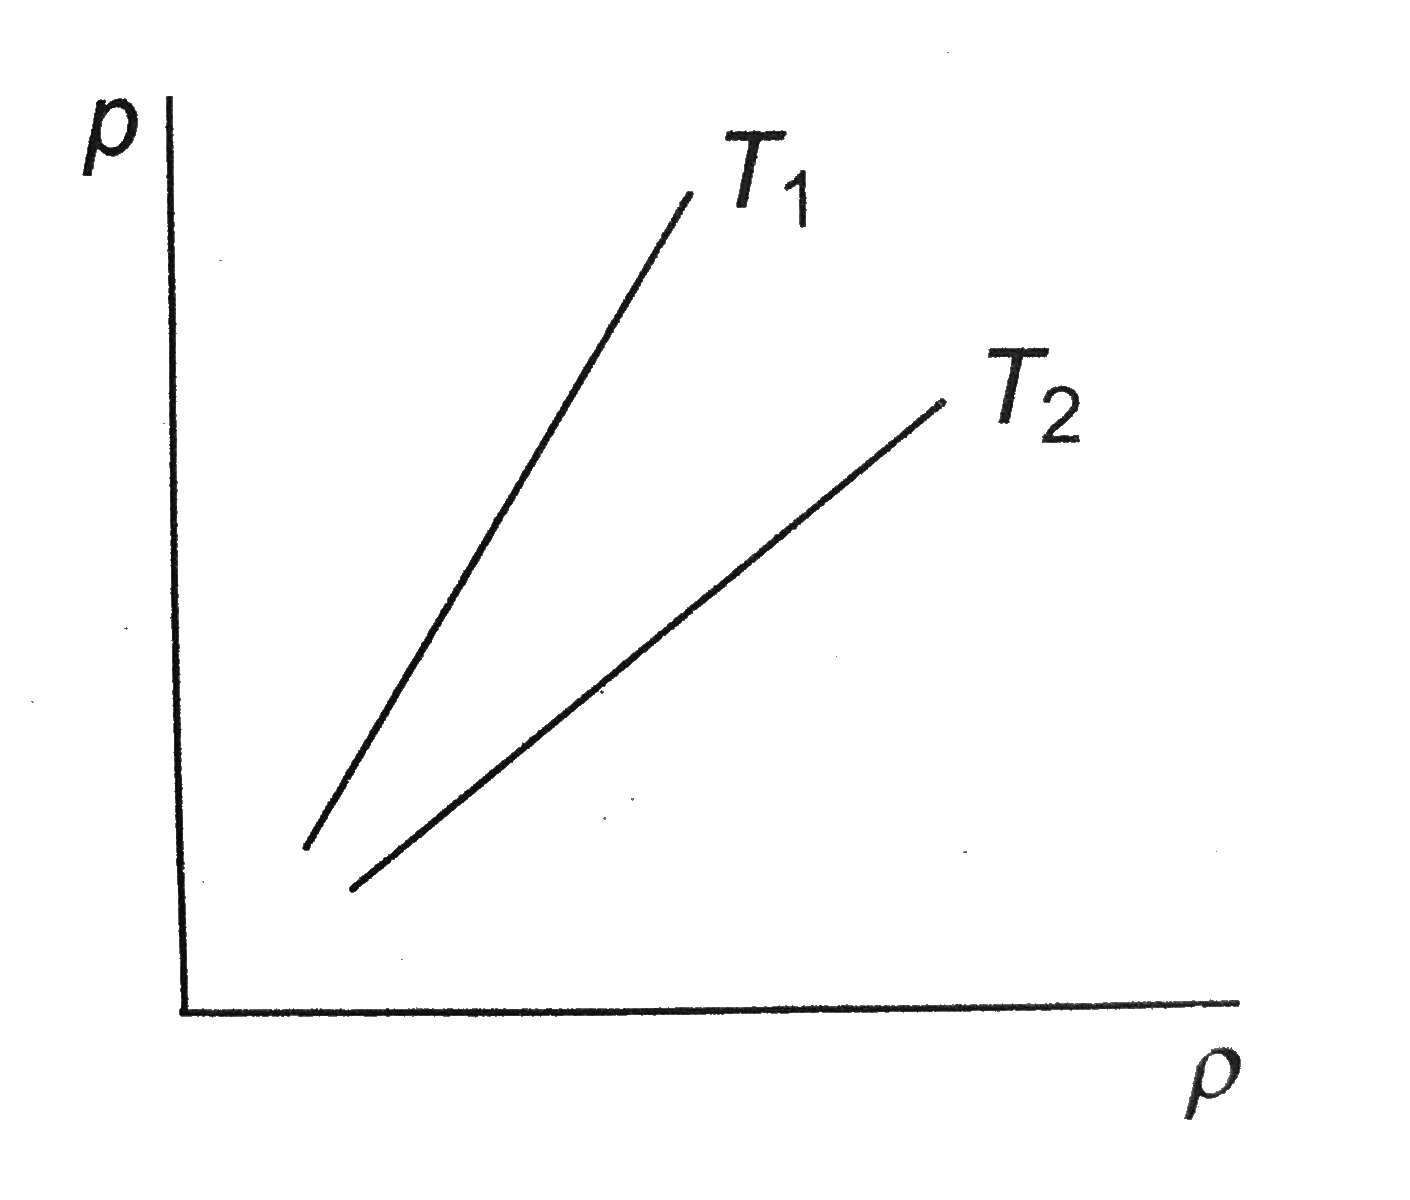
Figure shows graphs of pressure vs density for an ideal gas at two temperature T1andT2. Which of the following is correct?
View Solution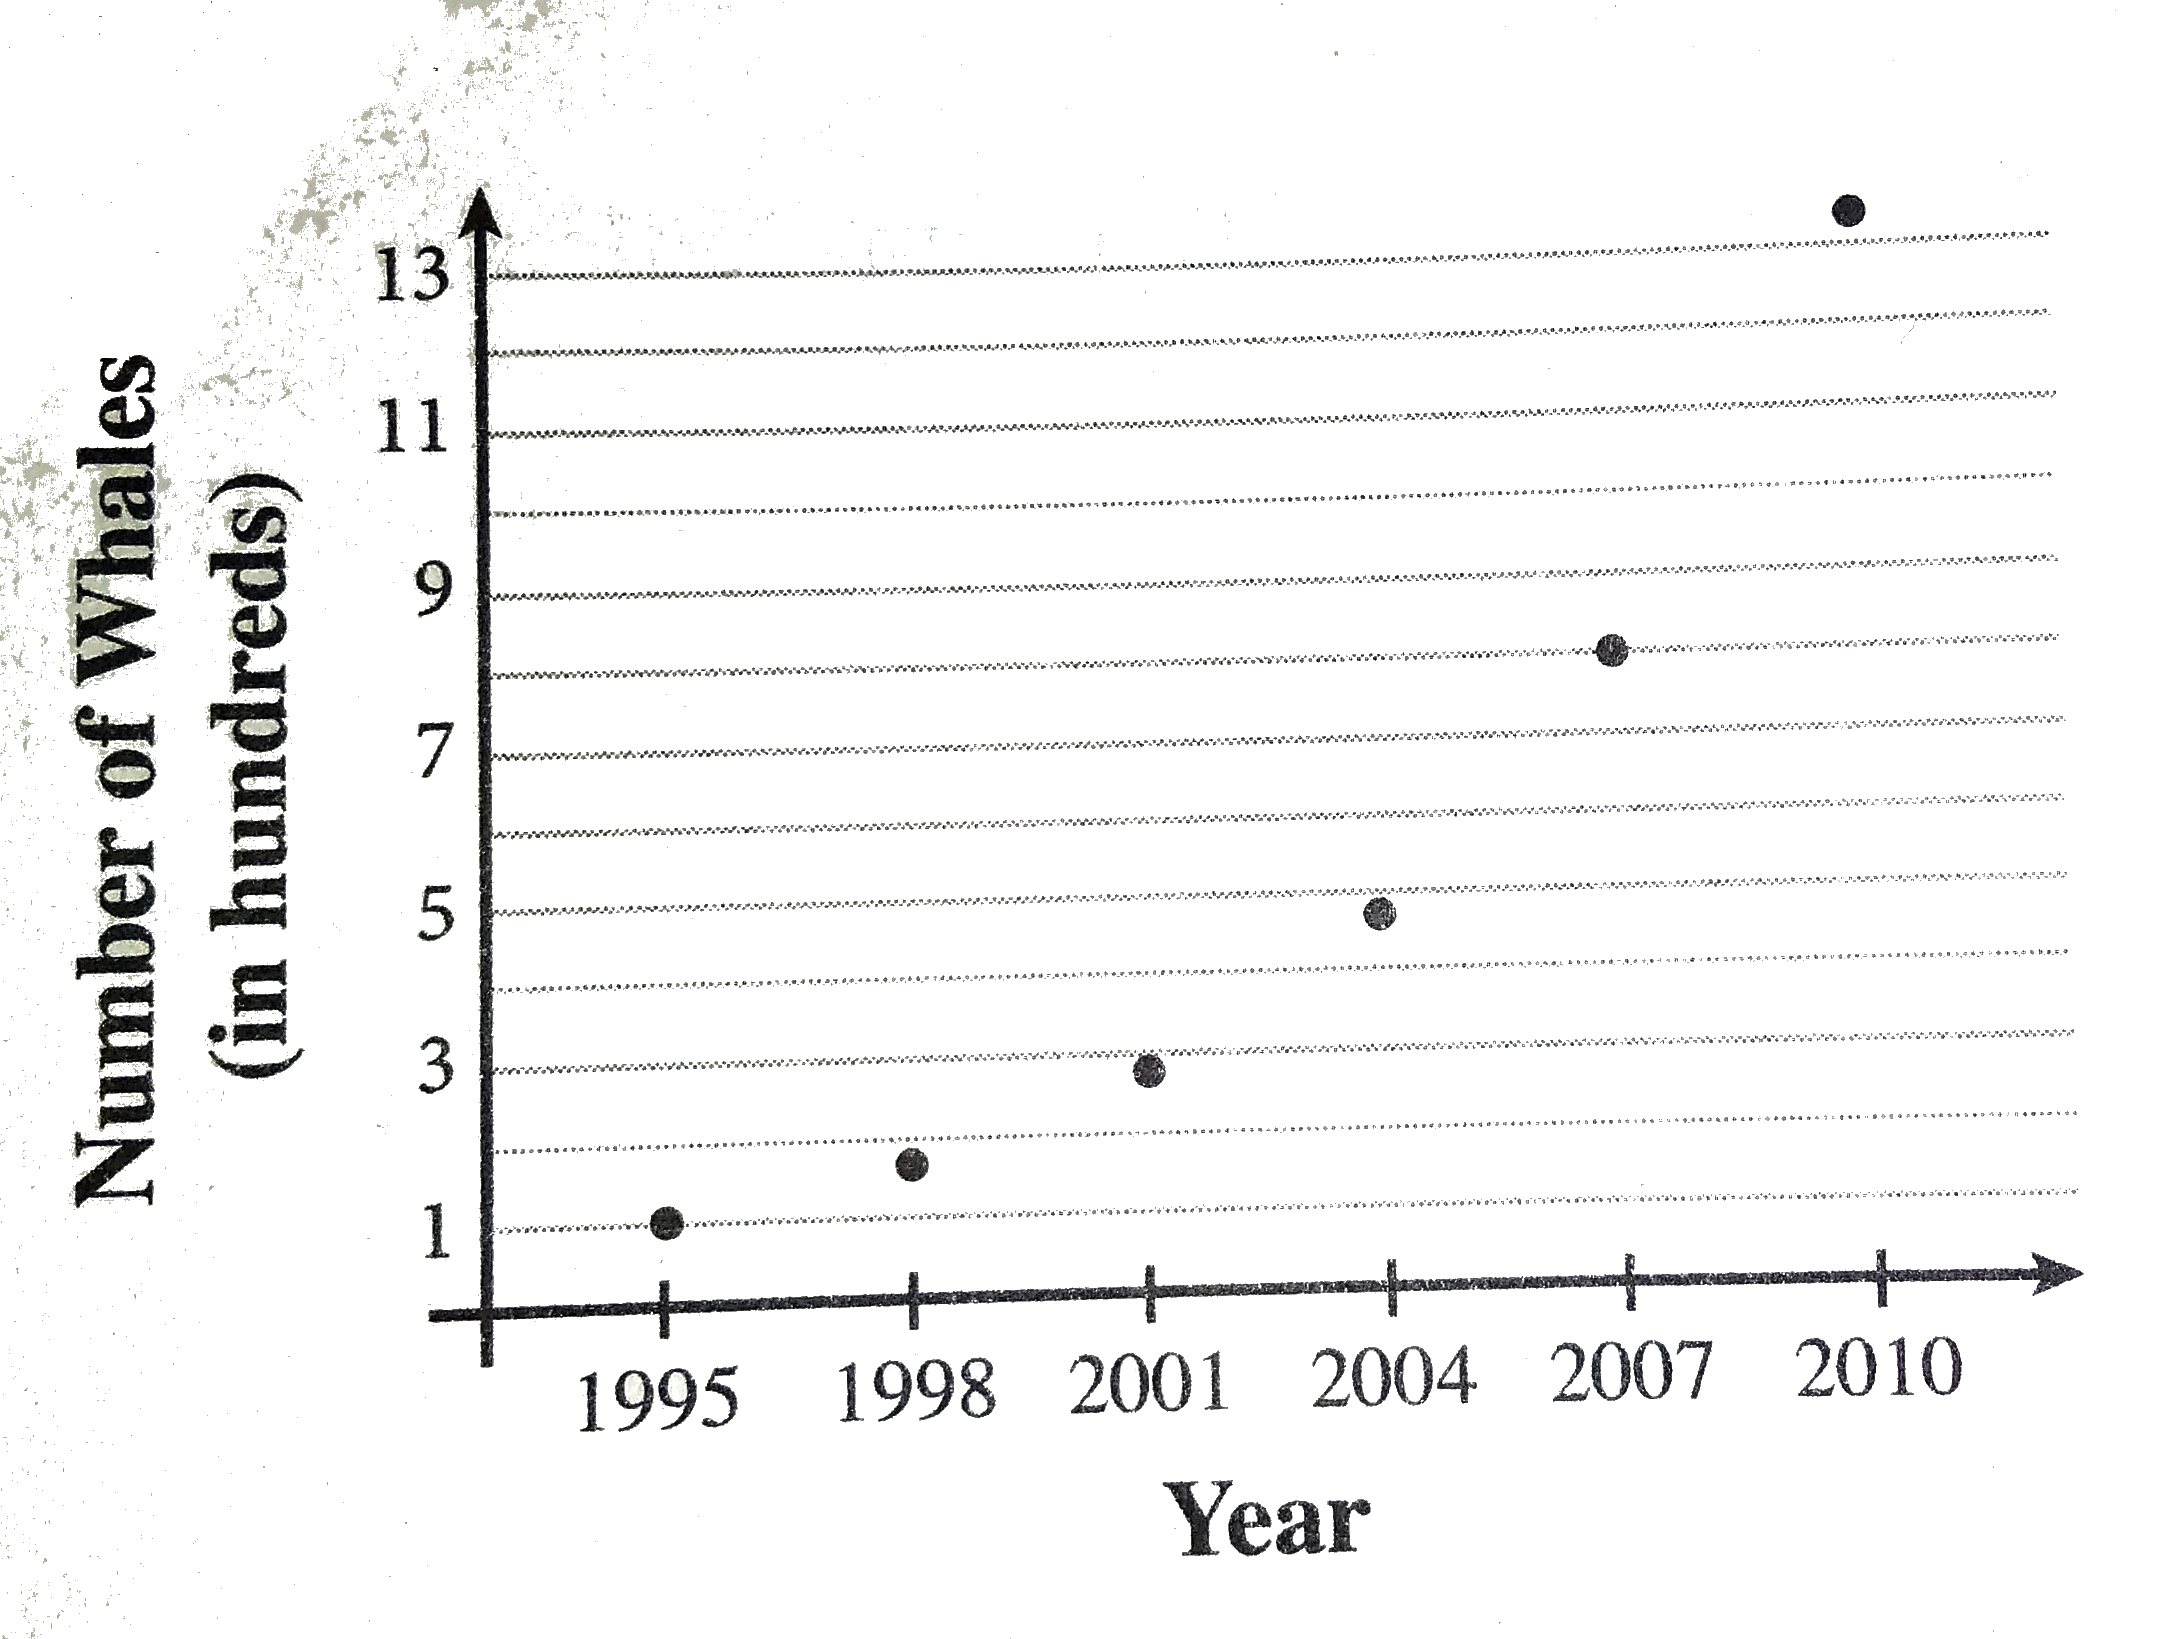
The blue whale is the largest creature in the world and has been found in every ocean in the world. A marine boilogist surveyed the blue whale population in Monterey Bay, off the coast of California, every three every years between 1995 and 2010. The figure above shows her result. If w is the number of blue whales present in Monterey Bay and t is the number of years since the study began in 1995 , which of the following equations best represents the blue whale population of Monterey Bay?
View Solution
Knowledge Check
Which of the following inequalities represents the graph shown below on the real number line ?
 A0<x<5B0<x≤4C−2<x≤4D1≤x≤4
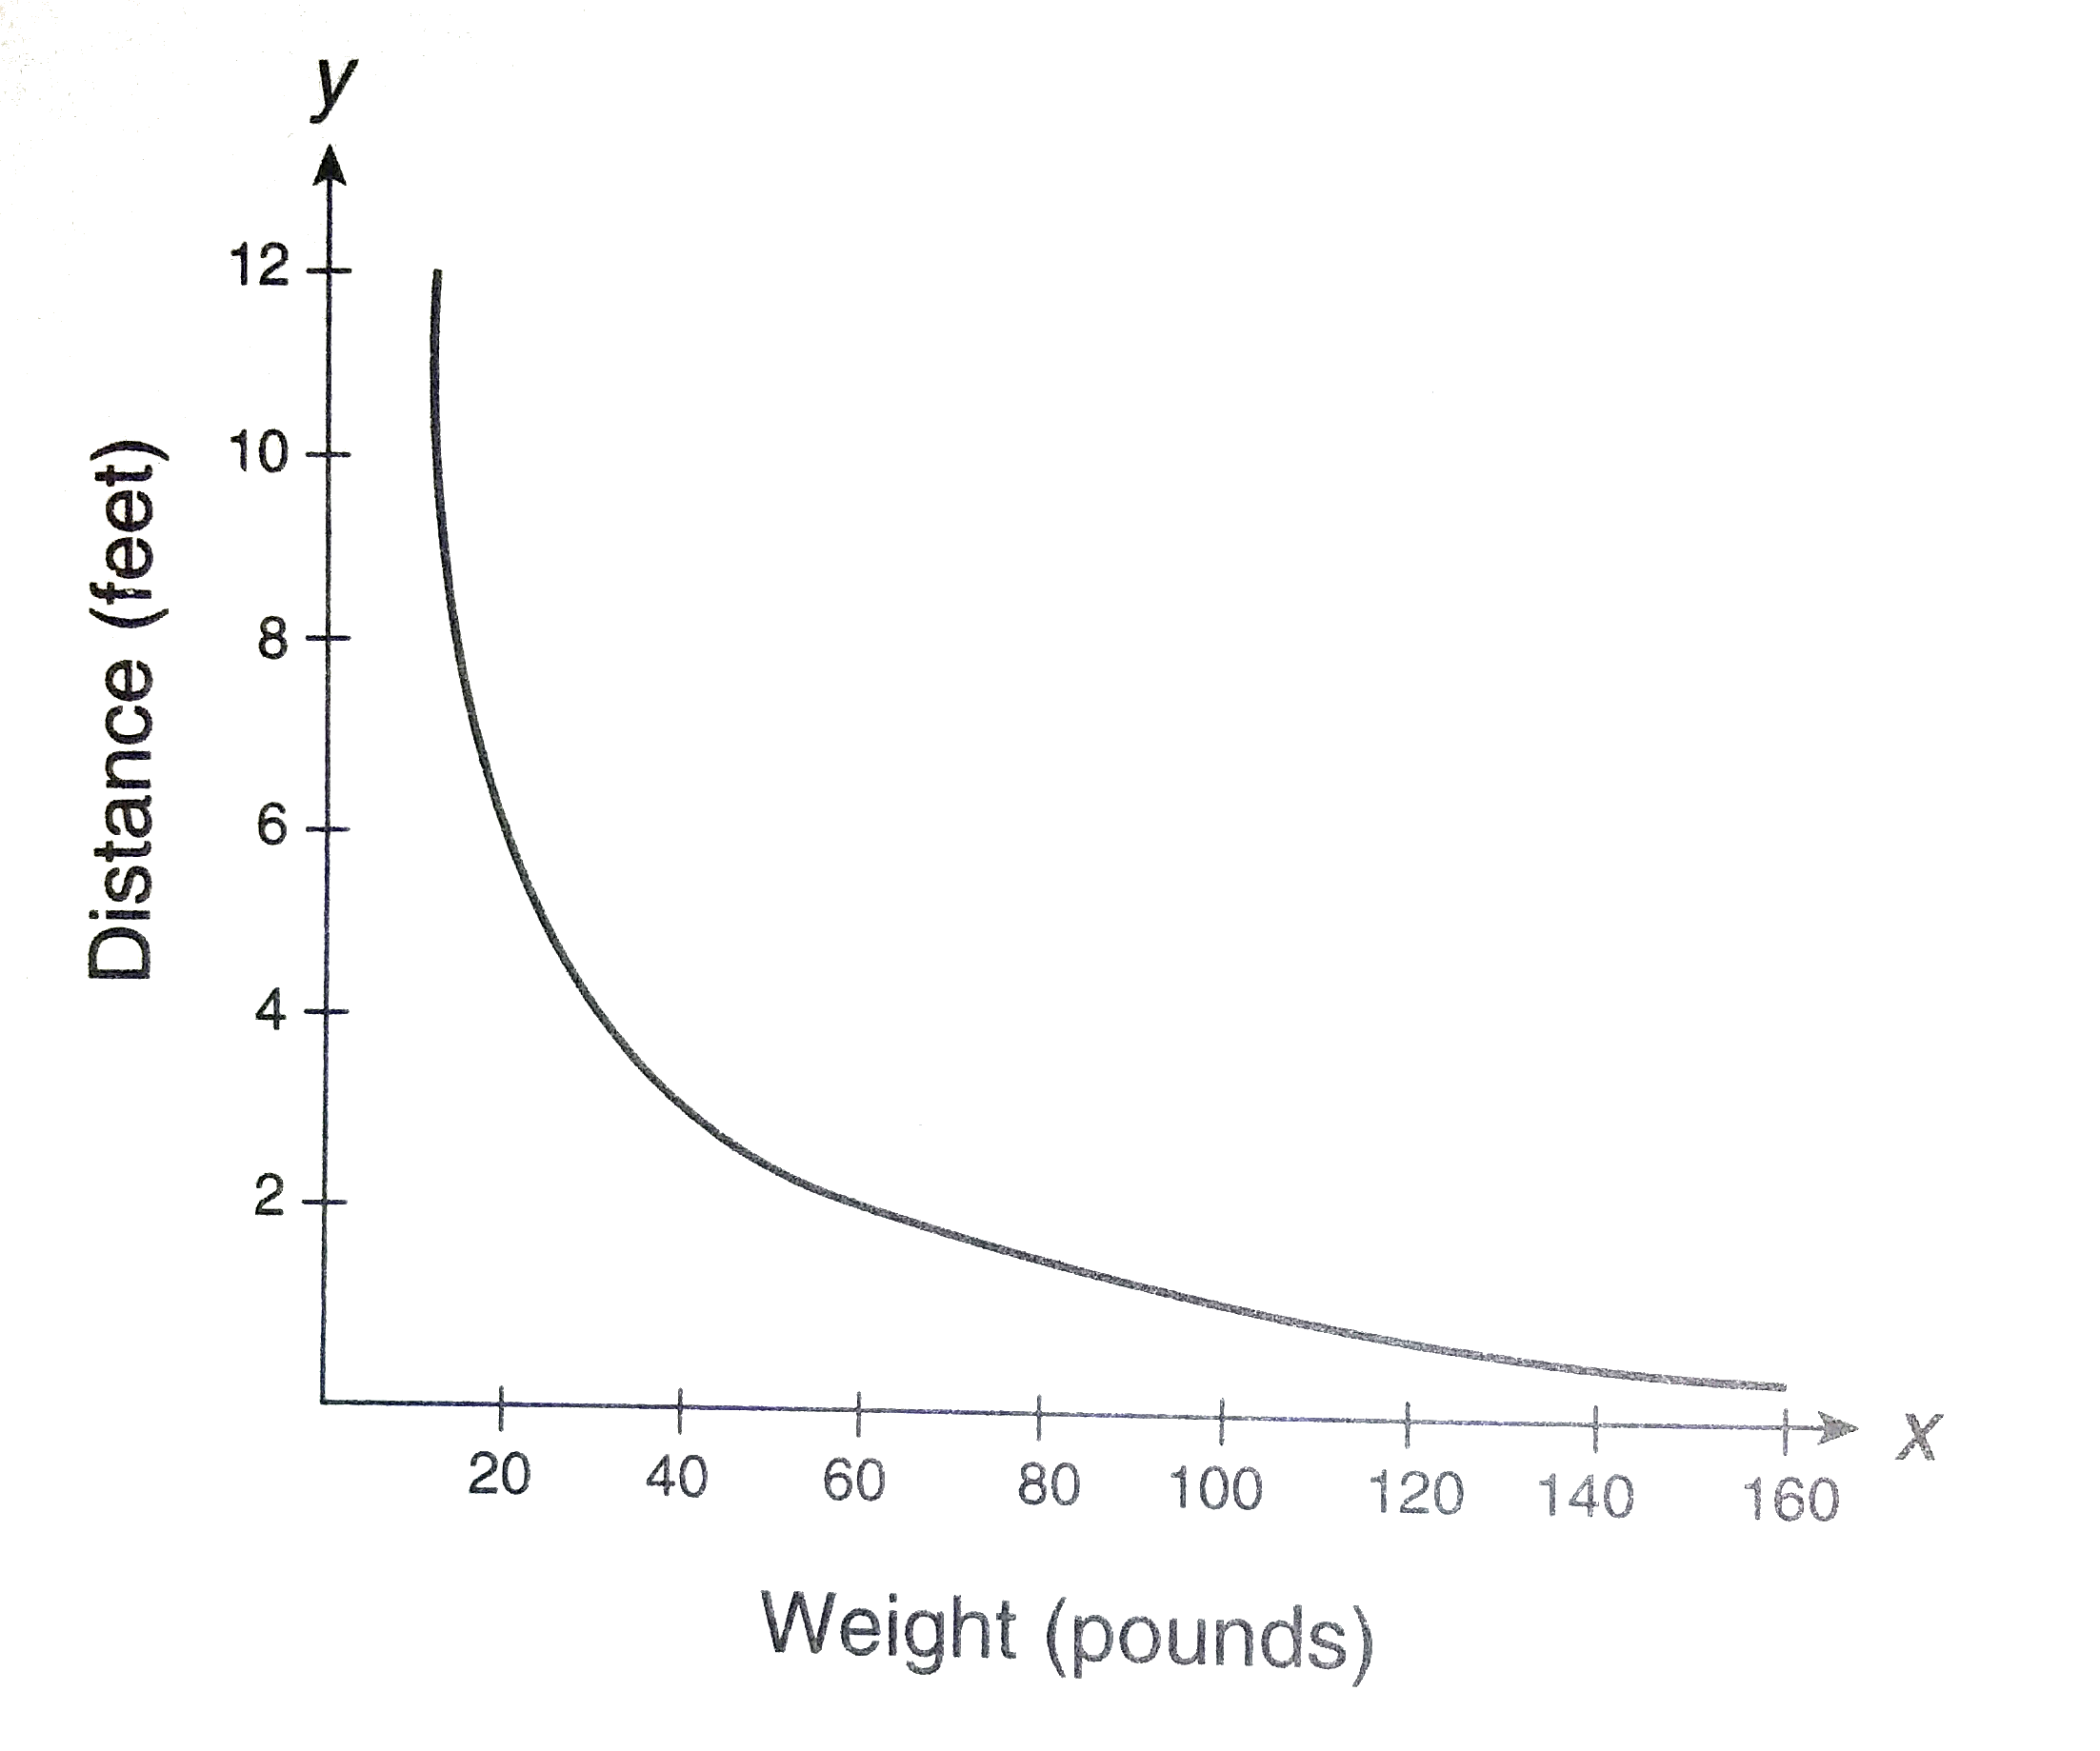
The graph above shows the relationship between a person's weight and the distance that the person must sit from the center of seesaw to make it balanced. Which of the following best represents the equation of this graph?Ay=12x2By=−120xCy=120(12)xDy=120x(##KPL_SAT_PRD_PLS_C09_E01_004_Q01.png" width="80%">
The scaterplot abouve shows data collected each year after the British Parlimament enacted a mandatory seat belt law and line of beast fit to the data. Which of the following equations best represents the trend of the data shown in the figure ?Ay=0.4x+25By=1.8x+15Cy=2.1x+35Dy=2.6x+25
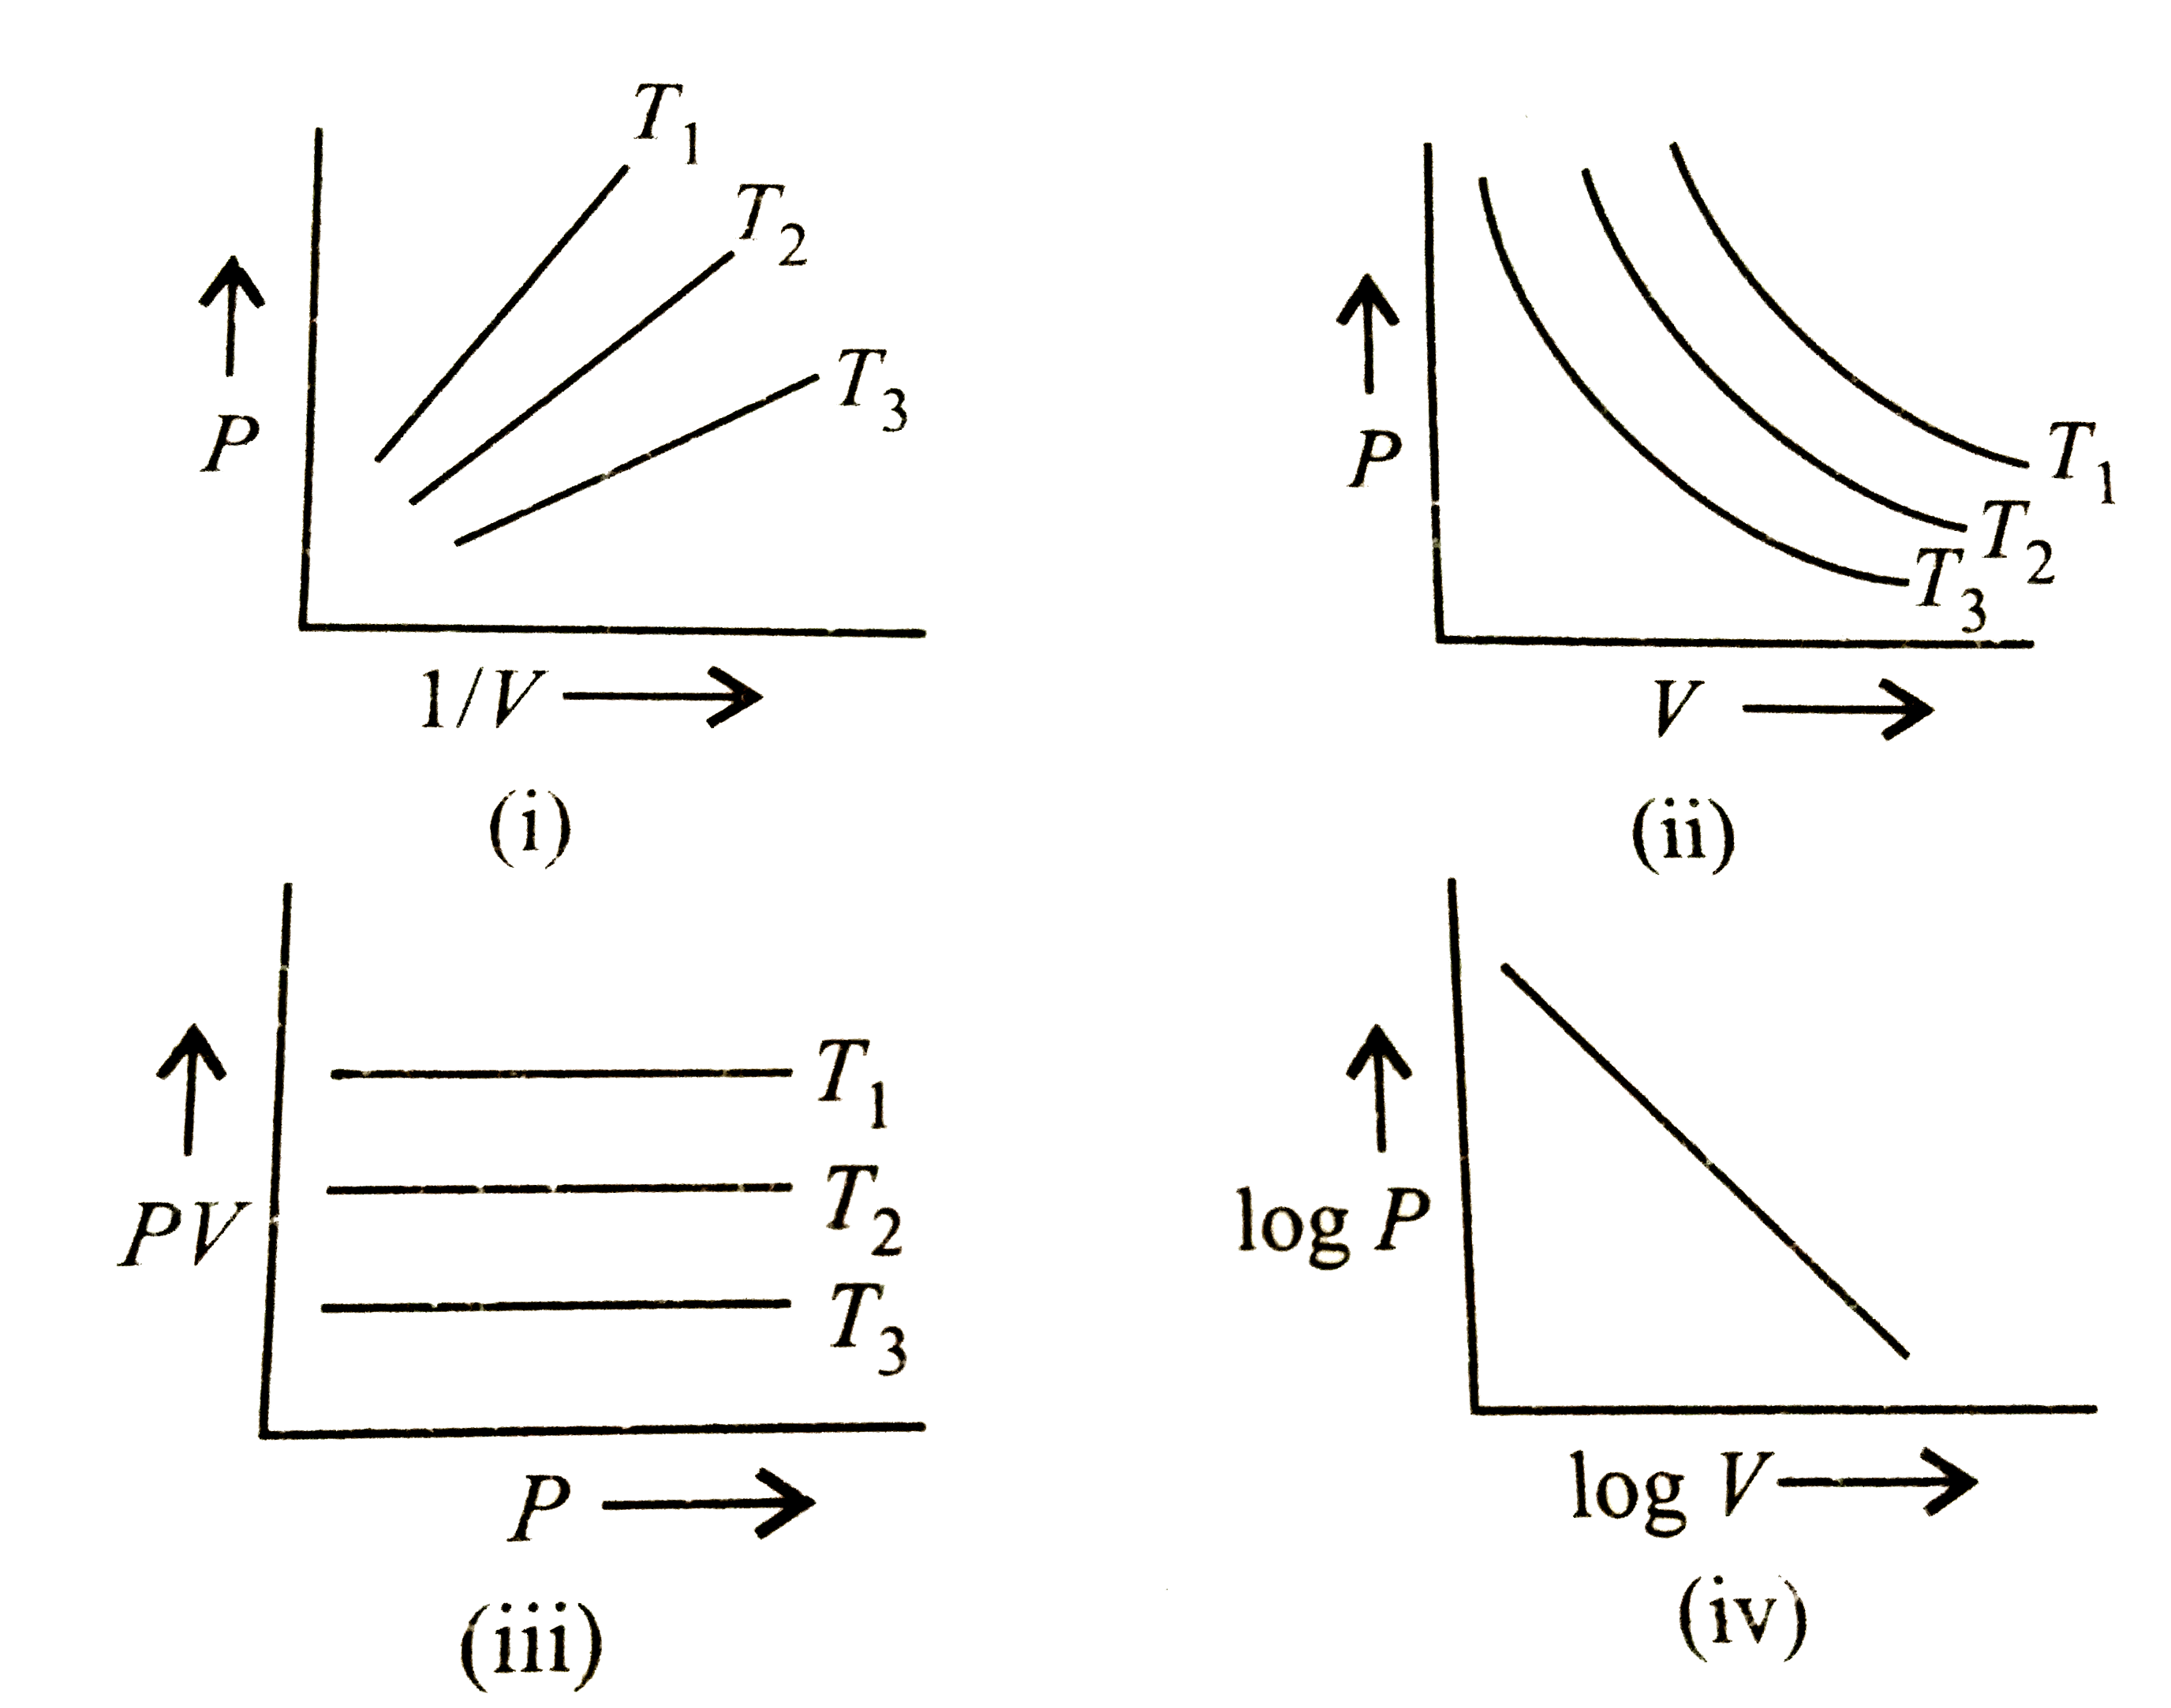
Graphs between pressure and volume are plotted at different temperatures . Which of the following isotherms represents Boyle's law as PV = constant ? (T1>T2>T3)
View Solution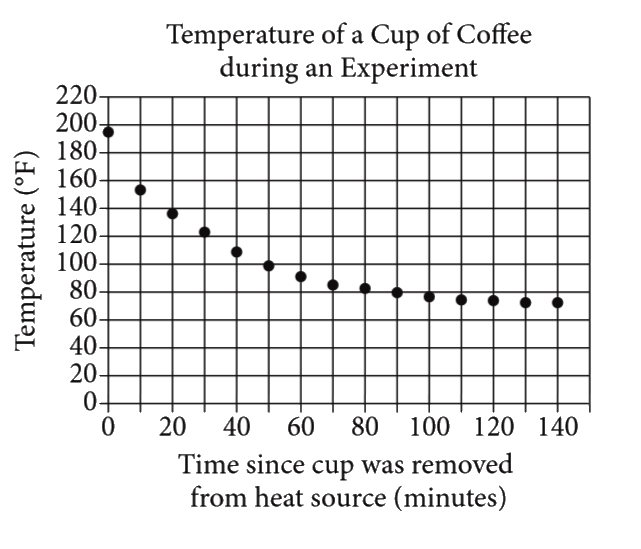
In an experiment, a heated cup of coffee is removed from a heat source, and the cup of coffee is then left in a room that is kept at a constant temperature. The graph above shows the temperature, in degrees Fahrenheit (.∘F), of the coffee immediately after being removed from the heat source and at 10-minute intervals thereafter.
During which of the following 10-minute intervals does the temperature of the coffee decrease at the greatest average rate?
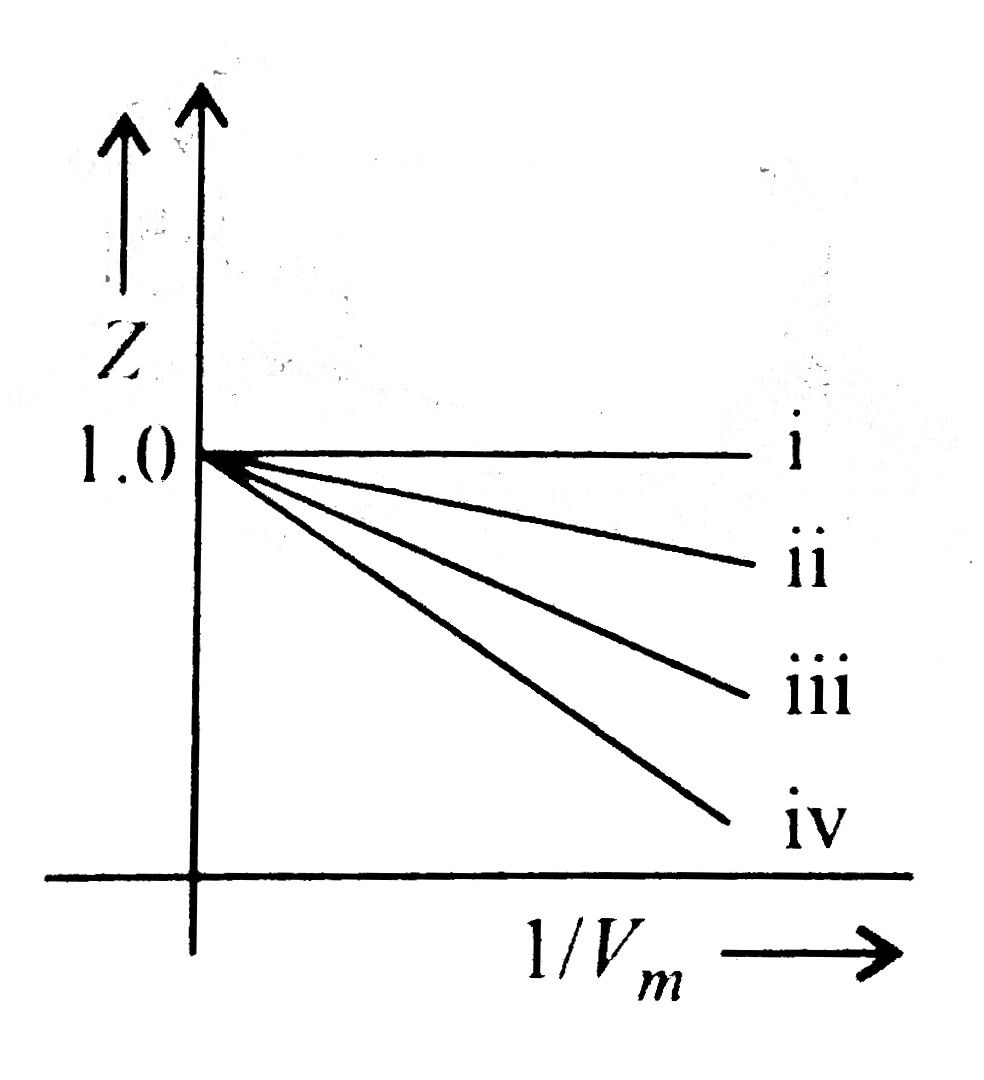
View SolutionConsidering the graph, which of the following gases have the highest critical temperature Tc?
View SolutionIn the figure below, a highway rest area (at D) and radar stations (at A and B) lie on a level east-west line, A is 9,000 feet due west of D. An airplane (at C) is shown directly above the rest area, flying due west at a constant speed of 300 feet per secod and at a constant altitude of 12,000 feet. The airplane is located at a straight-line distance of 15,000 feet from the radar station at A and 13,000 feet from the radar station at B.
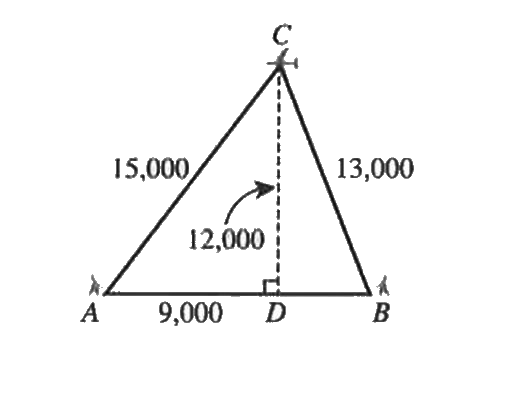
Let A, C and D lie in the standard (x,y) coordinate plane such that A is at (0,0) and D is at (9,000, 0). Which of the following equations represents the line along which the airplane is flying?
View Solution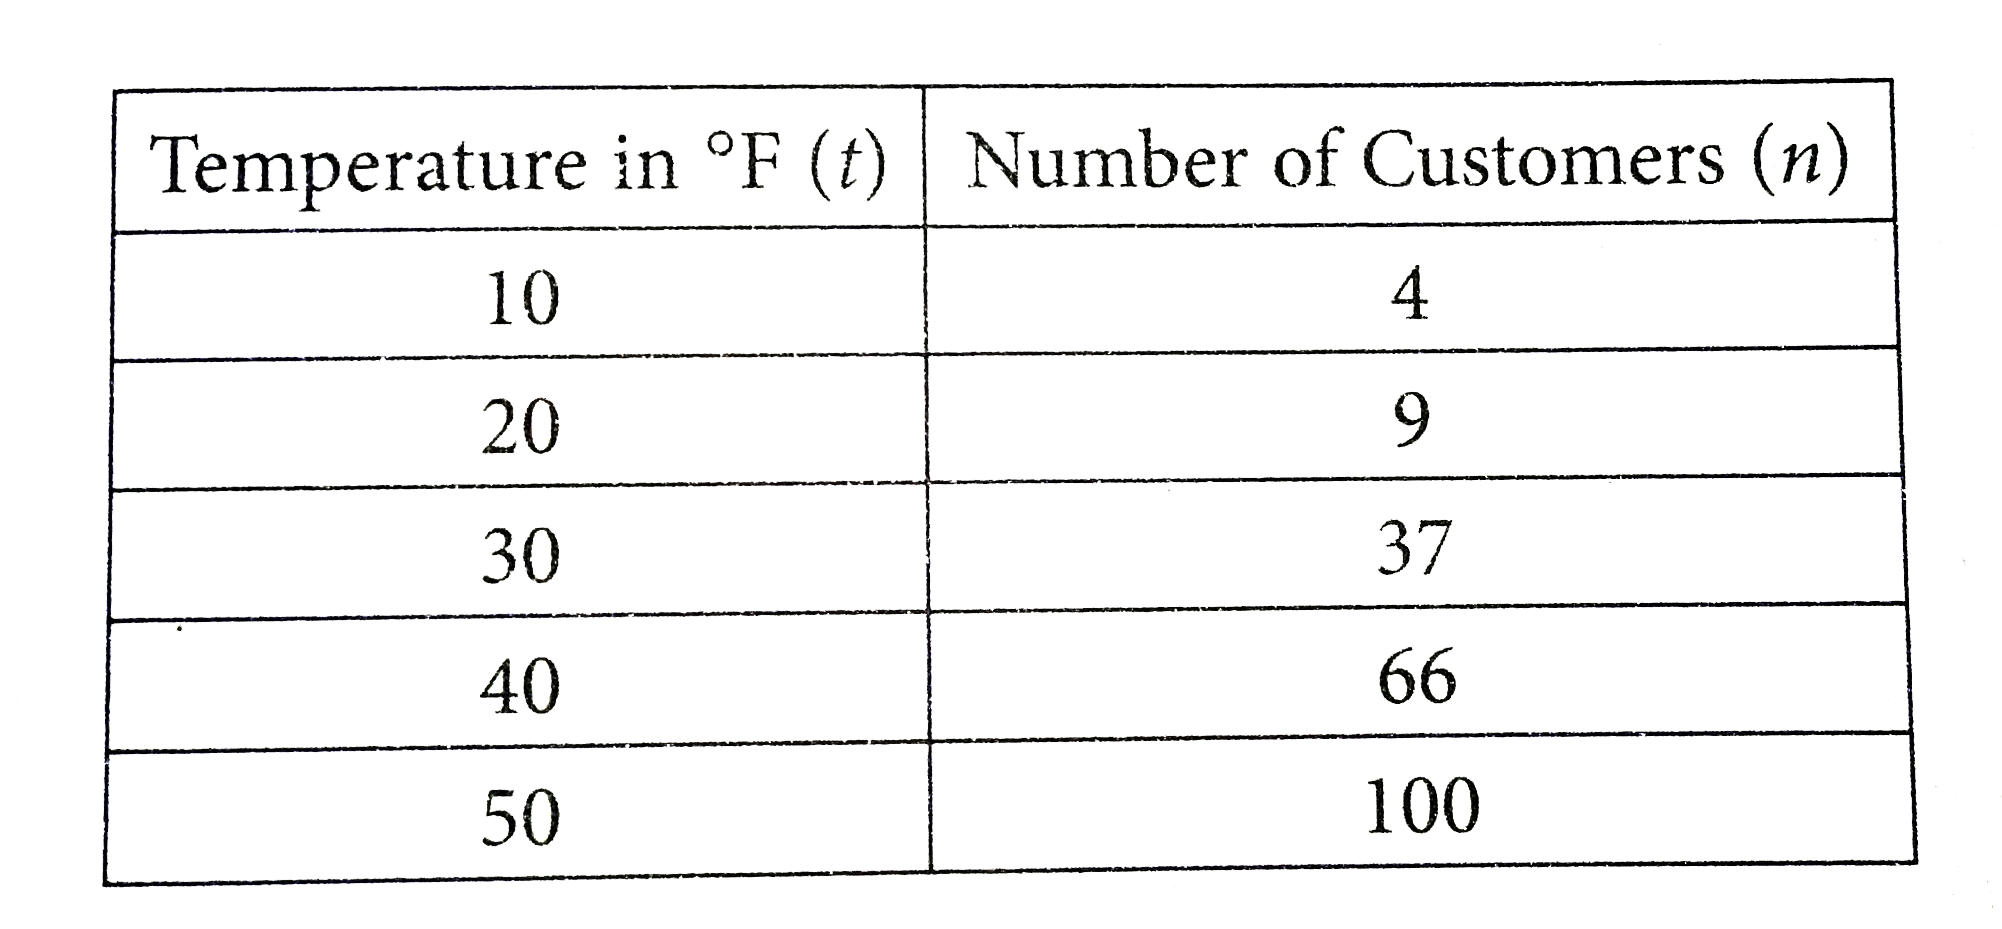
A coffee shop noticed that the outside temperature affected the number of customers who came to the shop that day, as shown in the table above. Which of the following graphs best represents the relationship between the outside temperature t, and the number of customers,n, as indicated by the table?
View Solution
