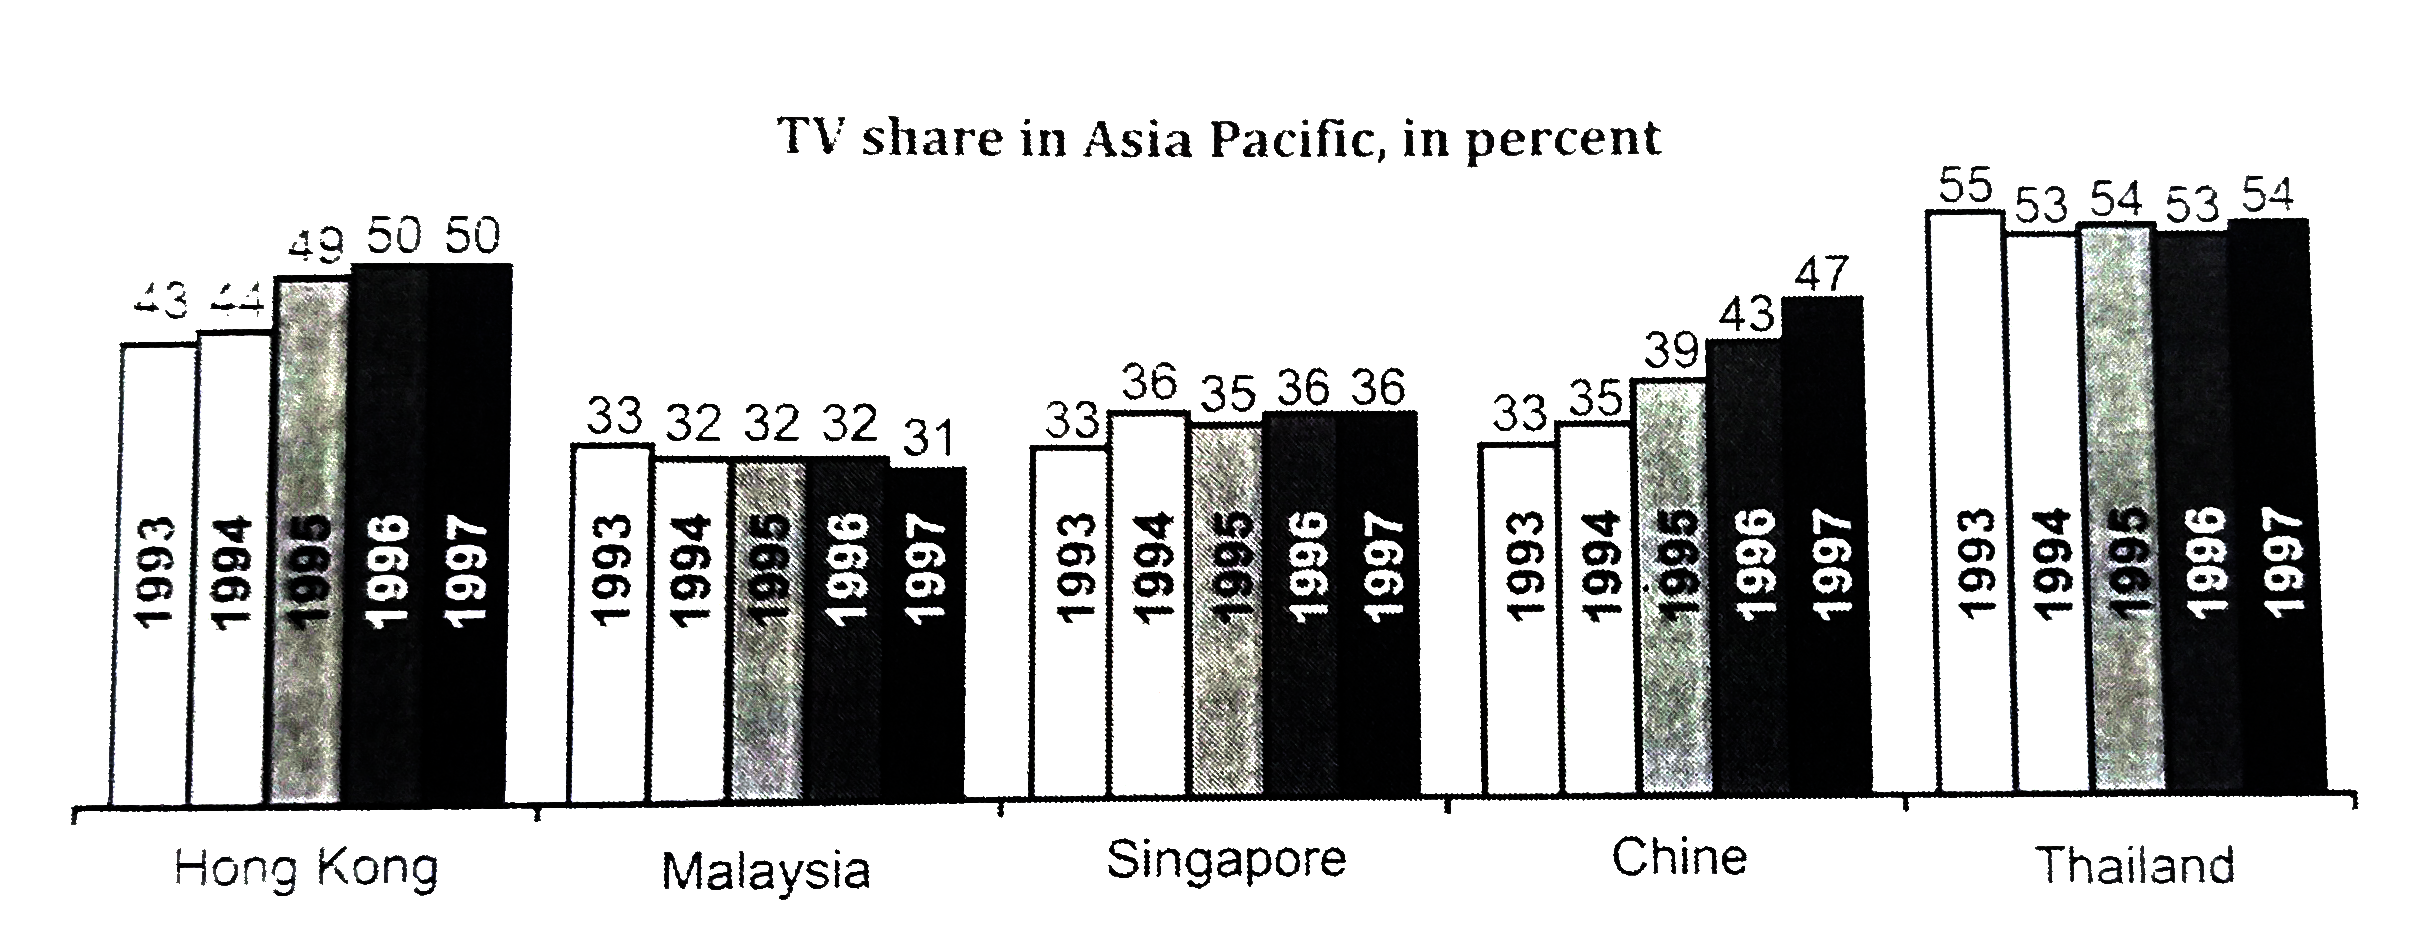
The graph shows the percenatge of population owining TV sets in various countries .
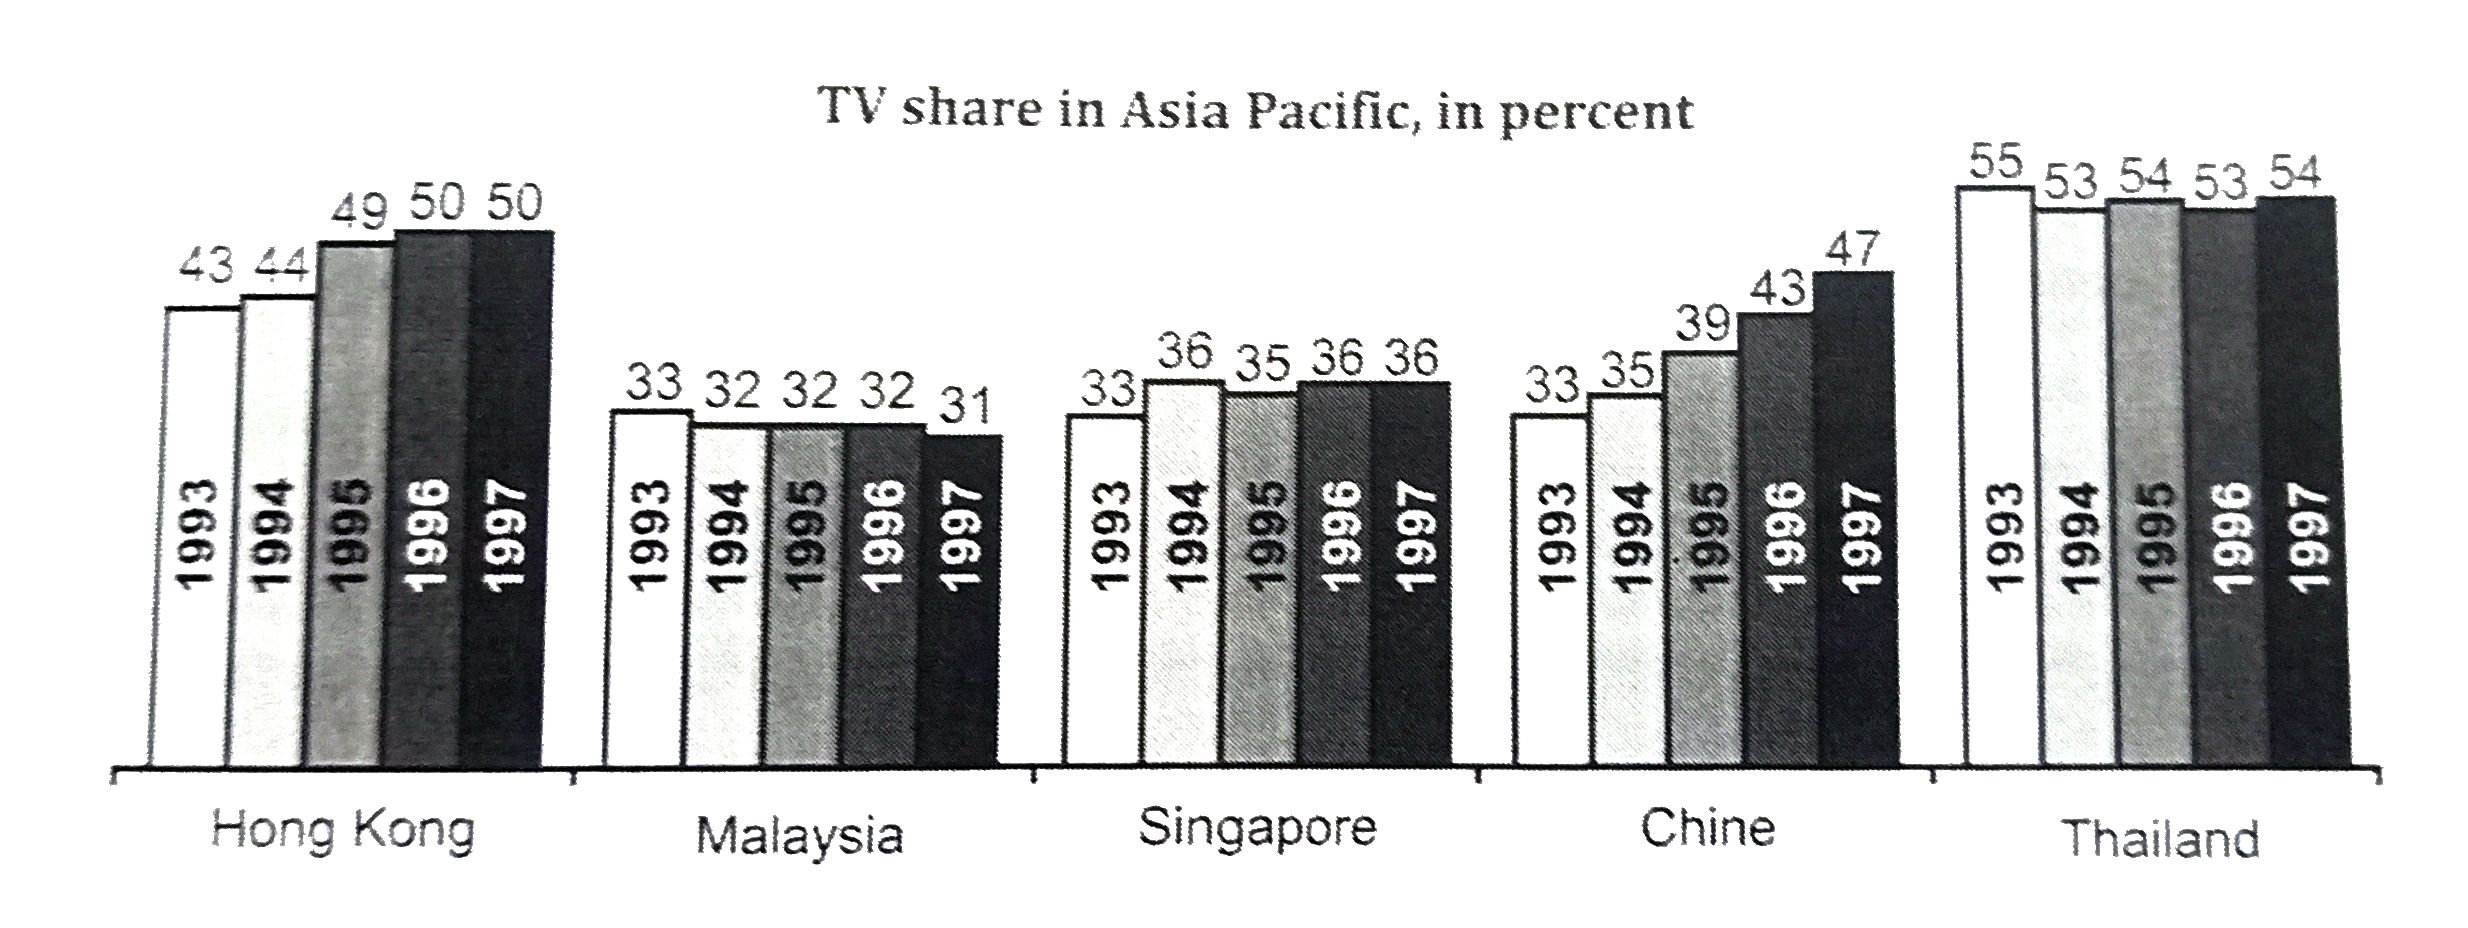
Assuming that the population of all the countries is the same and remains constant for the given years, which fo the following opitons in INCORRECT ?
Number of TV sets in Hong Kong has increased by approximately 16.3% form 1993 to 1997.
Number of TV sets in Singapore and China is the same for 1993
Number of TV sets increasen by 12.5% for Singapore from 1993 to 1997.
Number of TV sets for China increased by approximately 42.4% from 1993to 1997.
The correct Answer is:C
Step by step video, text & image solution for The graph shows the percenatge of population owining TV sets in various countries . Assuming that the population of all the countries is the same and remains constant for the given years, which fo the following opitons in INCORRECT ? by Maths experts to help you in doubts & scoring excellent marks in Class 12 exams.
Updated on:21/07/2023Topper's Solved these Questions
Similar Questions
Knowledge Check
The graph shows the percenatge of population owining TV sets in various countries .
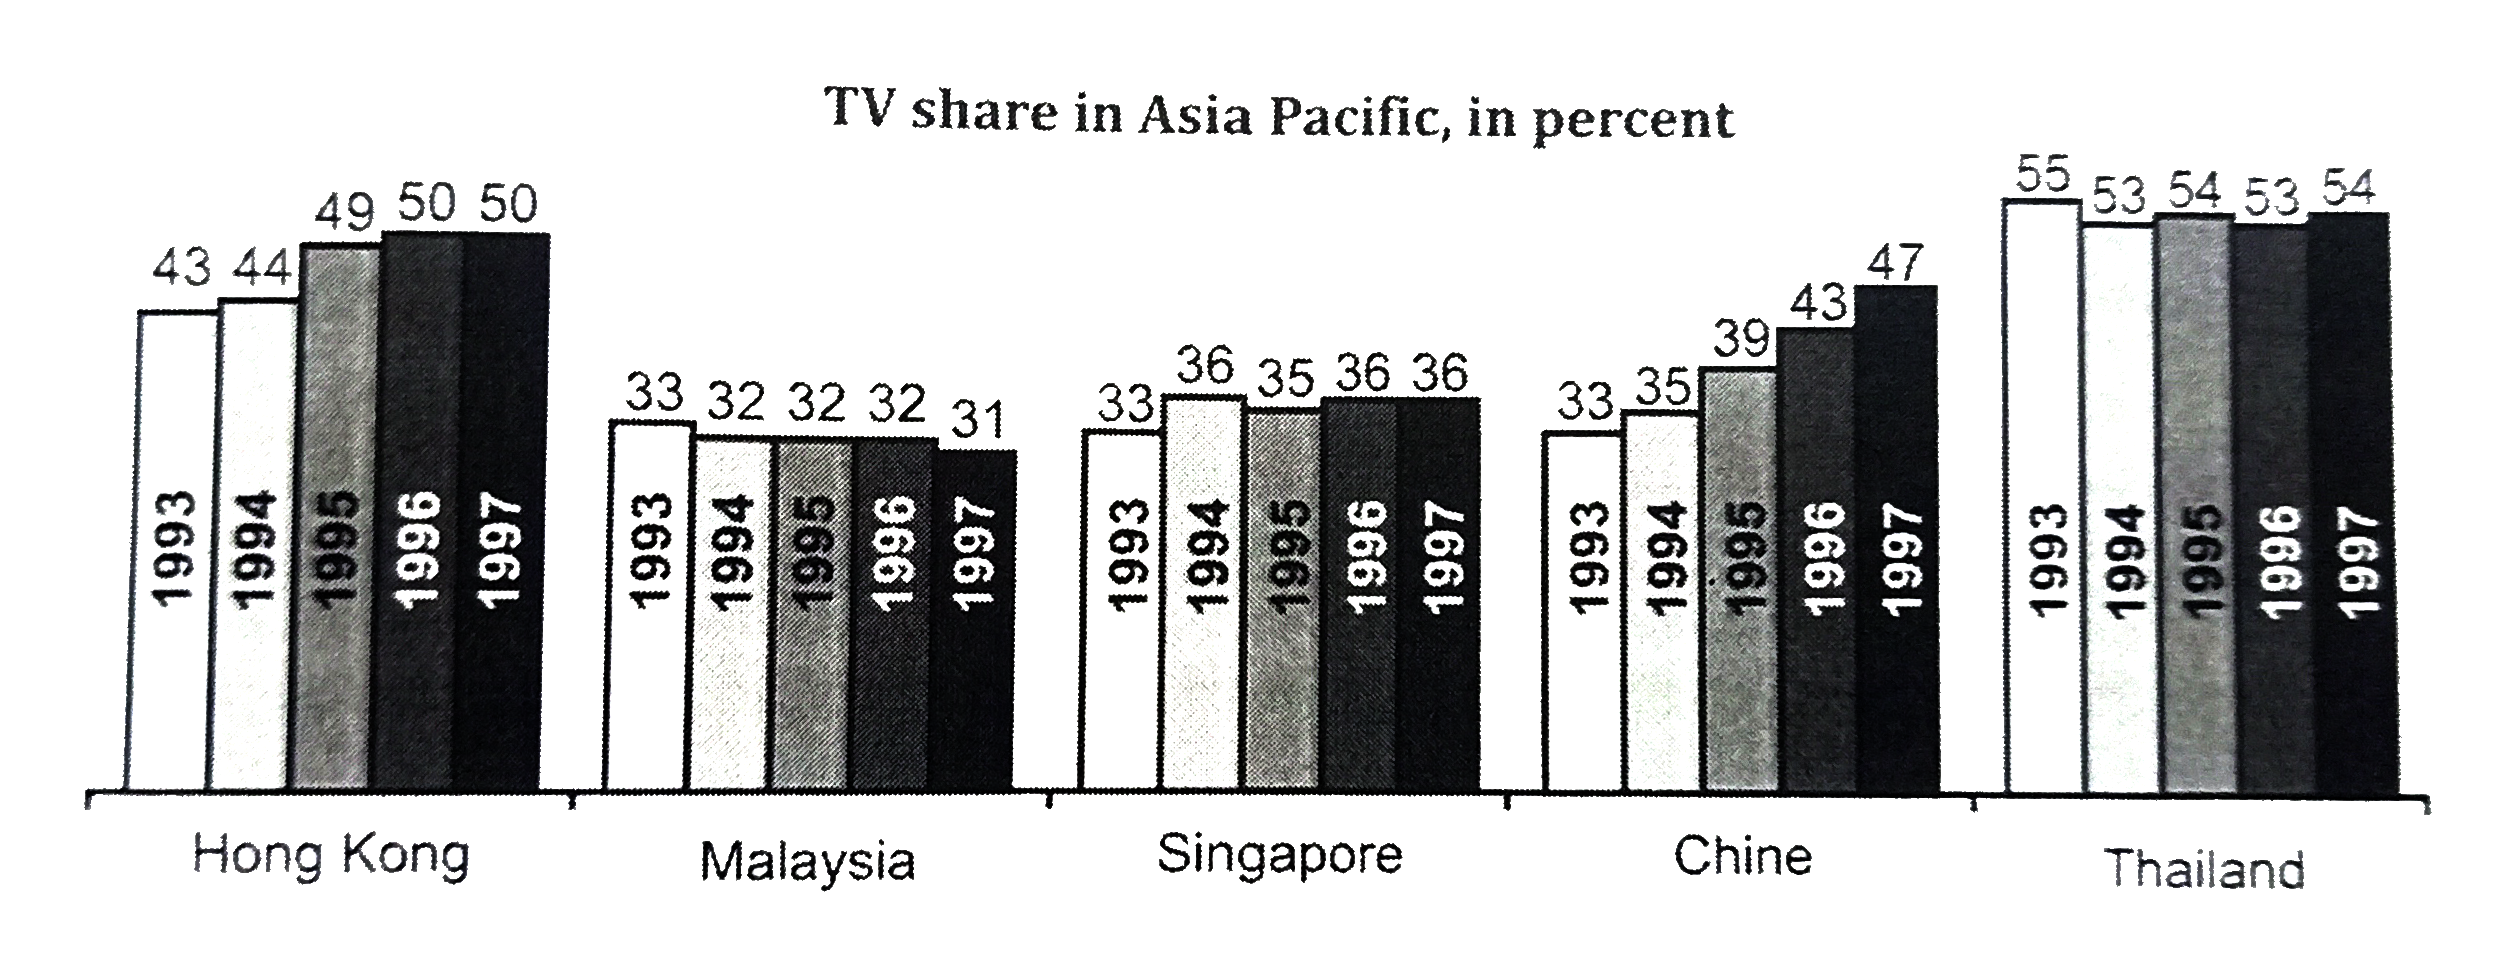
Which country has shown a nearly constant TV share for the 5 yearsAHong KongBMalaysisCSingaporeDChinaThe graph shows the percenatge of population owining TV sets in various countries .
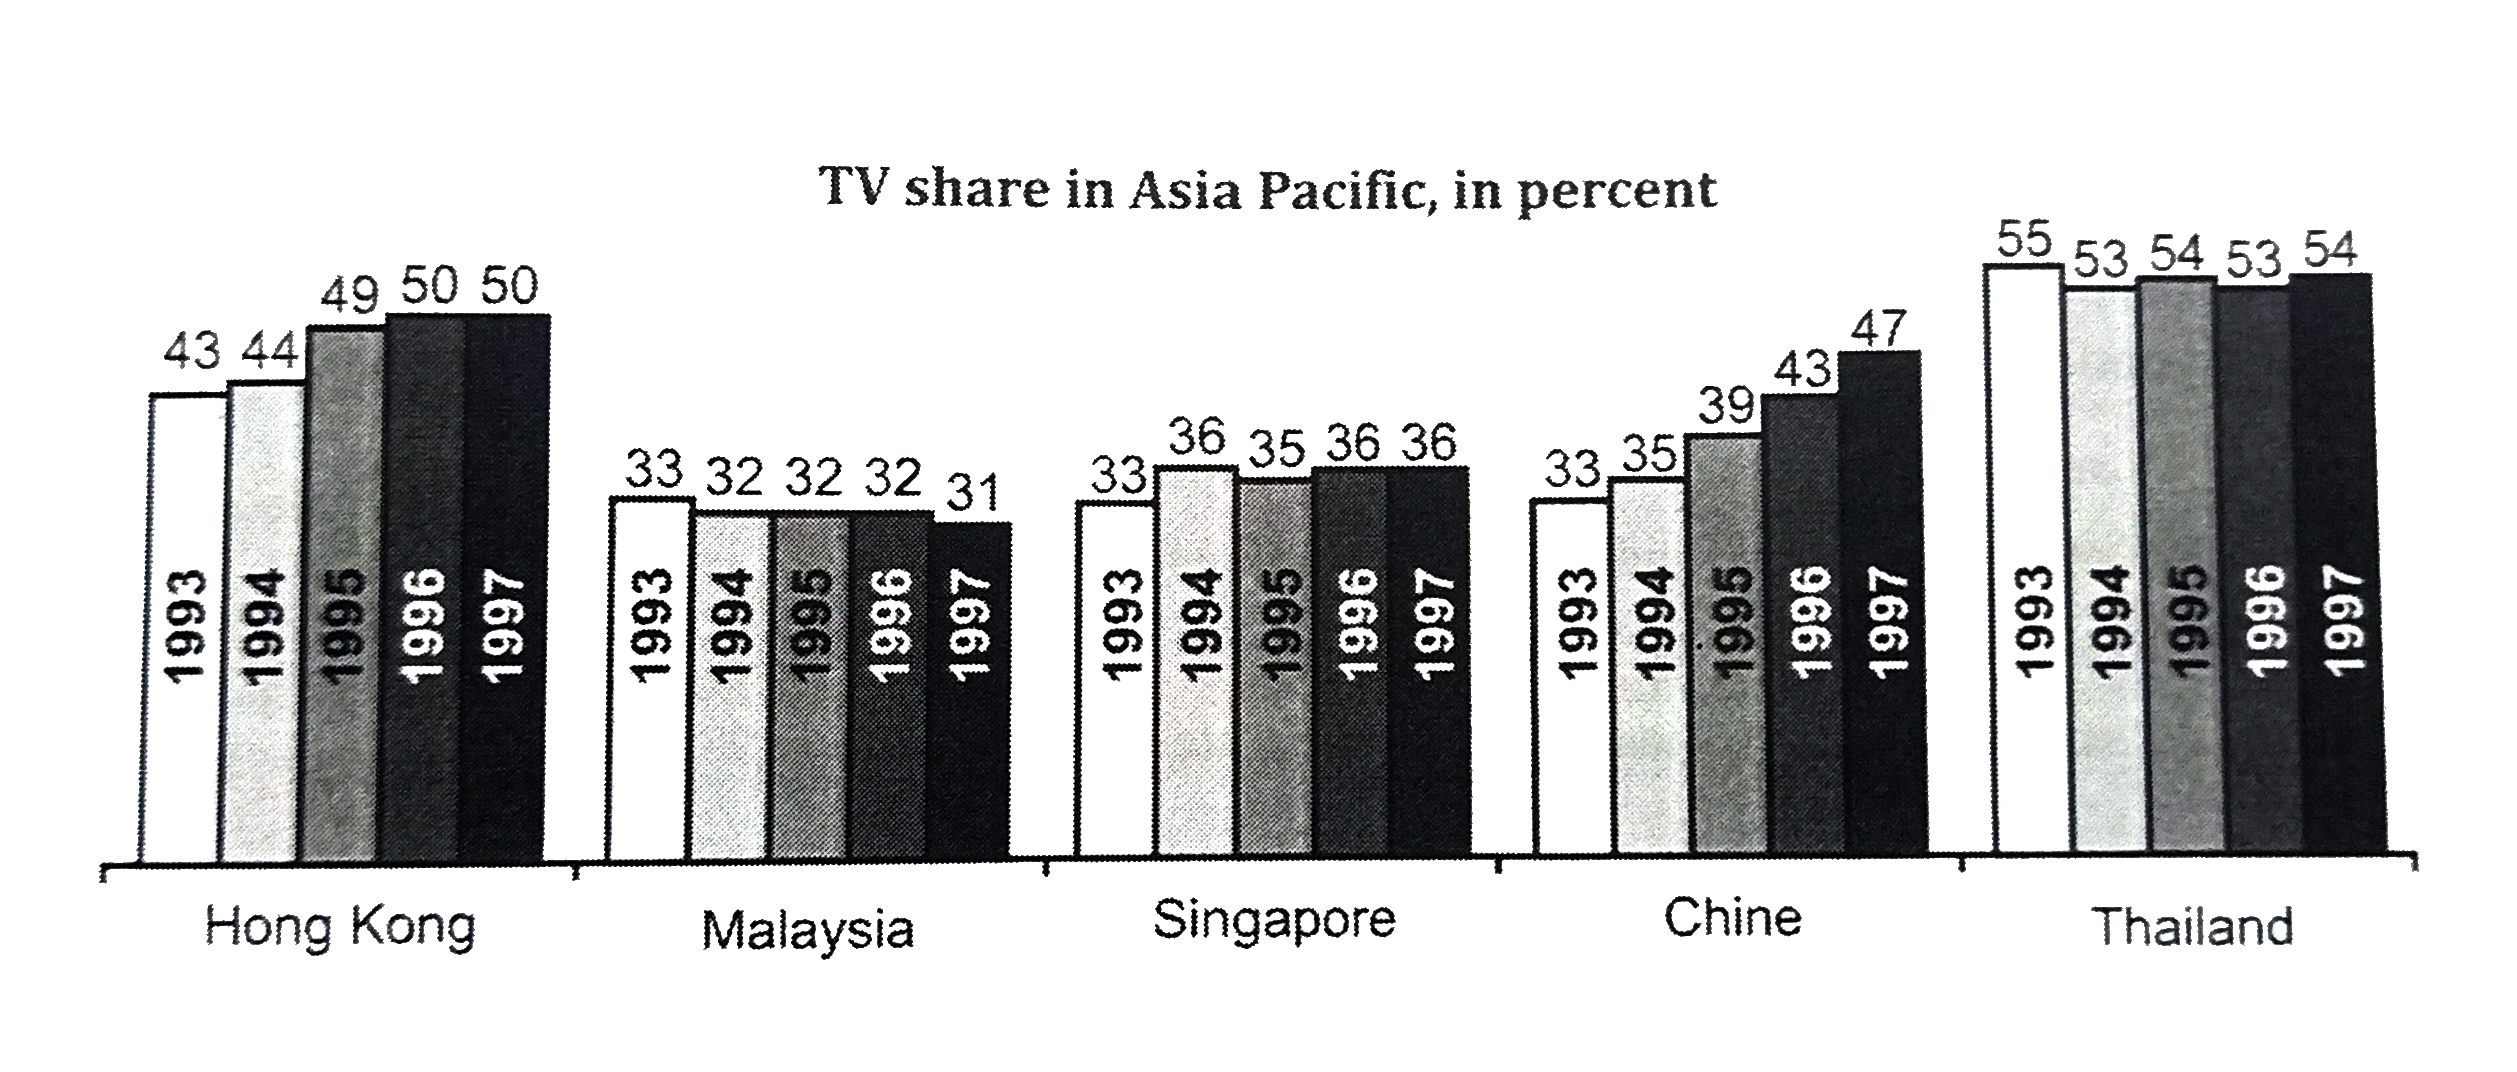
By what " percentage points" has the share of TV sets in Hong kong grown from 1993 to 1997 ?A7B15C16D21The graph shows the percenatge of population owining TV sets in various countries .
Which of the following countries has shown the highest percent decline in the percent share of TV sets from 19993 to 1997 ?AHong KongBThailnadCSingaporeDMalaysis
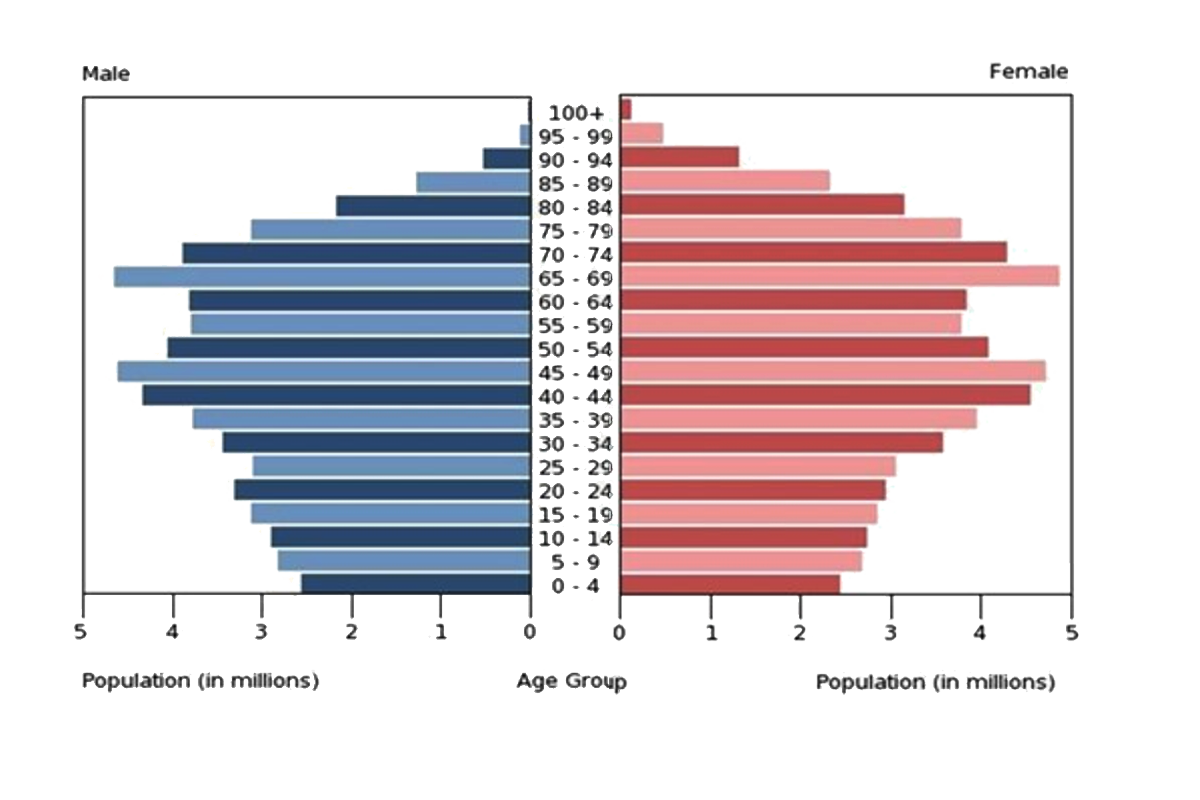
Observe the following agewise population graph of a country in 2018 . The population in this country is
View SolutionWhich of the following is most convincing reason for increasing population growth in a country?
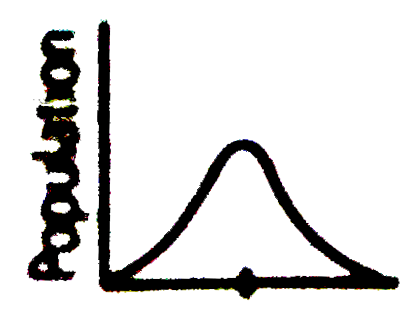
View SolutionThe given graph shows the range of variation among population members for a trait determined by multiple genes. If this population is subjected to disruptive selection for several generations, which of the following distributions is most likely to result?
View SolutionIn a given population of 2000 indivials, 80 births and 125 deaths were reported over a given period of time. Which of the following graphs will correspond to it ?
View Solution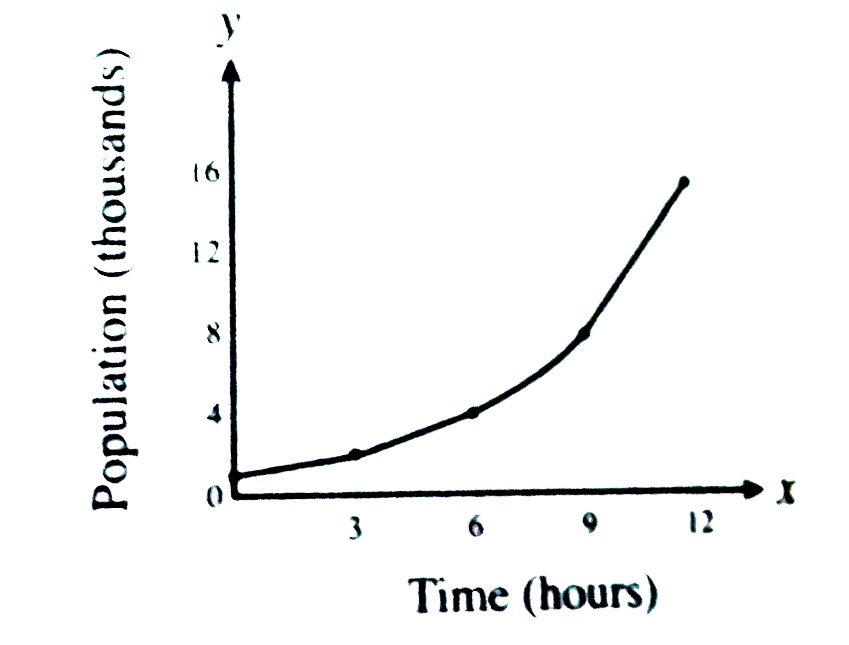
The graph above shows the size of a certain population after time t. Which of the following equations correctly shows y as a function of t ?
View Solution

