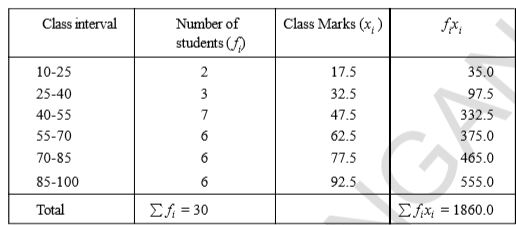
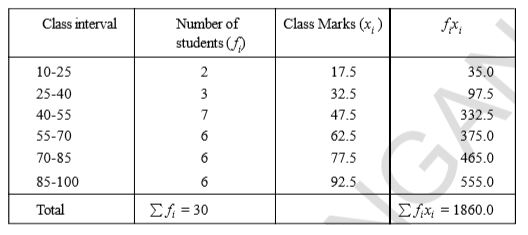
The marks distribution of 30 students in a mathematics examination are given in Table 3 of Example 1 . Find the mode of this data.Solution in Gujrati
The correct Answer is:62
Step by step video, text & image solution for The marks distribution of 30 students in a mathematics examination are given in Table 3 of Example 1 . Find the mode of this data. by Maths experts to help you in doubts & scoring excellent marks in Class 10 exams.
Updated on:21/07/2023Topper's Solved these Questions
- STATISTICSBOOK - KUMAR PRAKASHANCHAPTER - STATISTICSEXERCISE - Other Important Examples
9 Videos
- STATISTICSBOOK - KUMAR PRAKASHANCHAPTER - STATISTICSEXERCISE - Exercise 14.1
9 Videos
- SOME AAPLICATIONS OF TRIGONOMETRYBOOK - KUMAR PRAKASHANCHAPTER - SOME AAPLICATIONS OF TRIGONOMETRYEXERCISE - Objective Questions
24 Videos
- SURFACE AREAS AND VOLUMESBOOK - KUMAR PRAKASHANCHAPTER - SURFACE AREAS AND VOLUMESEXERCISE - TEST YOUR SKILLS
5 Videos
Similar Questions
The marks obtained by 100 students of two classes in mathematics paper consisting of 100 marks are as follows :
Marks obtained (xi)15202532354550607077808590929599 Number of students (fi)2374101298681194232
Find the mean of the marks obtained by the students directly. Then , classify the data with classes of equal length as 10-25, 25-40, . . . . 85-100 and find the mean by all the three methods.
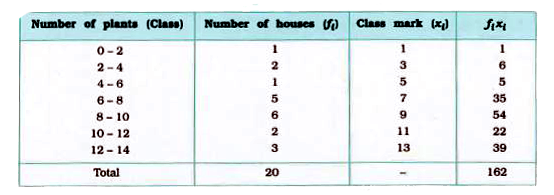
View SolutionA survey was conducted by a group of students as a part of their environment awareness programme, in which they collected the following data regarding the number of plants in 20 houses in a locality . Find the mean number of plants per house.
Number of plants 0−22−44−66−88−1010−1212−14Number of houses 1 2 1 5 6 2 3
Which method did you use for finding the mean, and why ?

View SolutionA kite is flying at a height of 75m from the level ground, attached to a taut string inclined at 60∘ to the horizontal. Then, the length of the string is …………m
View SolutionThe slant height of a frustum of a cone is 4 m and the perimeter of circular ends are 18 m and 16 m. Find the cost of painting its curved surface at 10 per sq. m.
View SolutionThe marks distribution of 30 students m a mathematics examination are given in Table of Example 1. Find the mode of this data. Also compare and interpret the mode and the mean.
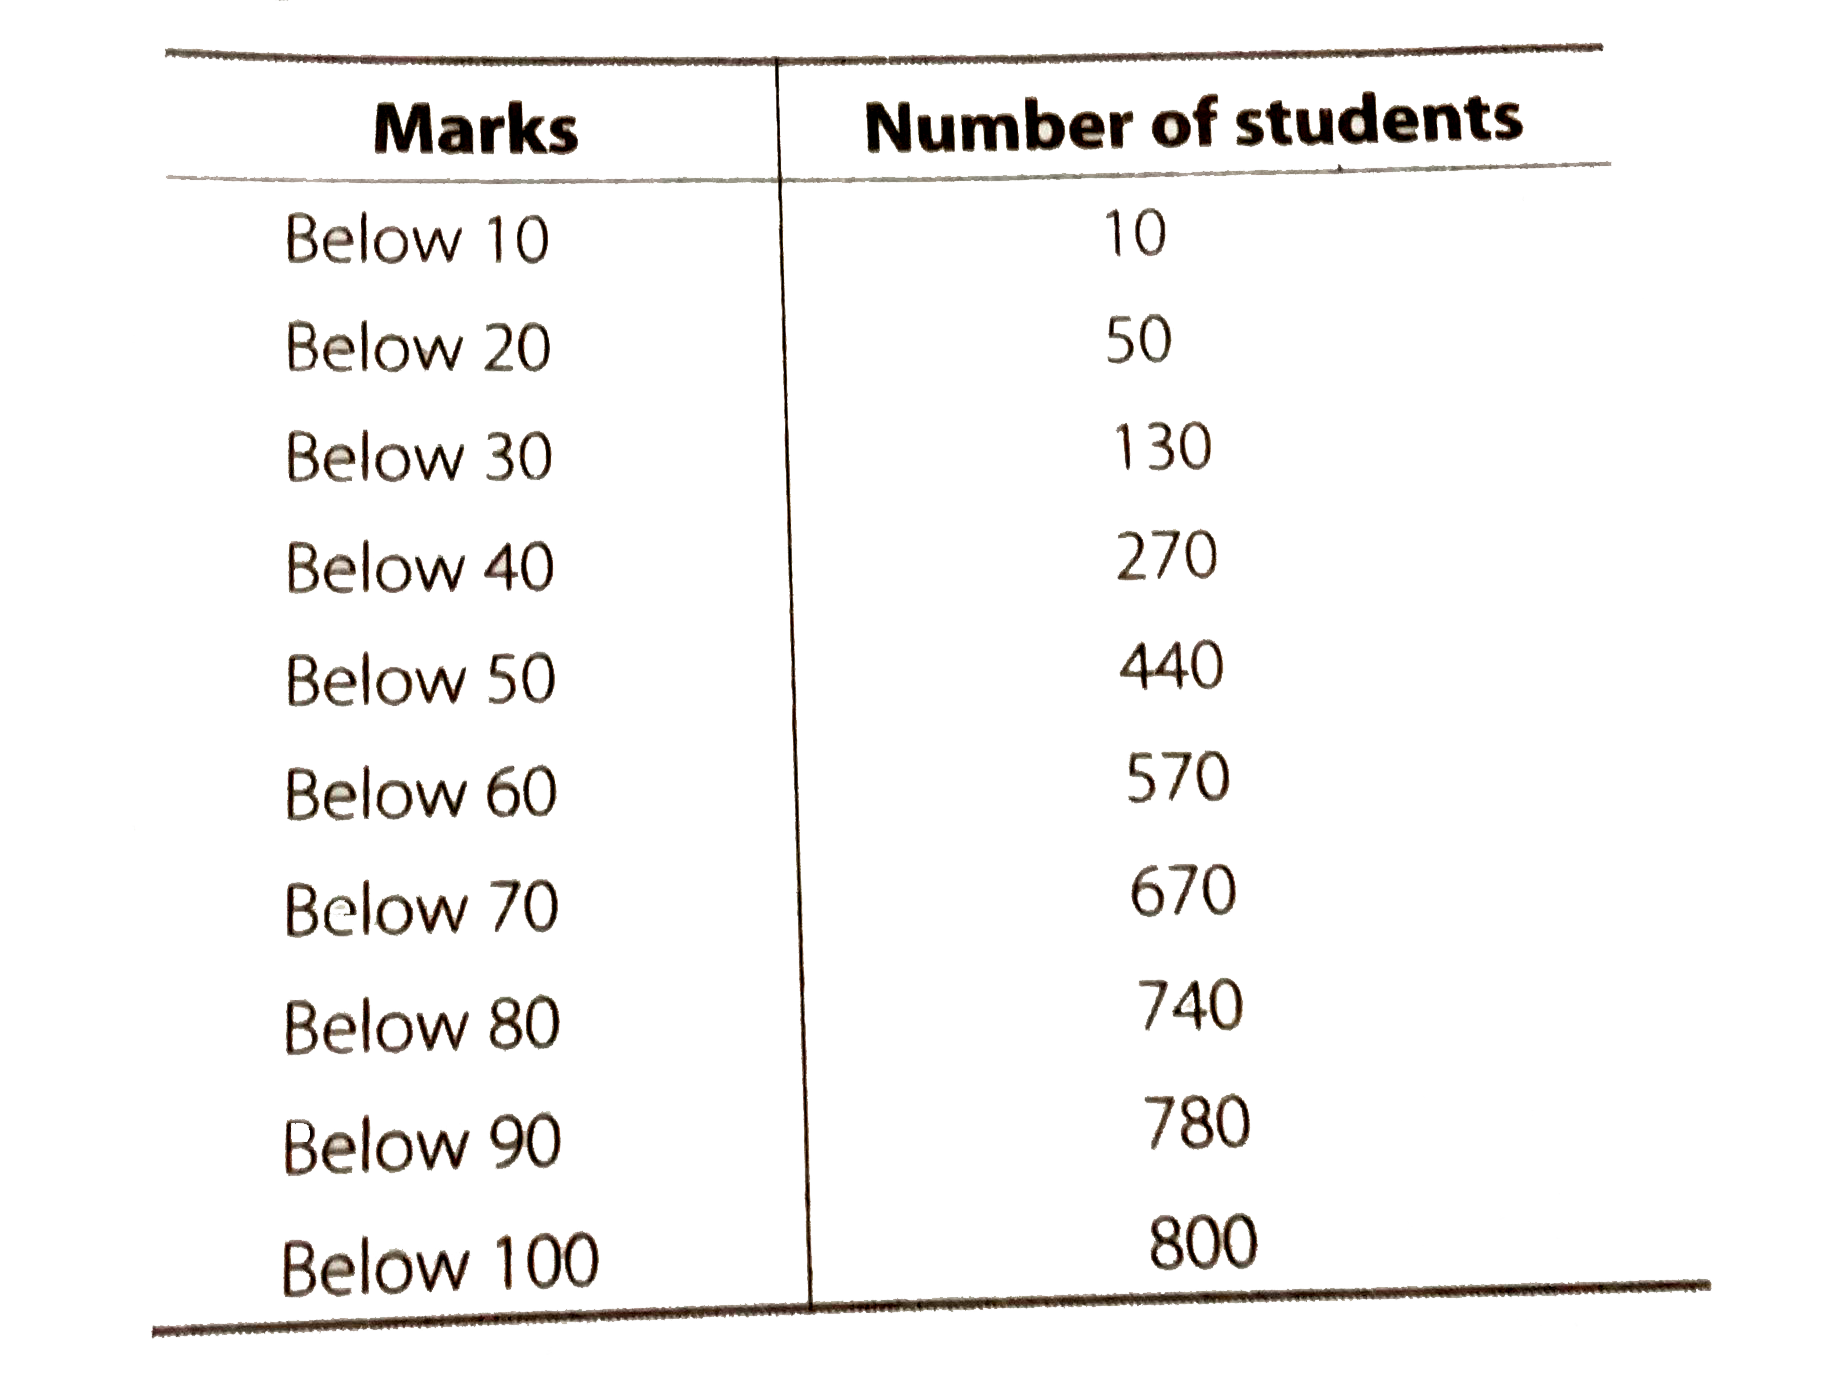
View SolutionThe following table show tha cumulative frequency distribution of marks of 800 students in an examination.

Construct a frequency distribution table for the data above.
View SolutionThe distribution of marks obtained by 30 students in a mathematics test is given in Table 1 of Example. Find the polymer of these data. Also compare and explain the polymer and mean.
View Solutionगणित की एक परीक्षा में विद्यार्थियों द्वारा प्राप्त किए गए अंकों का बंटन निम्न सारणी में दिया गया है । इन आँकड़ों का बहुलक ज्ञात कीजिए ।

View Solutionनीचे 30 विधार्थियों के गणित की एक परीक्षा में प्राप्त अंको का बंटन दिया गया है । आंकड़ों का बहुलक ज्ञात कीजिये ।

View SolutionIn a mathematics test given to 15 students, the following marks (out of 100) are recorded
41,39,48,52,46,62,54,40,96,52,98,40,42,52,60
Find the mean, median and mode of this data.
View SolutionThe following distribution table shows the marks scored by 140 students in an examination :

Calculate the mode of the distribution.
View Solutionఒక పాఠశాలలోని 10 వ తరగతికి చెందిన 30 మంది విద్యార్థులు గణితంలో పొందిన మార్కులు పట్టికలో ఇవ్వబడ్డాయి. విద్యార్థులు పొందిన మార్కులు సగటు కనుక్కోండి.

View SolutionThe marks distribution of 30 students in a mathematics examination are given in the adjacent table. Find the mode of this data. Also compare and interpret the mode and the mean .

View SolutionThe marks distribution of 30 students in a mathematics examination are given in the adjacent table. Find the mode of this data. Also compare and interpret the mode and the mean .

View SolutionThe marks distribution of 30 students m a mathematics examination are given in Table of Example 1. Find the mode of this data.
View Solution
