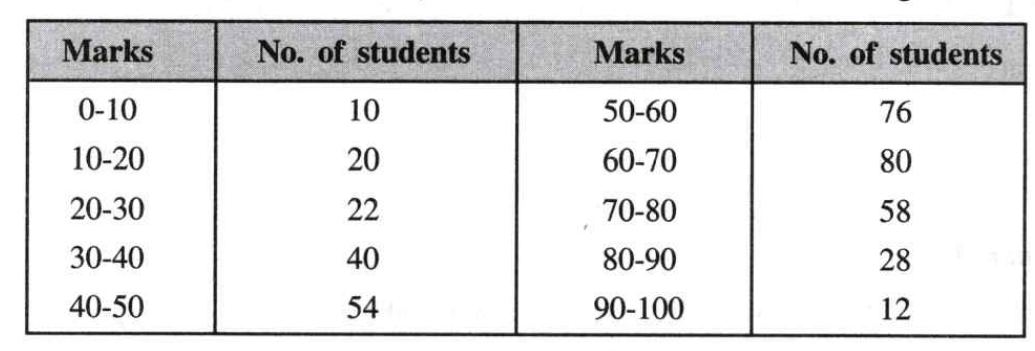
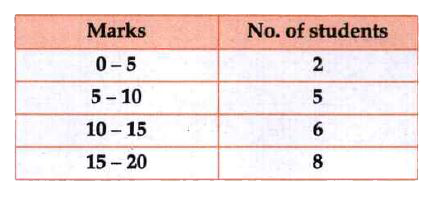
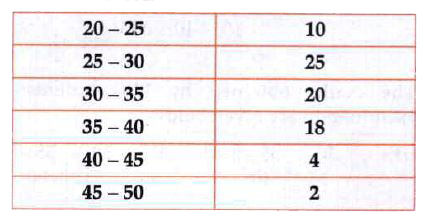
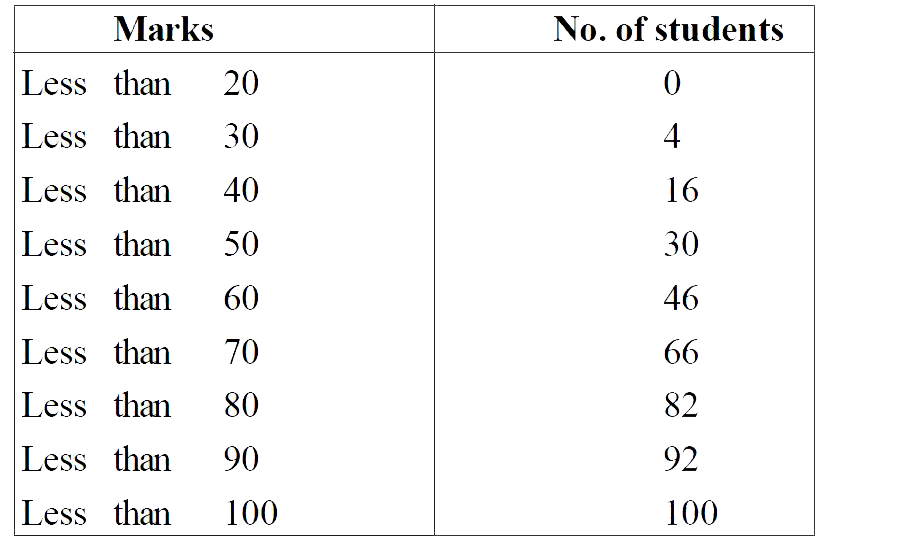
The marks obtained by 200 students in an examination are given below. : Draw a less than ogive for the above distribution and use less than ogive to find median.
The correct Answer is:57
Topper's Solved these Questions
- BOOK - NAGEEN PRAKASHANCHAPTER - STATISTICS EXERCISE - Revision Exercise Short Answer Questions5videos
STATISTICS
- BOOK - NAGEEN PRAKASHANCHAPTER - SOME APPLICATIONS OF TRIGONOMETRYEXERCISE - Long Answer Questions5videos
SOME APPLICATIONS OF TRIGONOMETRY
- BOOK - NAGEEN PRAKASHANCHAPTER - TRIANGLES EXERCISE - Revision Exercise Long Questions4videos
TRIANGLES
Similar Questions
The marks obtained (out of 100) by 400 students in an examination are given below:

Using a graph paper, draw an ogive for the above distribution. Use ogive to estimate the following: estimate the median.View SolutionThe marks obtained (out of 100) by 400 students in an examination are given below:

Using a graph paper, draw an ogive for the above distribution. Use ogive to estimate the following: estimate the number of students who obtained more than 80% marks in the examination.View SolutionThe marks obtained (out of 100) by 400 students in an examination are given below:

Using a graph paper, draw an ogive for the above distribution. Use ogive to estimate:
the number of students who did not pass if the pass percentage was 35.View SolutionMarks obtained by 200 students in an examination are given below :

Draw an ogive for the given distribution taking 2 cm = 10 marks on one axis and 2 cm = 20 students on the other axis. Using the graph, determine :
(i) The median marksView SolutionMarks obtained by 200 students in an examination are given below :

Draw an ogive for the given distribution taking 2 cm = 10 marks on one axis and 2 cm = 20 students on the other axis. Using the graph, determine :
(ii) The number of students who failed if minimum marks required to pass is 40.View SolutionThe marks obtained by 120 styudents in a test are given below :

Draw an ogive for the given distribution on a graph sheet
Use suitable scale for ogive to estiamte the following :
(i) The median.View SolutionThe marks obtained by 120 styudents in a test are given below :

Draw an ogive for the given distribution on a graph sheet
Use suitable scale for ogive to estiamte the following :
(i) The number of students who obtained more than 75% marks in the test.View SolutionThe marks obtained by 100 students of class is an examination are given below:


Draw 'a less than' type cumulative frequency curves (ogive). Hence, find median.View SolutionDraw a less than ogive for the following frequency distribution.
View SolutionDraw a 'less than' ogive of the following data
 View Solution

