The number of cricket bats sold by a shop durting a week are given below.

draw a pictograph
Step by step video & image solution for The number of cricket bats sold by a shop durting a week are given below. draw a pictograph by Maths experts to help you in doubts & scoring excellent marks in Class 6 exams.
Topper's Solved these Questions
Similar Questions
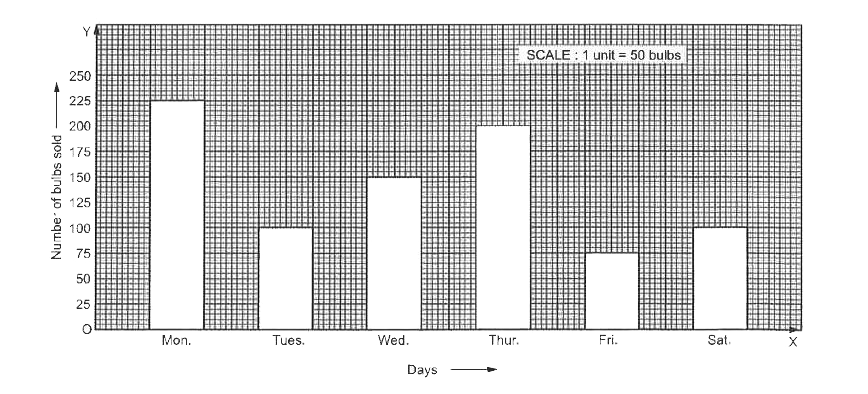
Given below is a graph showing the number of electric bulbs sold in a shop during a week
Read the bar graph carefully and answer the following questions
(i) On which day of the week was the sale minimum?
(ii) On which day of the week was the sale maximum
(iiI) What was the total sale during the week
(lv) What is the ratio between the minimum sale and the maximum sale
 View Solution
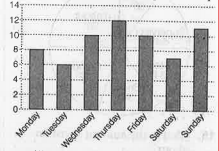
The number of bicycles sold by a shopkeeper in a particular week is shown below. How many bicycles were sold from Thursday to Sunday ? Options are (a)39 (b)38 (c)40 (d)36.
 View Solution
Knowledge Check
- Question 1 - Select One
Study the given information carefully and answer the questions that follow.
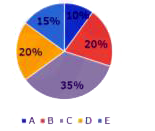
The given below graph shows the percentage distribution of the number of cakes baked by 5 shops (A, B, C, D and E) on a given day. Total number of cakes baked by the 5 shops were 400.
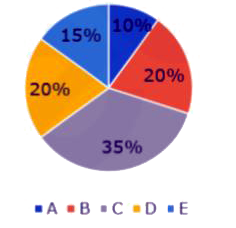
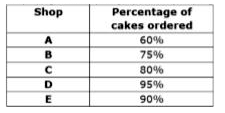
The given below table shows the percentage of cakes ordered from the five shops out of the baked cakes.
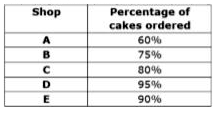
Note:
Number of cakes unsold = Number of cakes baked - Number of cakes ordered
All the ordered cakes are to be considered as cakes sold.
What is the ratio of the number of cakes baked by shop C and the number of cakes sold by shop B?A5:3B8:5C2:5D7:3 - Question 2 - Select One
Study the given information carefully and answer the questions that follow.
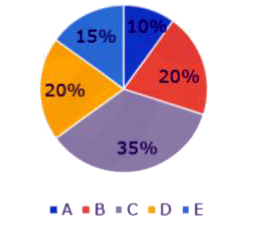
The given below graph shows the percentage distribution of the number of cakes baked by 5 shops (A, B, C, D and E) on a given day. Total number of cakes baked by the 5 shops were 400.
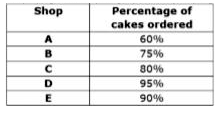
The given below table shows the percentage of cakes ordered from the five shops out of the baked cakes.
Note:
Number of cakes unsold = Number of cakes baked - Number of cakes ordered
All the ordered cakes are to be considered as cakes sold.
The number of cakes unsold from shop E is what percentage more than the number of cakes unsold from shop D?A20%B50%C33.33%D62.5% - Question 3 - Select One
Study the given information carefully and answer the questions that follow.
The given below graph shows the percentage distribution of the number of cakes baked by 5 shops (A, B, C, D and E) on a given day. Total number of cakes baked by the 5 shops were 400.
The given below table shows the percentage of cakes ordered from the five shops out of the baked cakes.
Note:
Number of cakes unsold = Number of cakes baked - Number of cakes ordered
All the ordered cakes are to be considered as cakes sold.
If the total number of cakes baked by all shops is distributed in a degree pie-chart, what would have been the central angle for shop C?A126∘B120∘C116∘D108∘
The pictograph shows the number of computers sold by a company during a week.
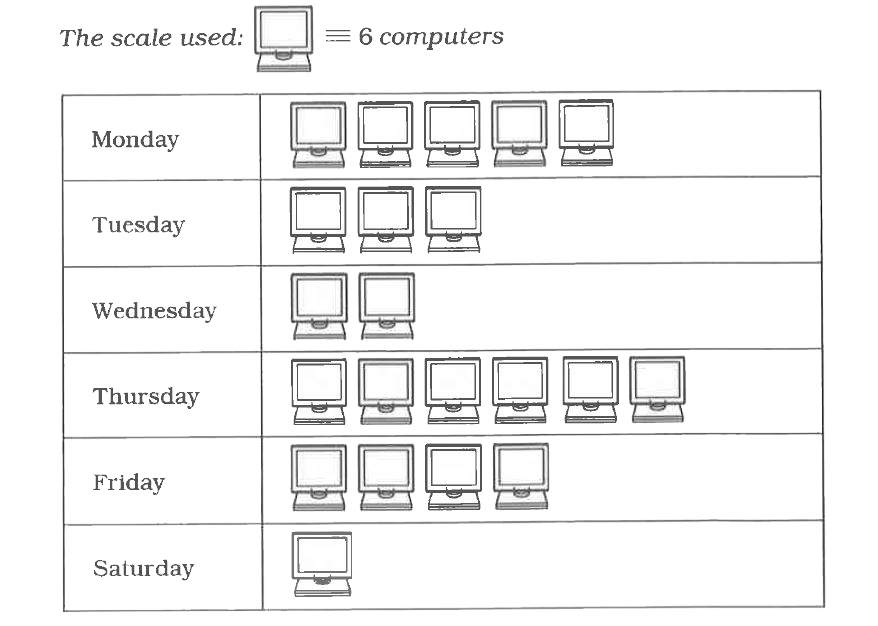
Look at the ptctograph and answer the question given bwlow.
How many computers were sold on Friday ?
How many computers were sold on Monday ?
How many computers were sold during the week ?
On which day was the sale maximum ?View SolutionHome appliances sold by a shop in one month are given as below:
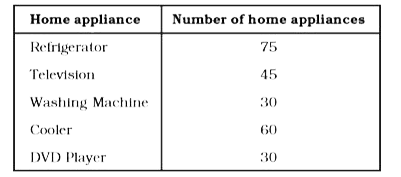
Draw a bar graph to represent the above information.View SolutionThe following table shows the number of toys sold by a mart during a week. Draw a line graph to represent the given data.
WeekMonTueWedThursFriSatSunNumber of Toys21101724101620View SolutionThe sale of electric bulbs on different days of week is shown below :
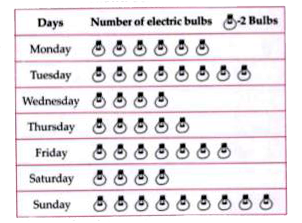
Observe the pictograph and answer the following questions :
On which day were the maximum number of bulbs sold ?View SolutionStudy the given information carefully and answer the questions that follow.
The given below graph shows the percentage distribution of the number of cakes baked by 5 shops (A, B, C, D and E) on a given day. Total number of cakes baked by the 5 shops were 400.
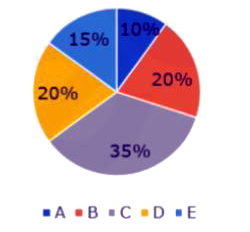
The given below table shows the percentage of cakes ordered from the five shops out of the baked cakes.
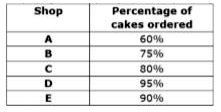
Note:
Number of cakes unsold = Number of cakes baked - Number of cakes ordered
All the ordered cakes are to be considered as cakes sold.
If the next day, number of cakes ordered increased by 20% for shop B, while the number of cakes baked by shop B remained the same, then the number of cakes unsold by Shop B is more than how many shops?View Solution
