The percentage of expenditure on different heads in a budget of a state is as shown below :

Draw a pie diagram to represent the information .
The correct Answer is:Measures of the central angles : .
Step by step video & image solution for The percentage of expenditure on different heads in a budget of a state is as shown below : Draw a pie diagram to represent the information . by Maths experts to help you in doubts & scoring excellent marks in Class 10 exams.
Topper's Solved these Questions
- BOOK - NAVNEET PUBLICATION - MAHARASHTRA BOARDCHAPTER - STATISTICSEXERCISE - Challenging Questions2videos
STATISTICS
- BOOK - NAVNEET PUBLICATION - MAHARASHTRA BOARDCHAPTER - SIMILARITYEXERCISE - SUBJECTIVE TYPE20videos
SIMILARITY
- BOOK - NAVNEET PUBLICATION - MAHARASHTRA BOARDCHAPTER - THEOREMS EXERCISE - CIRCLE15videos
THEOREMS
Similar Questions
The expenditure of a family of different heads in a month is given below

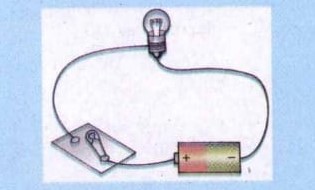
Draw a bar graph to represent the data above.View SolutionDraw the circuit diagram to represent the circuit shown below.
 View Solution
Percentage of the different products of a village in a particular district are given below. Draw a pie chart representing this information. Items, Wheat, Pulses, Jwar, Grounnuts, Vegetables, Total %, 1253 , 1256 , 252 , 503 , 503 , 100
View SolutionThe tatste of 500 people of a sociaety for different type of food was recorded as follows :

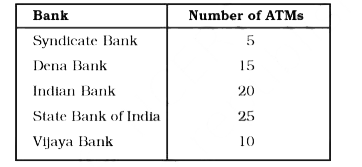
Draw a pie diagram to represent the above data.View SolutionThe number of ATMs of different banks in a city is shown below:

Draw a bar graph to represent the above information by choosing the scale of your choice.View SolutionThe marks obtained by a student in different subjects are shown. Draw a pie diagram showing the information.
 View Solution
The marks obtained by a student in defferent subjects are shown. Draw a pie diagram showing the information.
 View Solution
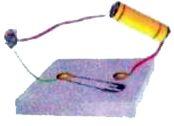
Draw the circuit diagram to represent the circuit shown infigure.
 View Solution
In a tree plantation programme, the number of trees planted by students of different classes is given in the following table. Draw a pie diagram showing the information.
 View Solution
In a tree plantation programme, the number of trees planted by students of different classes is given in the following table. Draw a pie diagram showing the information.
 View Solution

