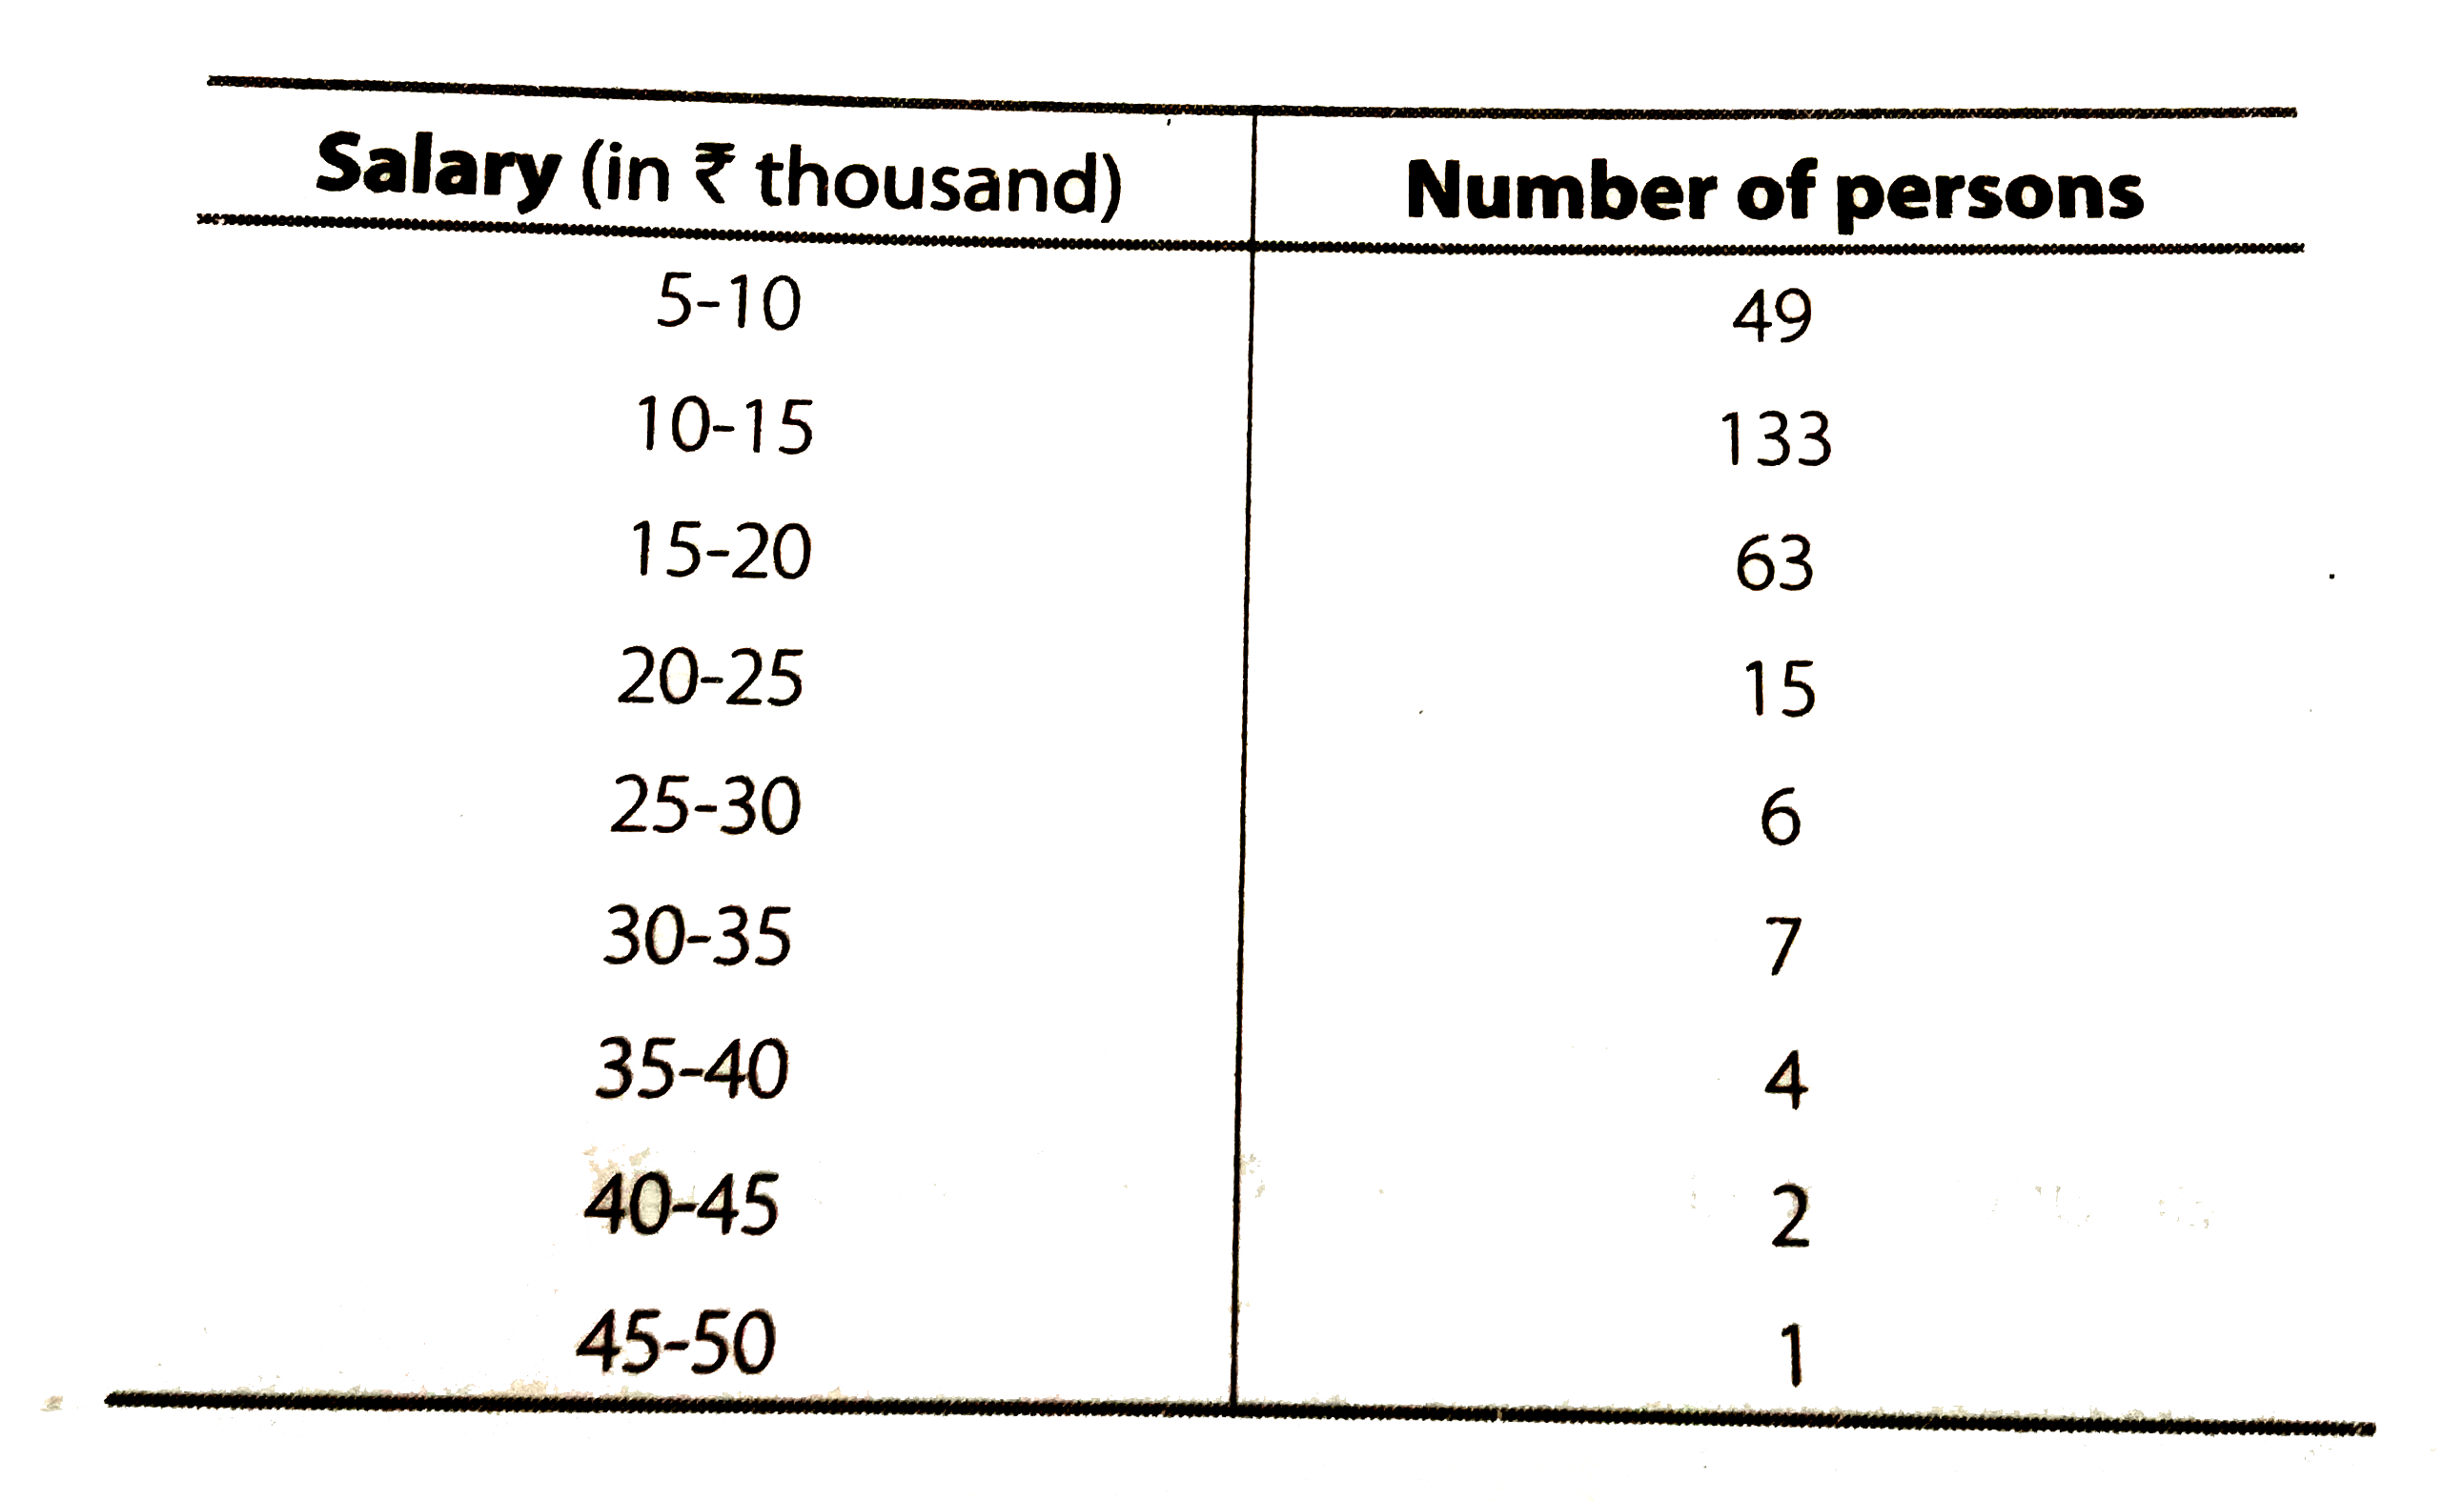
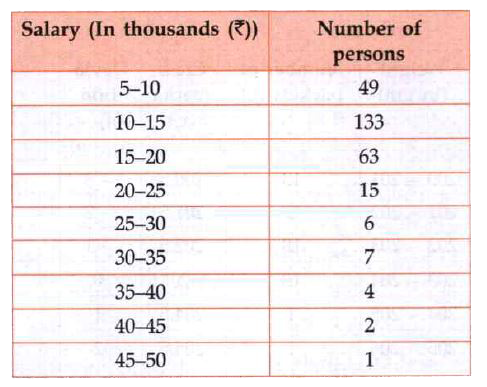
The table below shows the saleries of 280 persons.

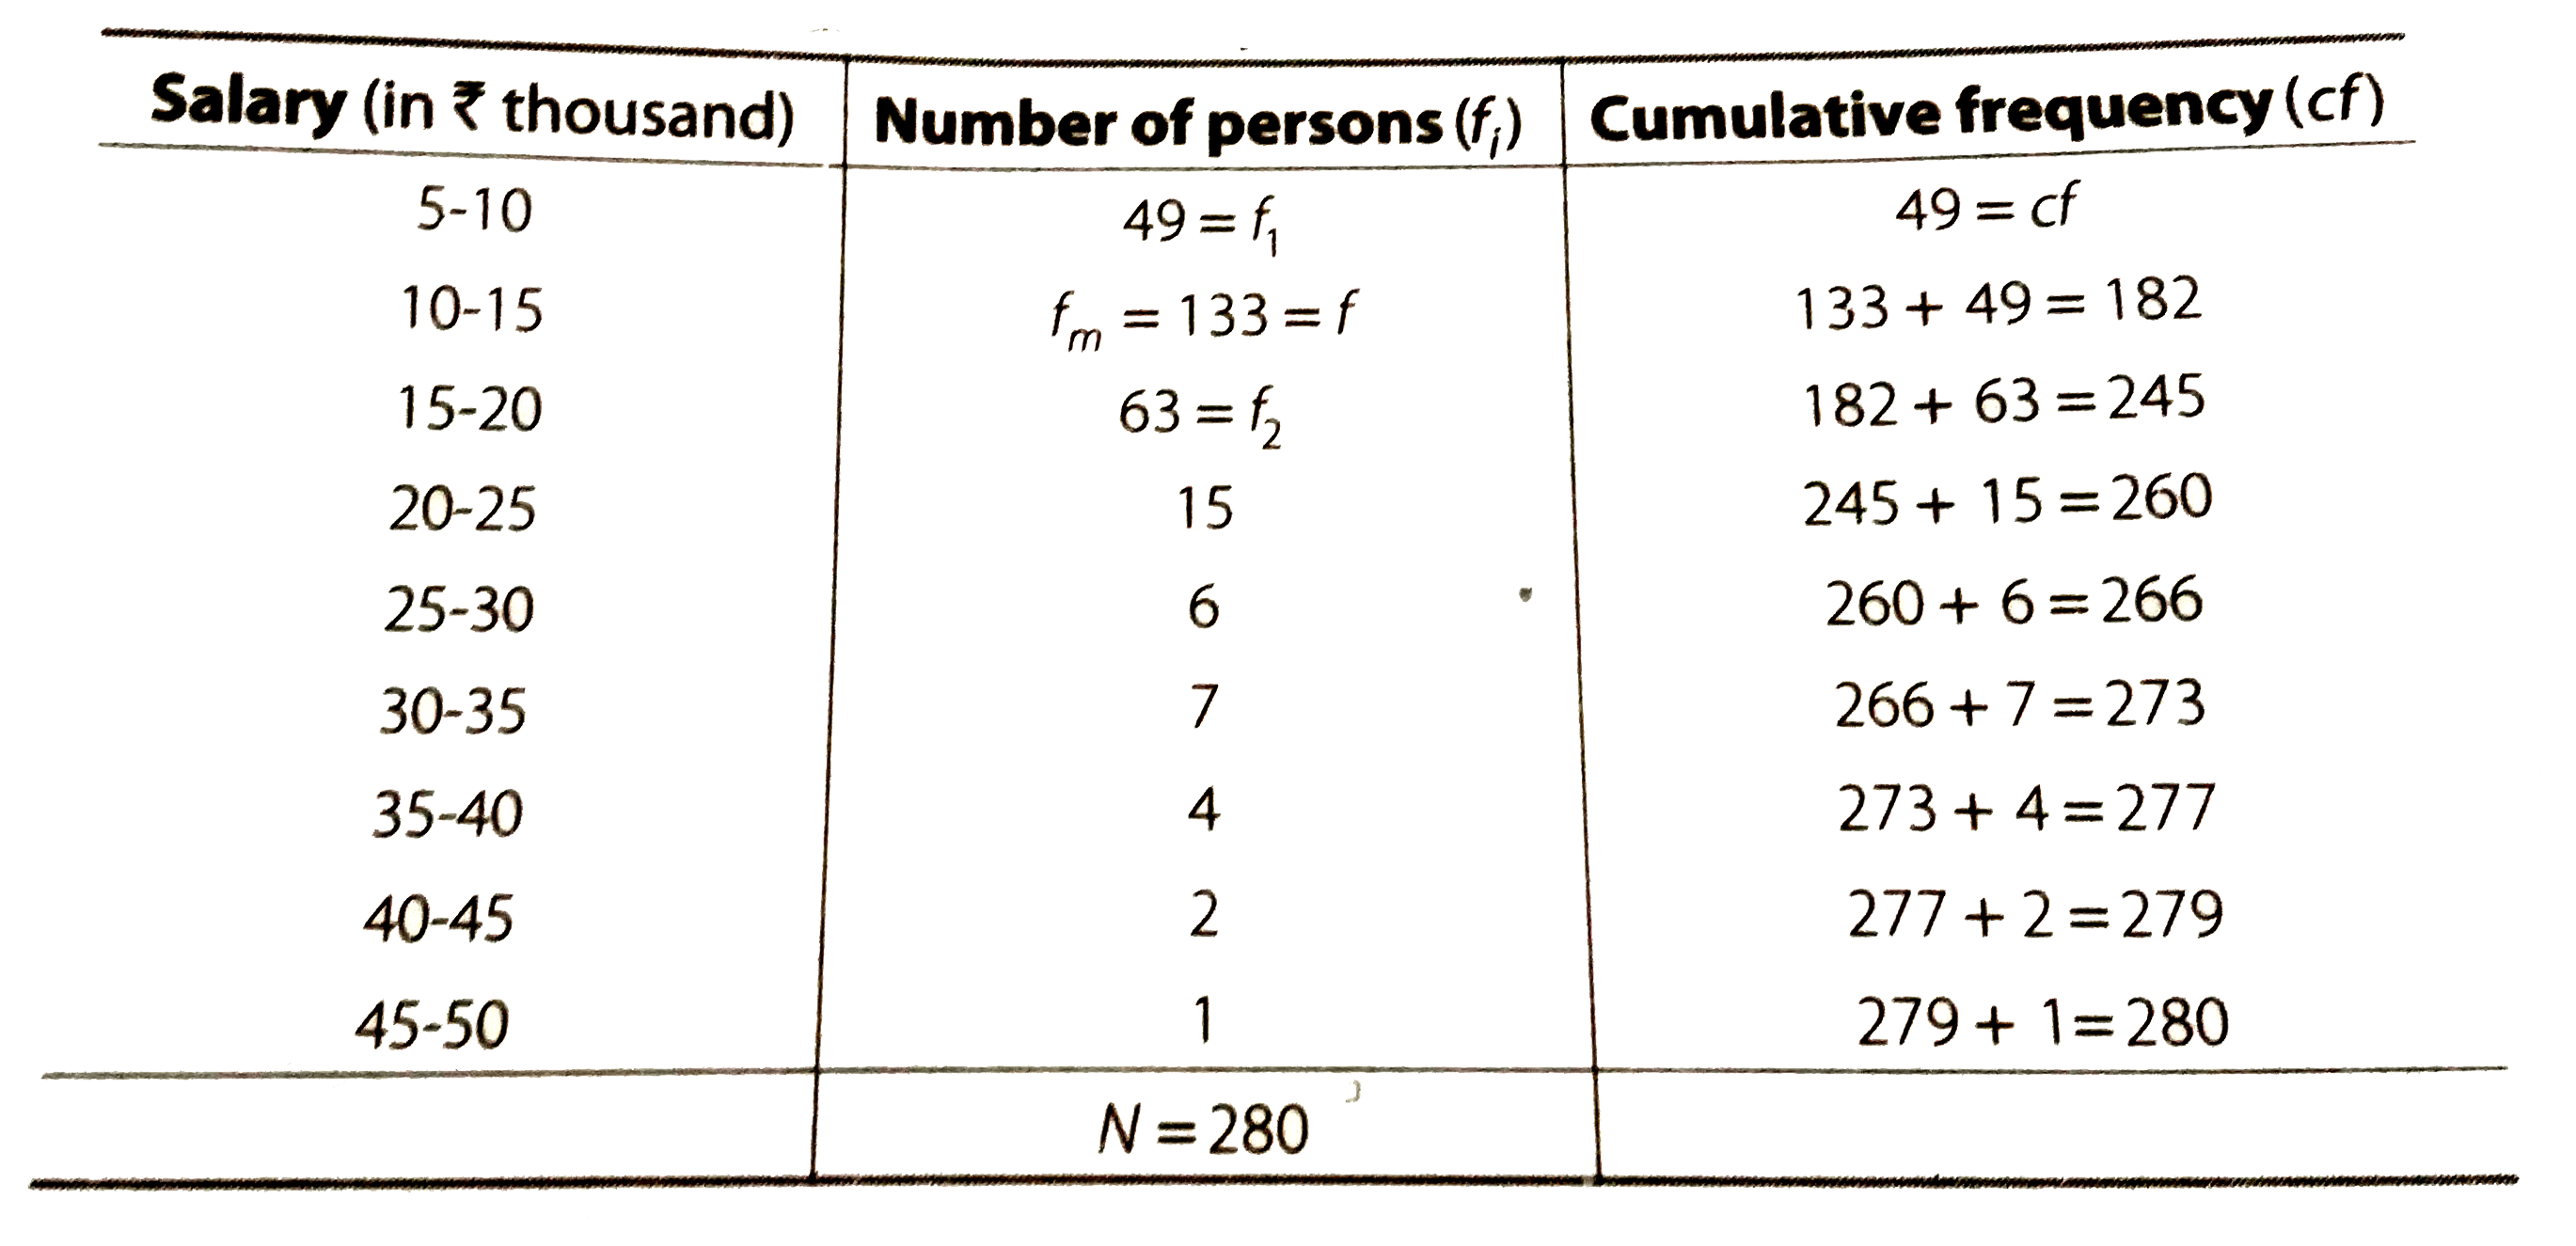
First, we construct a cumulative frequency table

∴N2=2802=140
(i) Here, median class is 10-15, because 140 lies in it.
Lower limit (l)=10, Frequency (f)=133.
Cumulative frequency(cf)=49 and class width (h)=5
∴Median=l+(N2−cf)f×h
=10+(140−49)133×5
=10+91×5133
=10+455133=10+3.421
=13.421×1000
=13421
(ii) Here, the highest frequency is 133, which lies 10-15, called class Lower, limit (l)=10 class width (h)=5,fm=133,f1=49andf2=63
∴Mode=l+(fm+f12fm−f1−f2)×h
=10+{133−492×133−49−63}×5
=10+84×5266−112=10+84×5154=10+2,727
=12,727(in thousand)
=12727×1000=12727
Hence, the meidan and modal salary are 13421 adn 12727 respectively,
Topper's Solved these Questions
- STATISTICS AND PROBABILITYBOOK - NCERT EXEMPLARCHAPTER - STATISTICS AND PROBABILITYEXERCISE - VERY SHORT ANSWERS QUESTIONS
2 Videos
- STATISTICS AND PROBABILITYBOOK - NCERT EXEMPLARCHAPTER - STATISTICS AND PROBABILITYEXERCISE - LONG ASWERS QUESTIONS
5 Videos
- REAL NUMBERSBOOK - NCERT EXEMPLARCHAPTER - REAL NUMBERSEXERCISE - Real Numbers
39 Videos
- SURFACE AREAS AND VOLUMESBOOK - NCERT EXEMPLARCHAPTER - SURFACE AREAS AND VOLUMESEXERCISE - Surface Areas And Volumes
62 Videos
Similar Questions
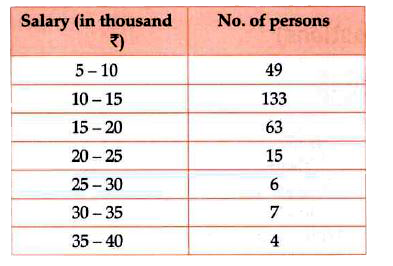
The table below shows the salaries of 280 persons:
View SolutionThe table below shows the salaries of 280 persons.
Calculate the median and mode of the data.

View SolutionThe table below show the salaries of 280 persons:
Calculate the median salary of the data.


View SolutionThe table below shows Salary of 280 persons. Calculate the median salary of the data.
View SolutionThe table below shows the yield of jowar per acre. Show the data by histogram.

View SolutionThe table below shows the yield of jowar per acre.Show the data by hiostogram

View SolutionThe table below show the yield of jowar per acre. Show the data by histogram .

View SolutionThe table below shows the admission and transfer in standars 1-3 of a school

IN the given table in standard 1 how many students were there at the end of year 2016
View SolutionThe table below shows the admission and transfer in standars 1-3 of a school

IN the given table what was the difference between admission and transfer in standard 3 in year 2016
View SolutionThe table below shows the admission and transfer in standards 1-3 of a school.

In the given table, in Standard 1, how many students were there at the end of year 2016?
View Solution
