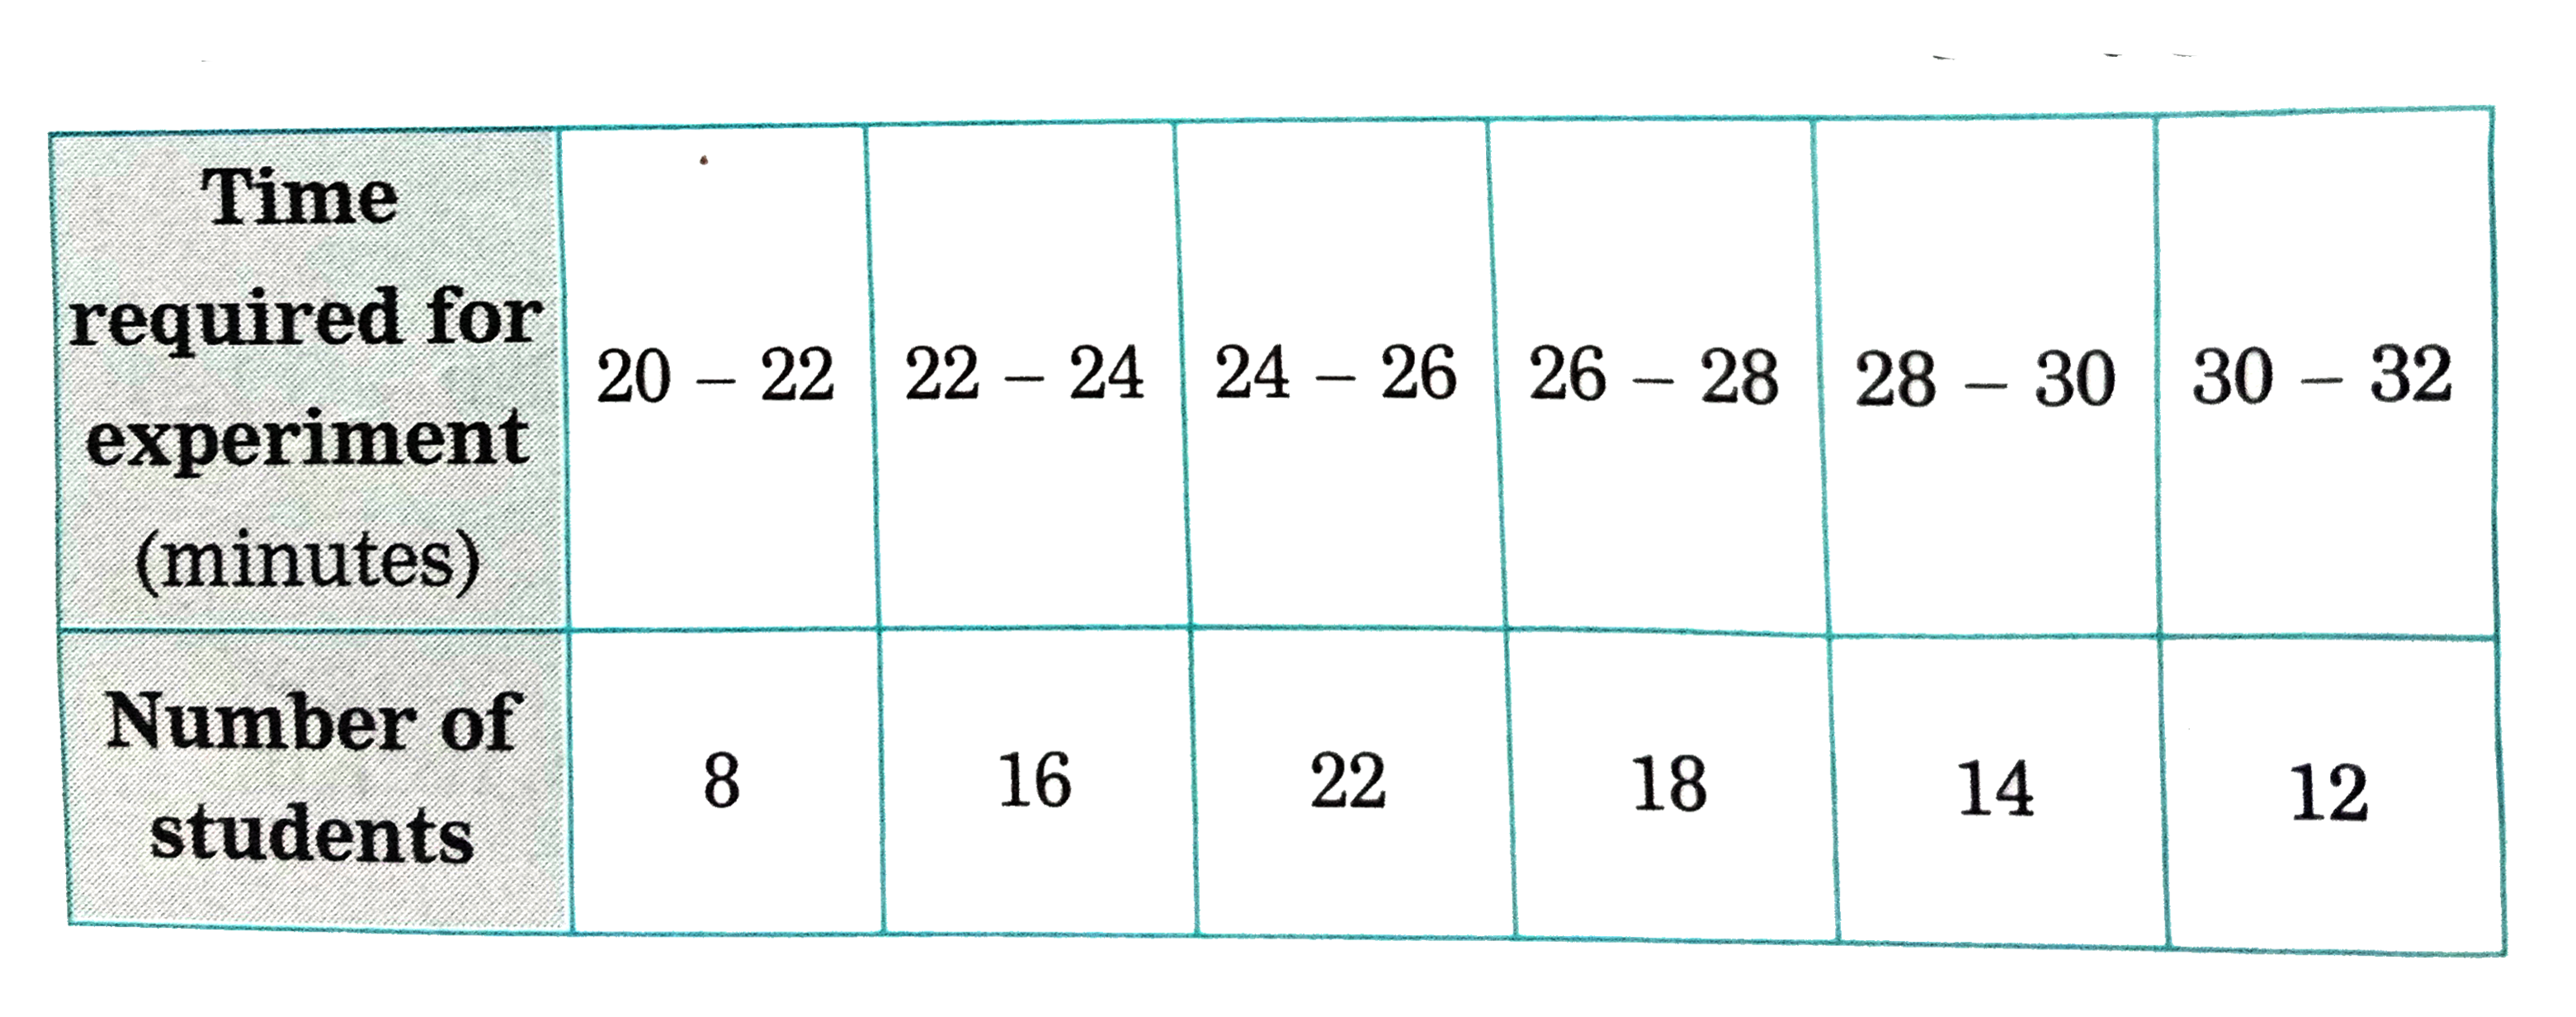
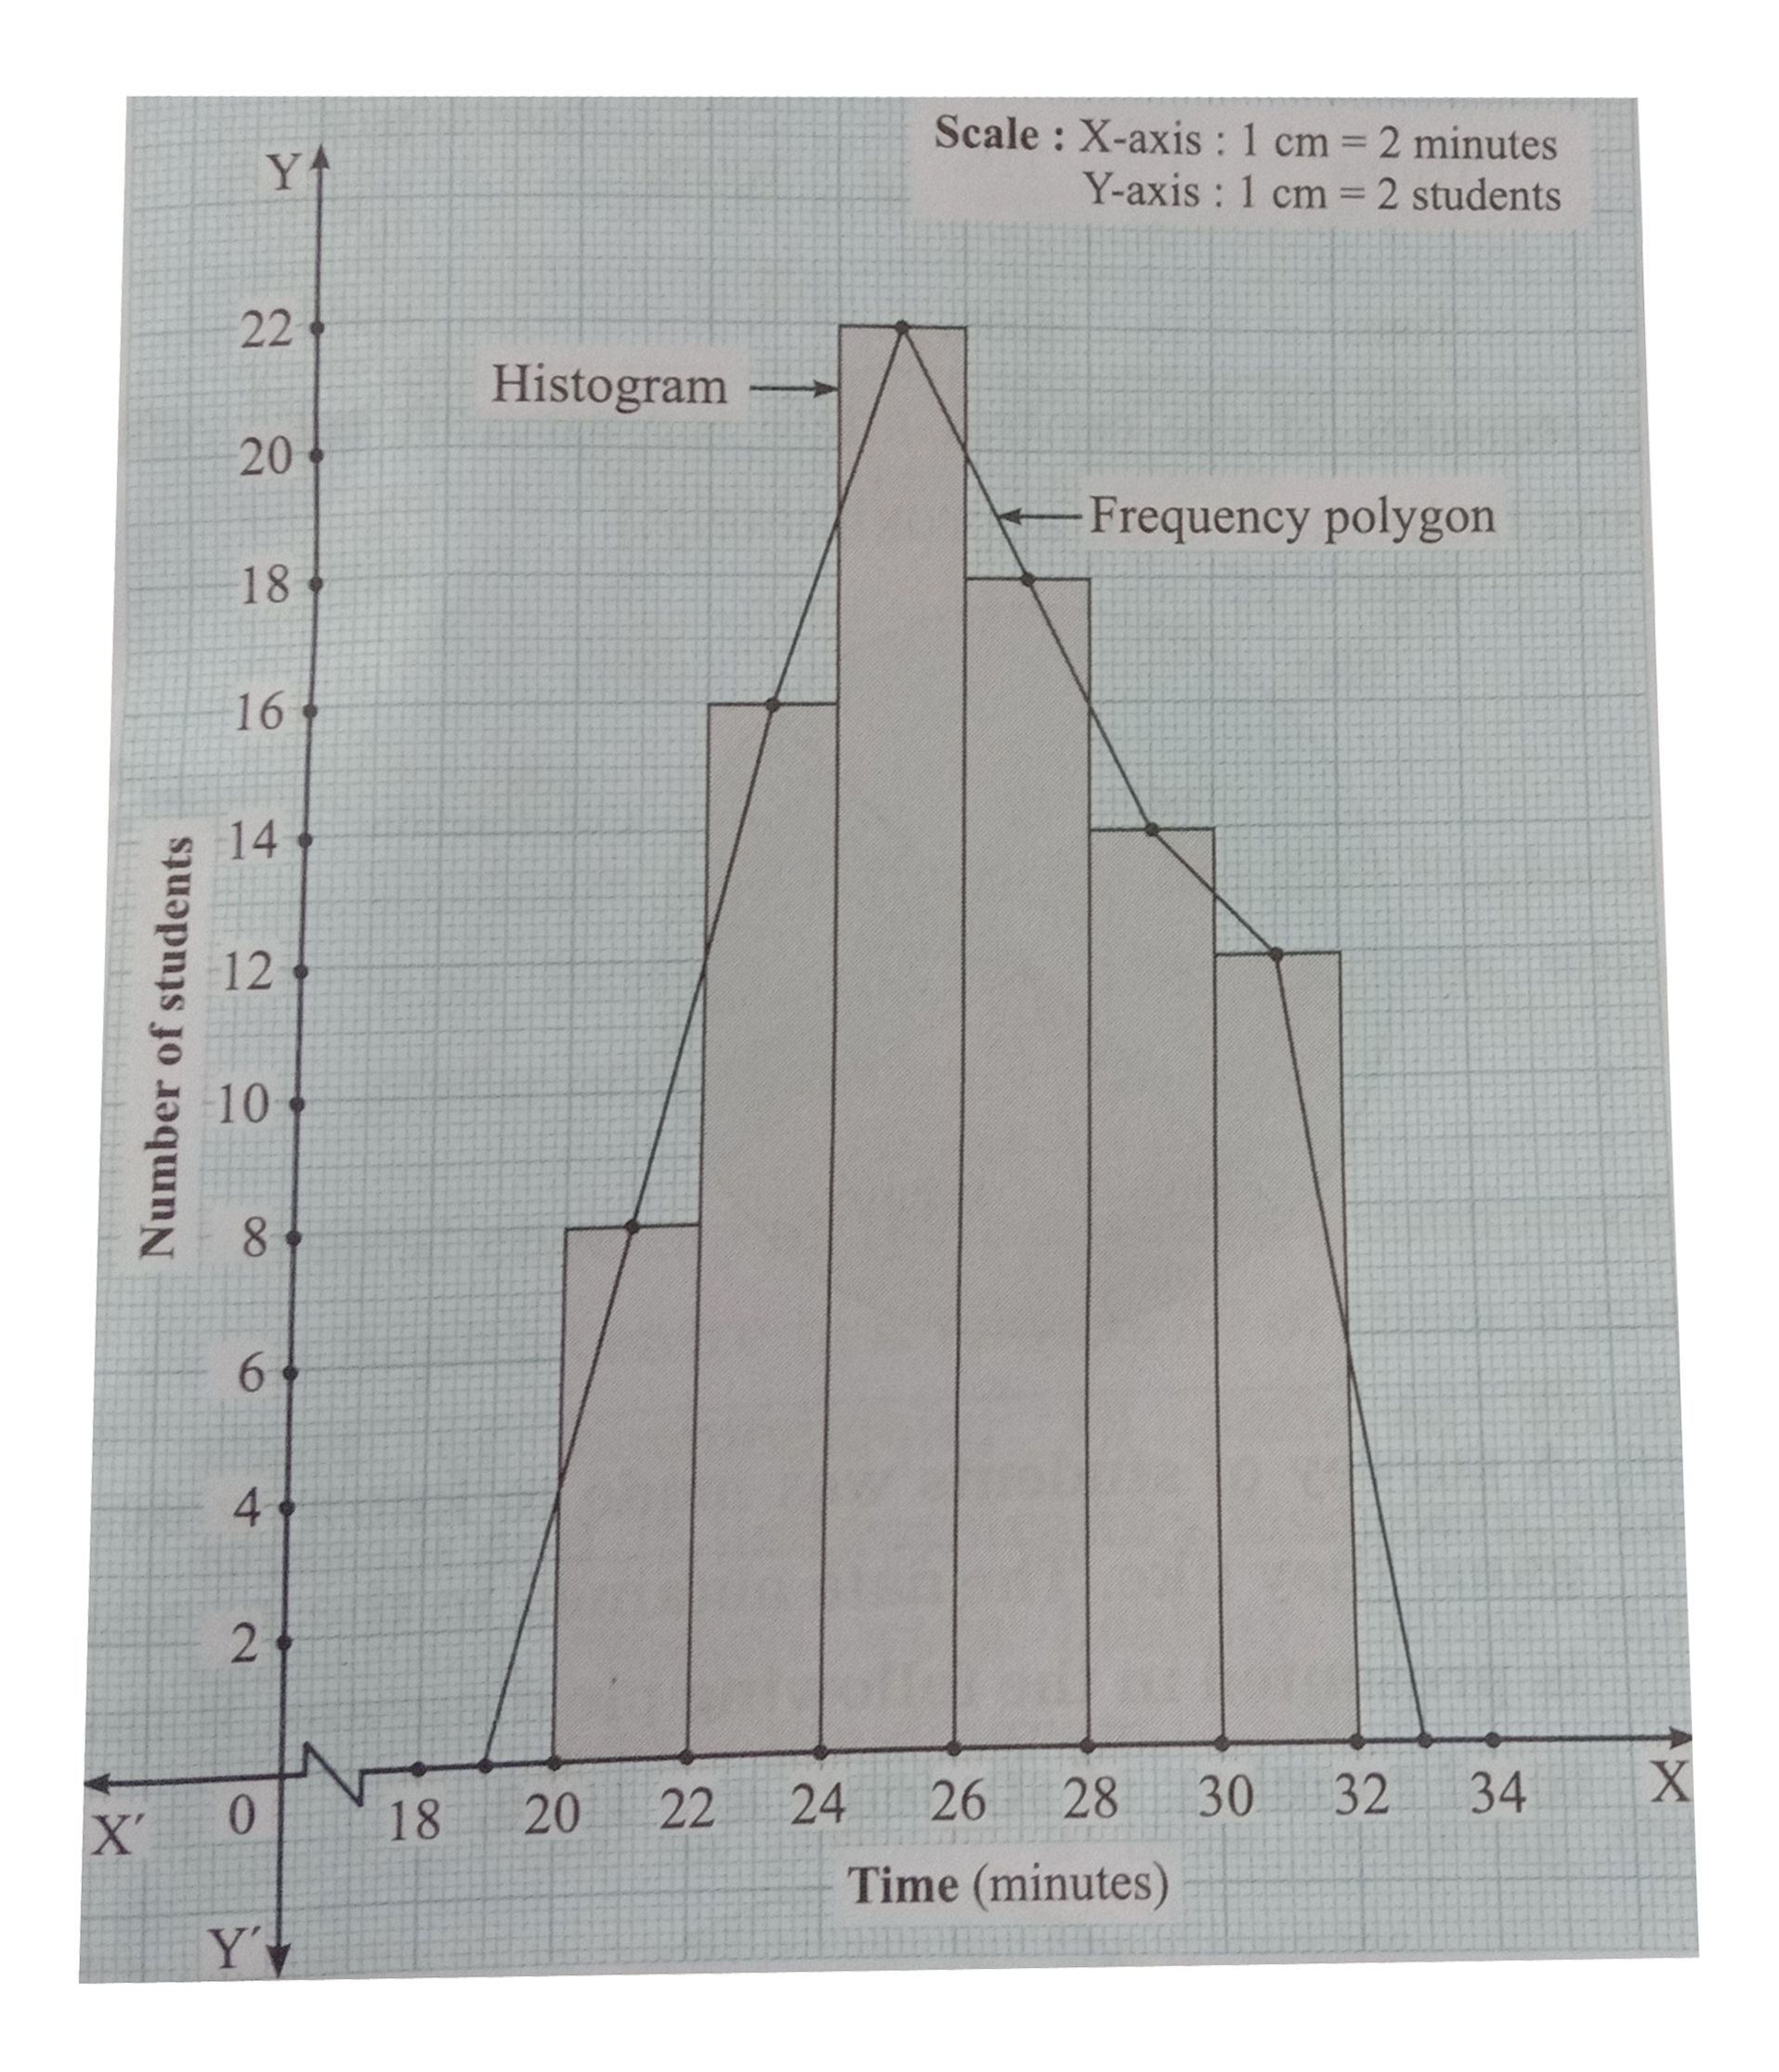
The time required for students to do a science experiment and the number of students is shown in the following grouped frequency distribution table. Show information by a histogram and also by a frequency polygon.

For drawing a frequency polygon, we take two additional classes.
18−20 with frequency zero and 32−34 with frequency zero.

Topper's Solved these Questions
- STATISTICSBOOK - NAVNEET PUBLICATION - MAHARASHTRA BOARDCHAPTER - STATISTICSEXERCISE - PRACTICE SET 6.1
6 Videos
- STATISTICSBOOK - NAVNEET PUBLICATION - MAHARASHTRA BOARDCHAPTER - STATISTICSEXERCISE - PRACTICE SET 6.2
4 Videos
- STATISTICSBOOK - NAVNEET PUBLICATION - MAHARASHTRA BOARDCHAPTER - STATISTICSEXERCISE - EXAMPLES
3 Videos
- SIMILARITYBOOK - NAVNEET PUBLICATION - MAHARASHTRA BOARDCHAPTER - SIMILARITYEXERCISE - SUBJECTIVE TYPE
20 Videos
- THEOREMS BOOK - NAVNEET PUBLICATION - MAHARASHTRA BOARDCHAPTER - THEOREMS EXERCISE - CIRCLE
15 Videos
Similar Questions
The time required for some students to complete a science experiment and the number of students is shown in the following grouped frequency distribution table. Draw the frequency polygon with the help of histogram using given information :
Time required for experiment ( minutes)20−2222−2424−2626−2828−3030−32Number of students61420161210
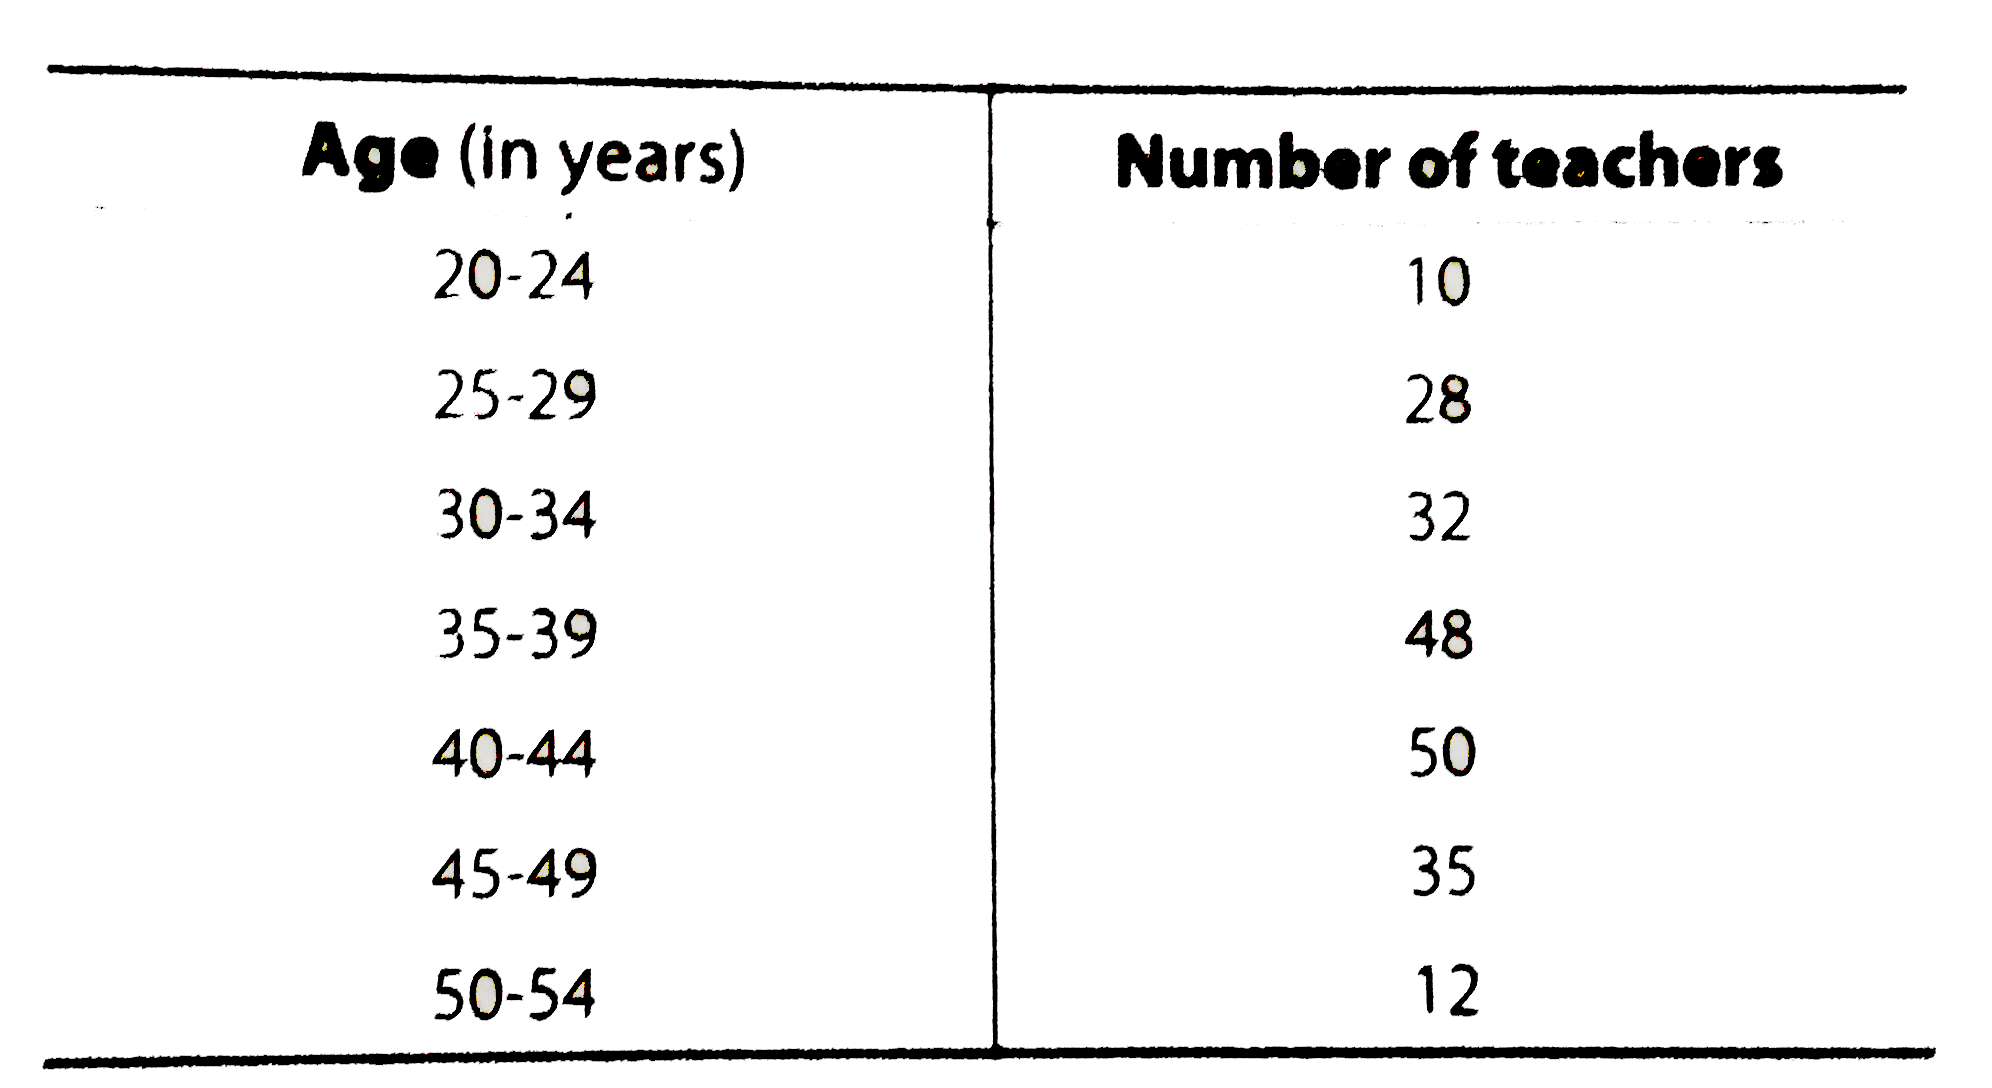
View SolutionDraw a frequency polygon for the following grouped frequency distribution table :

View SolutionDraw a frequency polygon for the following grouped frequency distrbution table.

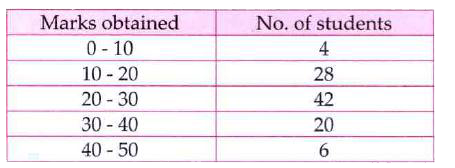
View SolutionDraw a histogram to represent the following grouped frequency distribution.

View SolutionPercentage of marks of 35 students is given in the following grouped frequency distribution table.

Which class has highest frequency?
View SolutionPercentage of marks of 35 students is given in the following grouped frequency distribution table.

How many students scored less than 90% of marks?
View SolutionPercentage of marks of 35 students is given in the following grouped frequency distribution table.

How many students scored 70% and more than 70% of marks?
View SolutionThe marks of students of a class are given in following frequency distribution. Find the mean.

View SolutionThe following is a frequency distribution of marks:

If a and b are equal, find their values. Draw a histogram and a frequency polygon.
View SolutionLet us now consider the following frequency distribution table which gives the weights of 38 students of a class:
View Solution
