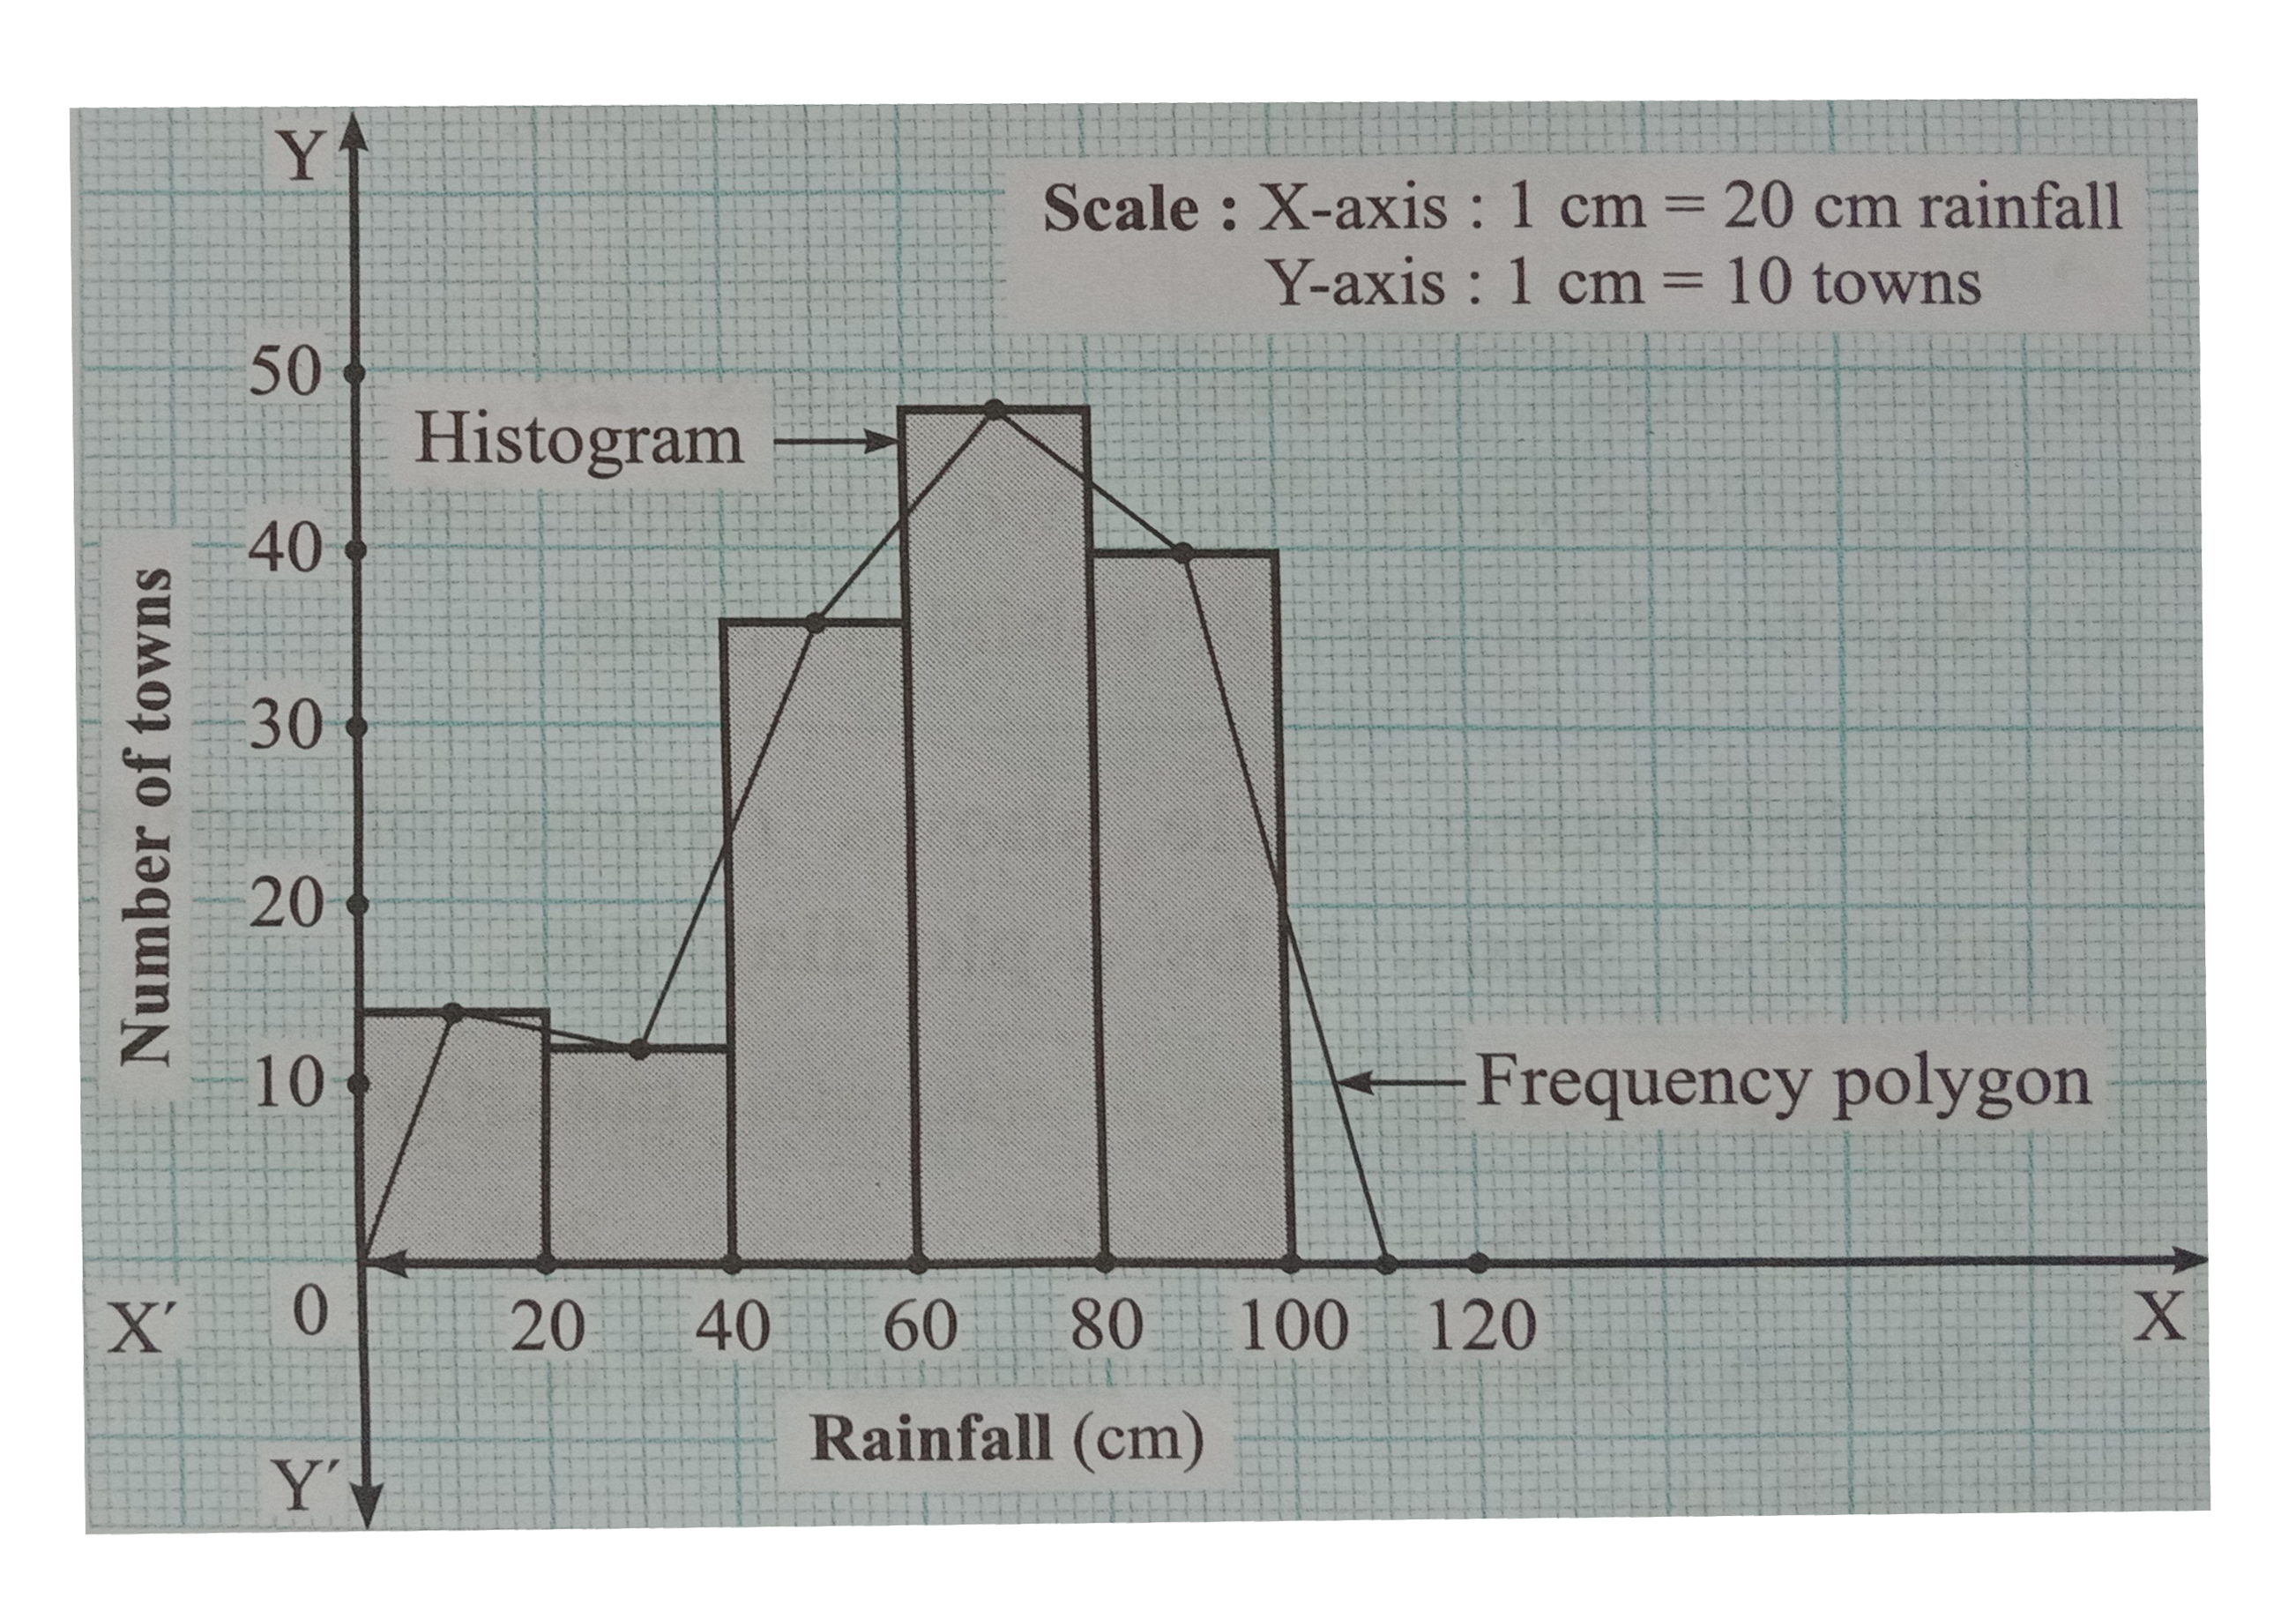
The following table shows the average rainfall in 150 towns. Towns. Show the information by a ferquency polygon.

For drawing polygon, we take two additional classes. We cannot take a class preceding 0−20, because it will be negative.
The rainfall can be but never negative. The class succeeding the last class is 100−120 with frequency zero.

Topper's Solved these Questions
- BOOK - NAVNEET PUBLICATION - MAHARASHTRA BOARDCHAPTER - STATISTICSEXERCISE - PRACTICE SET 6.16videos
STATISTICS
- BOOK - NAVNEET PUBLICATION - MAHARASHTRA BOARDCHAPTER - STATISTICSEXERCISE - PRACTICE SET 6.24videos
STATISTICS
- BOOK - NAVNEET PUBLICATION - MAHARASHTRA BOARDCHAPTER - STATISTICSEXERCISE - EXAMPLES3videos
STATISTICS
- BOOK - NAVNEET PUBLICATION - MAHARASHTRA BOARDCHAPTER - SIMILARITYEXERCISE - SUBJECTIVE TYPE20videos
SIMILARITY
- BOOK - NAVNEET PUBLICATION - MAHARASHTRA BOARDCHAPTER - THEOREMS EXERCISE - CIRCLE15videos
THEOREMS
Similar Questions
Show the following data by a frequency polygon.
 View Solution
Show the following data by a frequency polygon.
 View Solution
The following table shows the investment made by some families. Shows the information by a histogram.
 View Solution
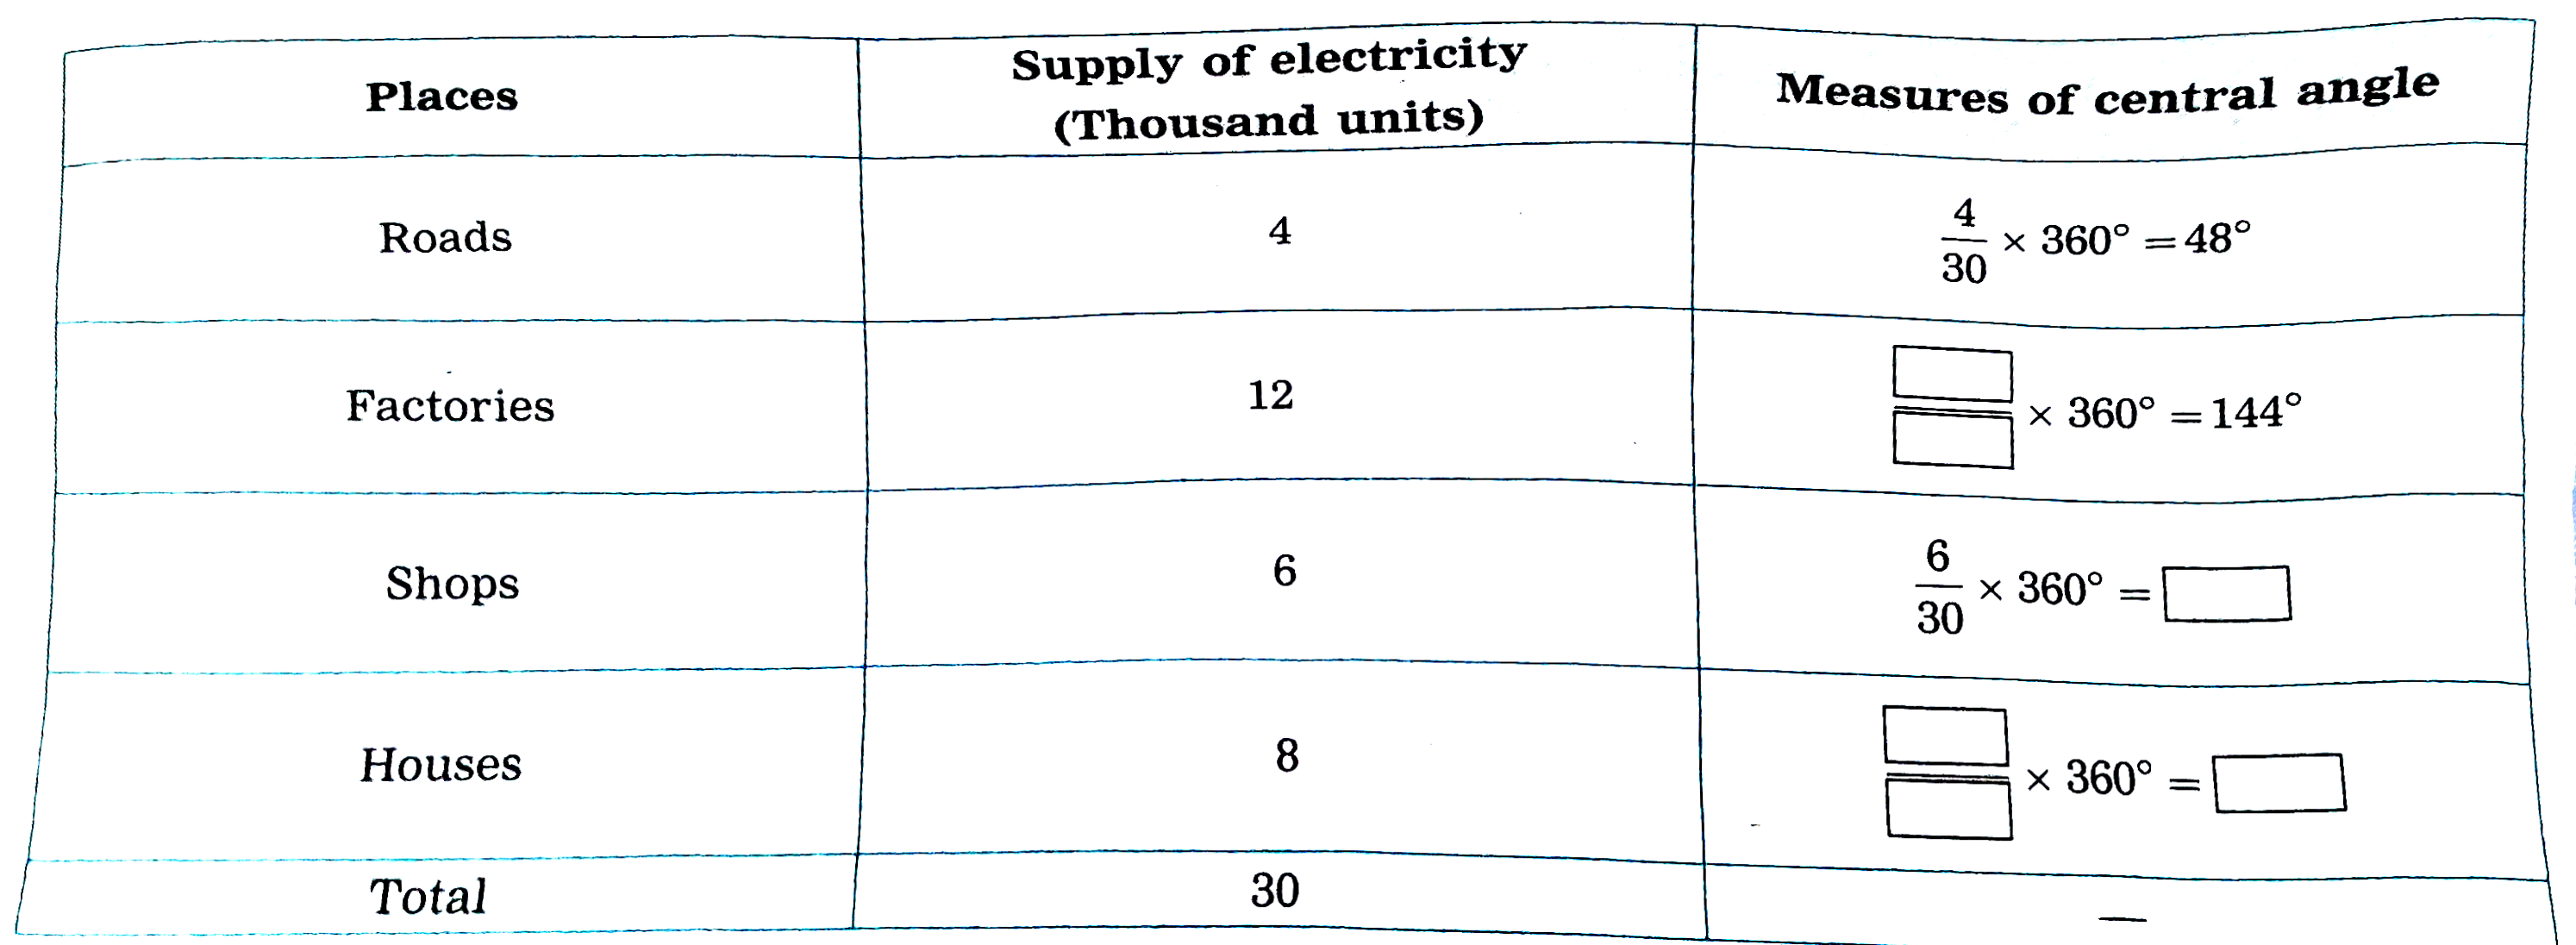
The following table shows the daily supply of electricity to different places in a town. Show the information by a pie diagram.
 View Solution
The following table shows the daily supply of electricity to different places in a town. To show the information by a pie diagram measure of central angles of sectors are to be decided. Complete the following activity to find the measures:
 View Solution
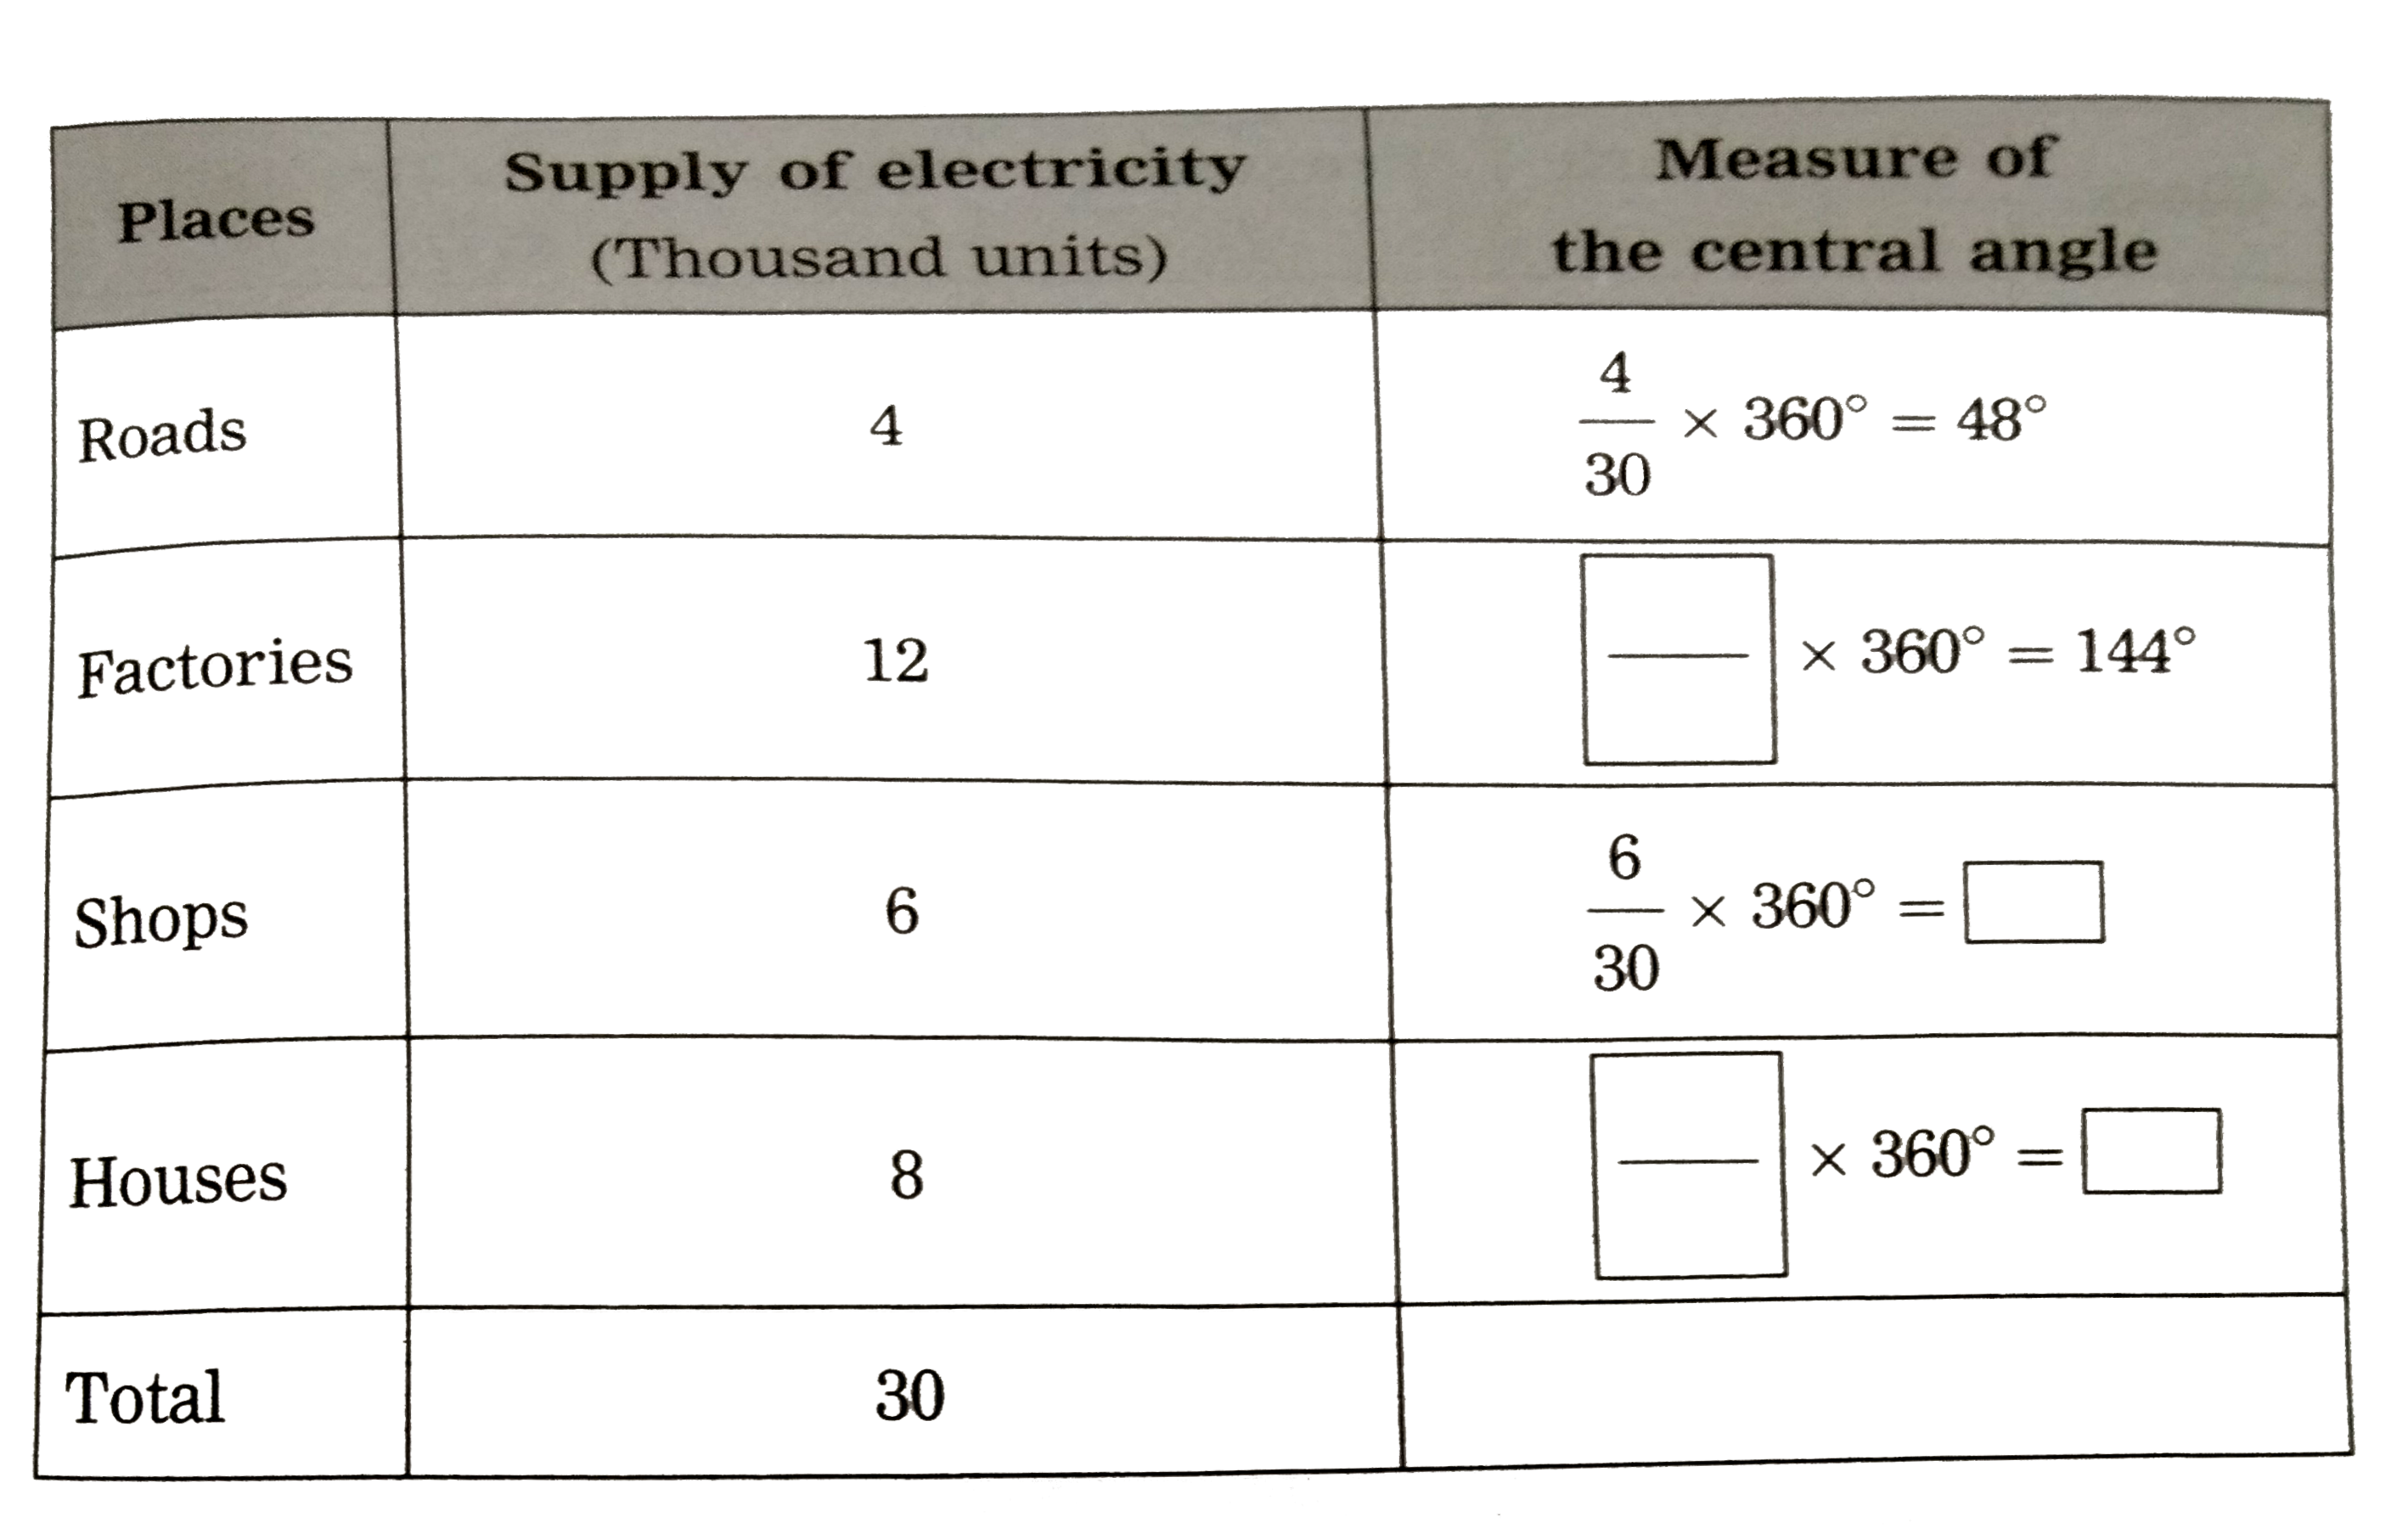
The following table shows the daily supply of electricity to differenet places in a town. To show the information by a pie diagram, measures of central angles of sectors are to be decided. Complete the following activity to find the measures.
 View Solution
The following table shows the weights of children and the number of children. Draw a frequency polygon showing the information.
 View Solution
The following table is based on the marks of the first term examination of 10 th class student. Show the information by a histogram. Also, draw a frequency polygon with the help of the histogram:
 View Solution
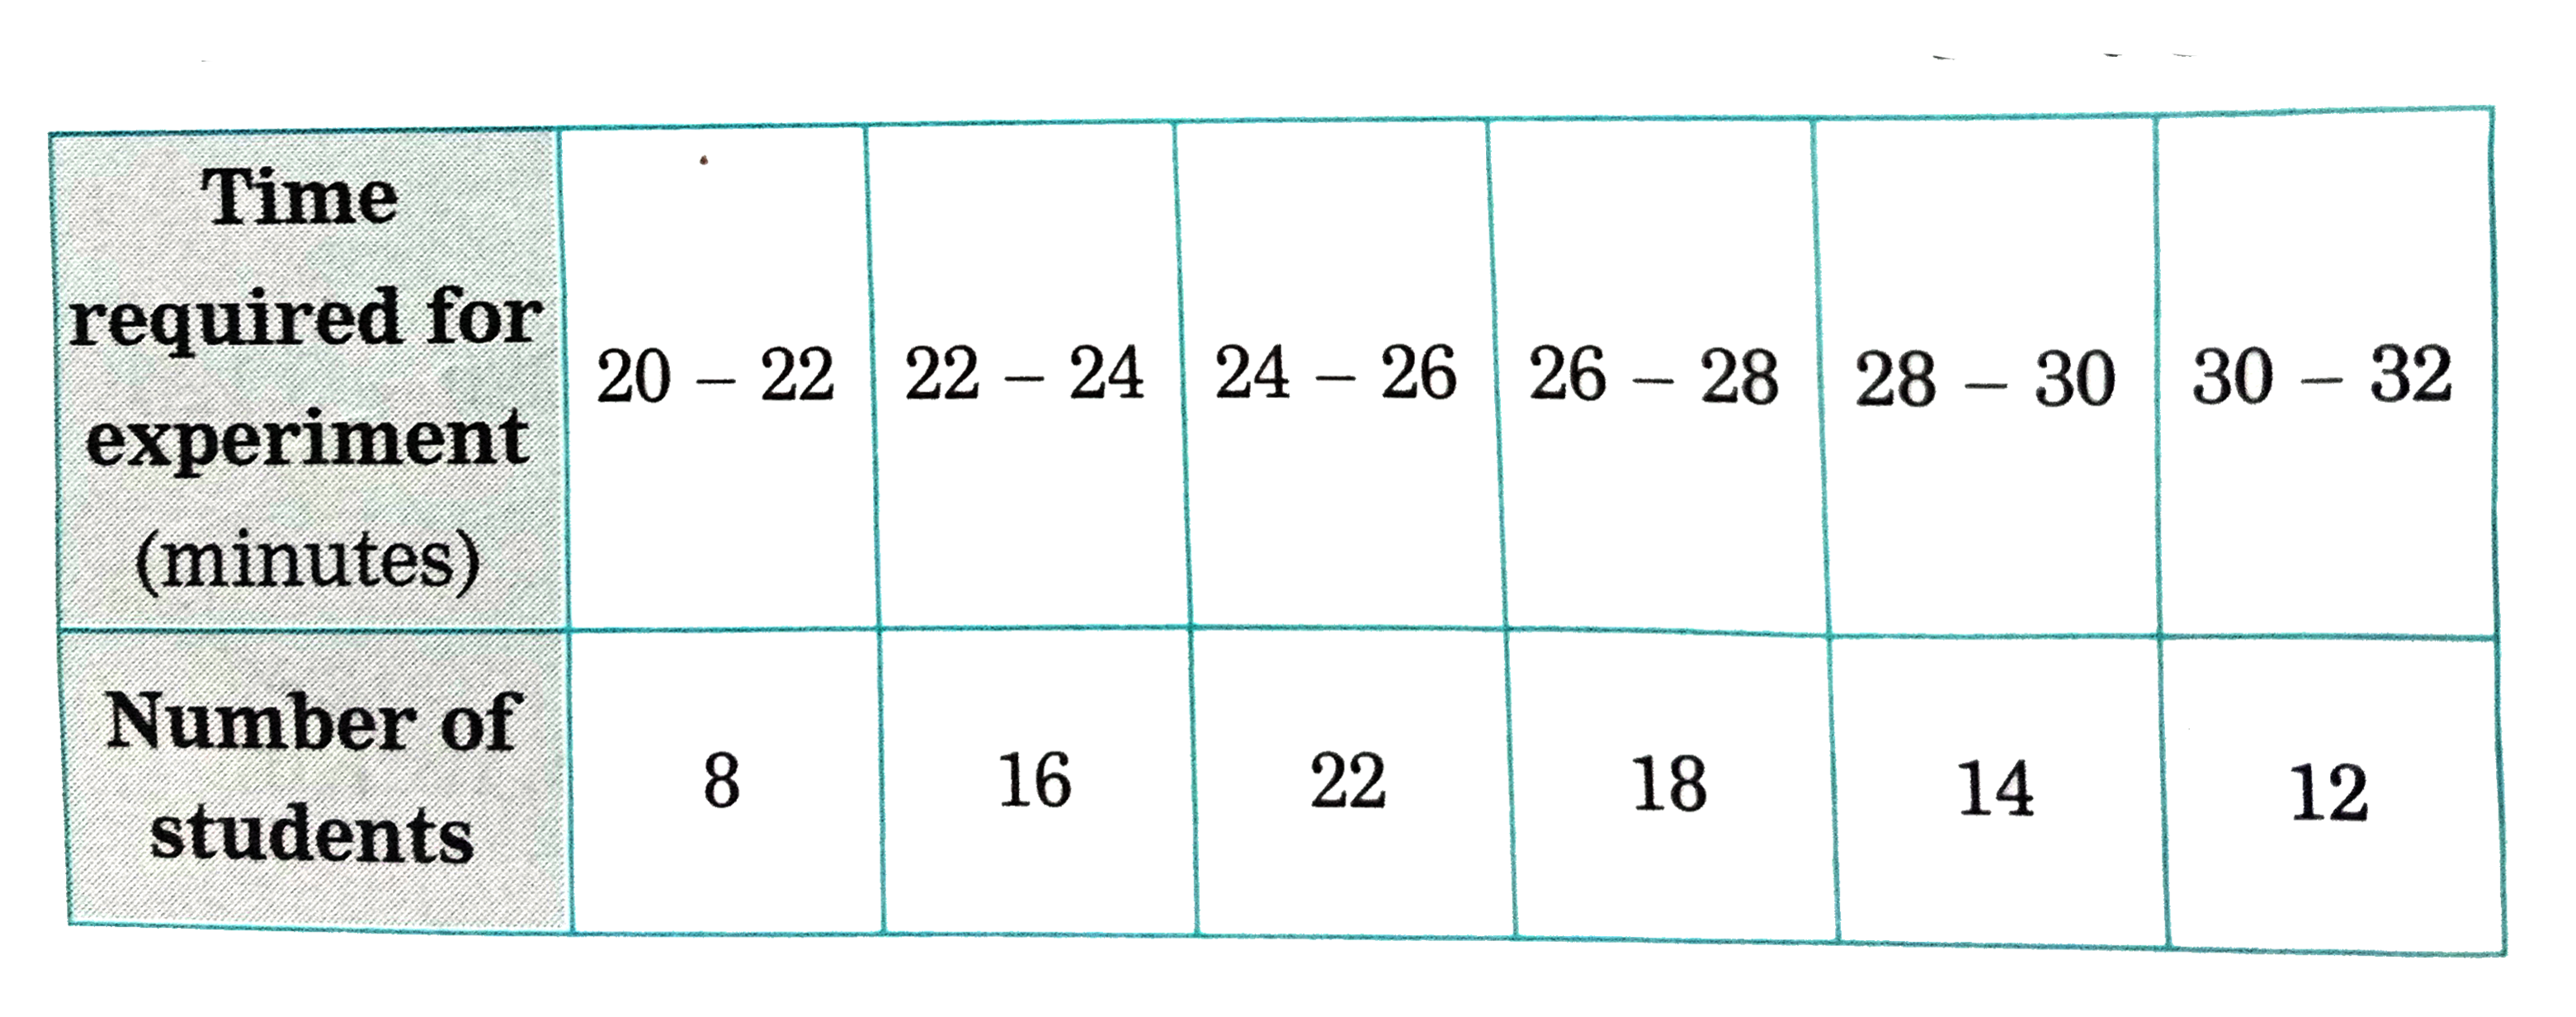
The time required for students to do a science experiment and the number of students is shown in the following grouped frequency distribution table. Show information by a histogram and also by a frequency polygon.
 View Solution
The following table is based on the marks of the first term examination of 10th class students . Show the information by a histogram. Also, draw a frequency polygon with the help of the histogram :
 View Solution

