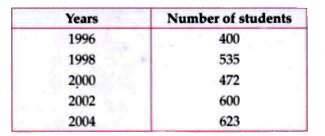
Total number of students of a school in different years is shown in the following table: Year, No. of Students 1996 1998 2000 2002 2004, 400 550 450 600 650 Represent the above data by a pictograph. Prepare a pictograph of students using one symbol an icon of a student to represent 100 students and answer the following questions: How many symbols represent total number of students in the year 2002? How many symbols represent total number of students in the year 1998? Prepare another pictograph of students using any other symbol each representing 50 students. Which pictograph do you find more informative?
Step by step video & image solution for Total number of students of a school in different years is shown in the following table: Year, No. of Students 1996 1998 2000 2002 2004, 400 550 450 600 650 Represent the above data by a pictograph. Prepare a pictograph of students using one symbol an icon of a student to represent 100 students and answer the following questions: How many symbols represent total number of students in the year 2002? How many symbols represent total number of students in the year 1998? Prepare another pictograph of students using any other symbol each representing 50 students. Which pictograph do you find more informative? by Maths experts to help you in doubts & scoring excellent marks in Class 6 exams.
Topper's Solved these Questions
Similar Questions
Total number of students of a school in different years is shown in the following table.
Prepare another pictograph of students using any other symbol each representing 50 students. Which pictograph do you find more informative ?View Solution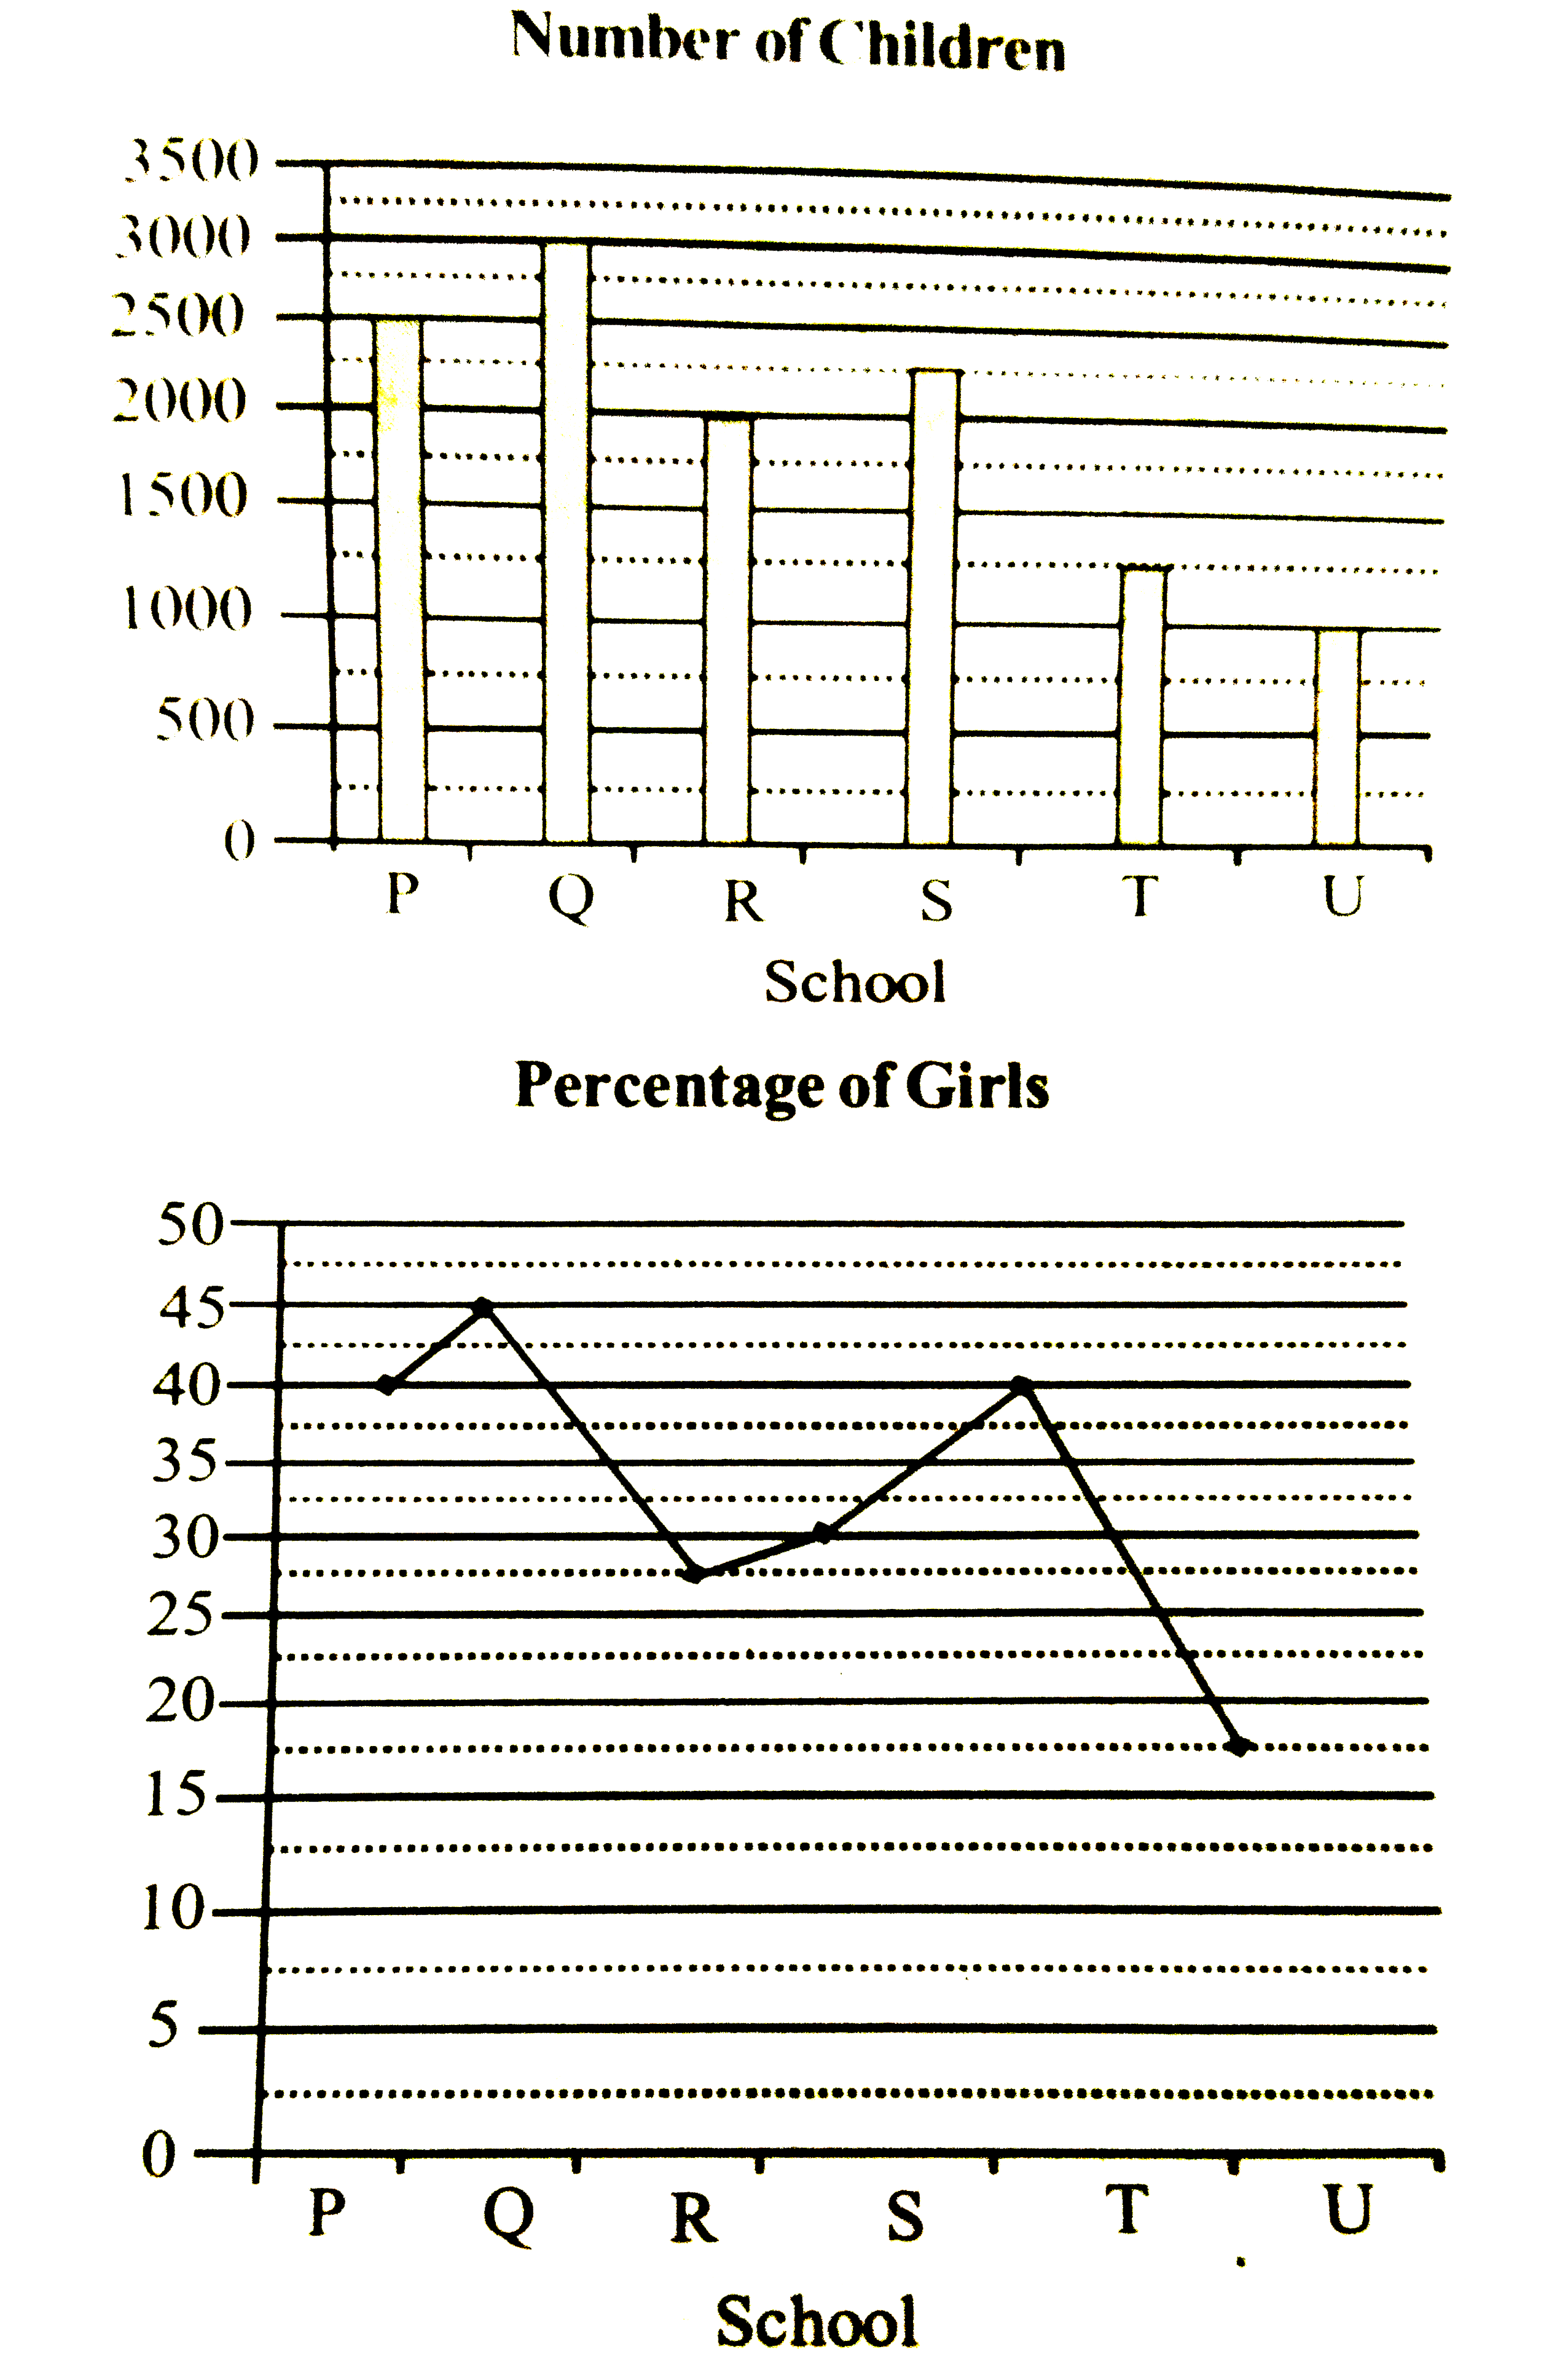
The total number of student in school R, is approximately what percent of the total number of student in school S?View Solution
Knowledge Check
- Question 1 - Select One
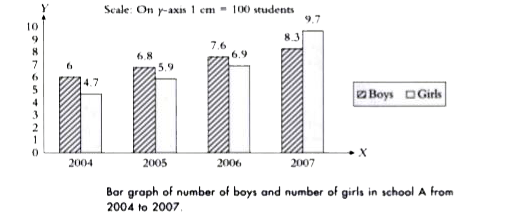
Total number of students in the year 2005 is_______A1160B1270C1380D1490 - Question 2 - Select One
42% of the total number of student passed in a class test. How many students failed, if the total number of students in the class is 1450 ?
A839B831C841D791 - Question 3 - Select One
The following bar graph shows the number of students in a particular class of school. Then, answer the following questions.
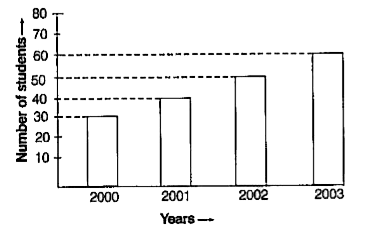
What is the number of students in the year 2003?A10B25C45D60
The total number of students who applied for scholarship in the last five years is given below :

Using the symbol to represent 500 students, answer the following questions.
(i) How many symbols are needed to represent the number of students in 2010 ?
(ii) How many more symbols are needed to represent the number of students in 2012 than in 2009 ?View SolutionThe given pictograph represents the number of students in 5 sections of class VI.
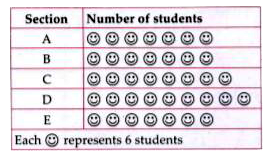
Study the given pictograph and answer the following questions.
How may students are there in section E ?View SolutionThe given pictograph represents the number of students in 5 sections of class VI.
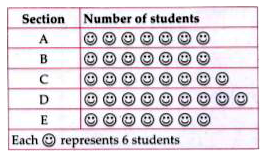
Study the given pictograph and answer the following questions.
Find the total number of students in 5 sections of Class VI.View SolutionThe following bar graph shows the number of students in a particular class of school. Then, answer the following questions.
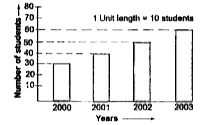
What is the number of students in the year 2003?View SolutionThe given pictograph represents the number of students in 5 sections of class VI.
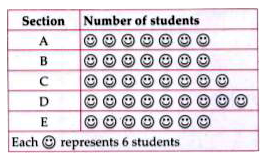
Study the given pictograph and answer the following questions.
How many less students are there in section E than section D ?View Solution

