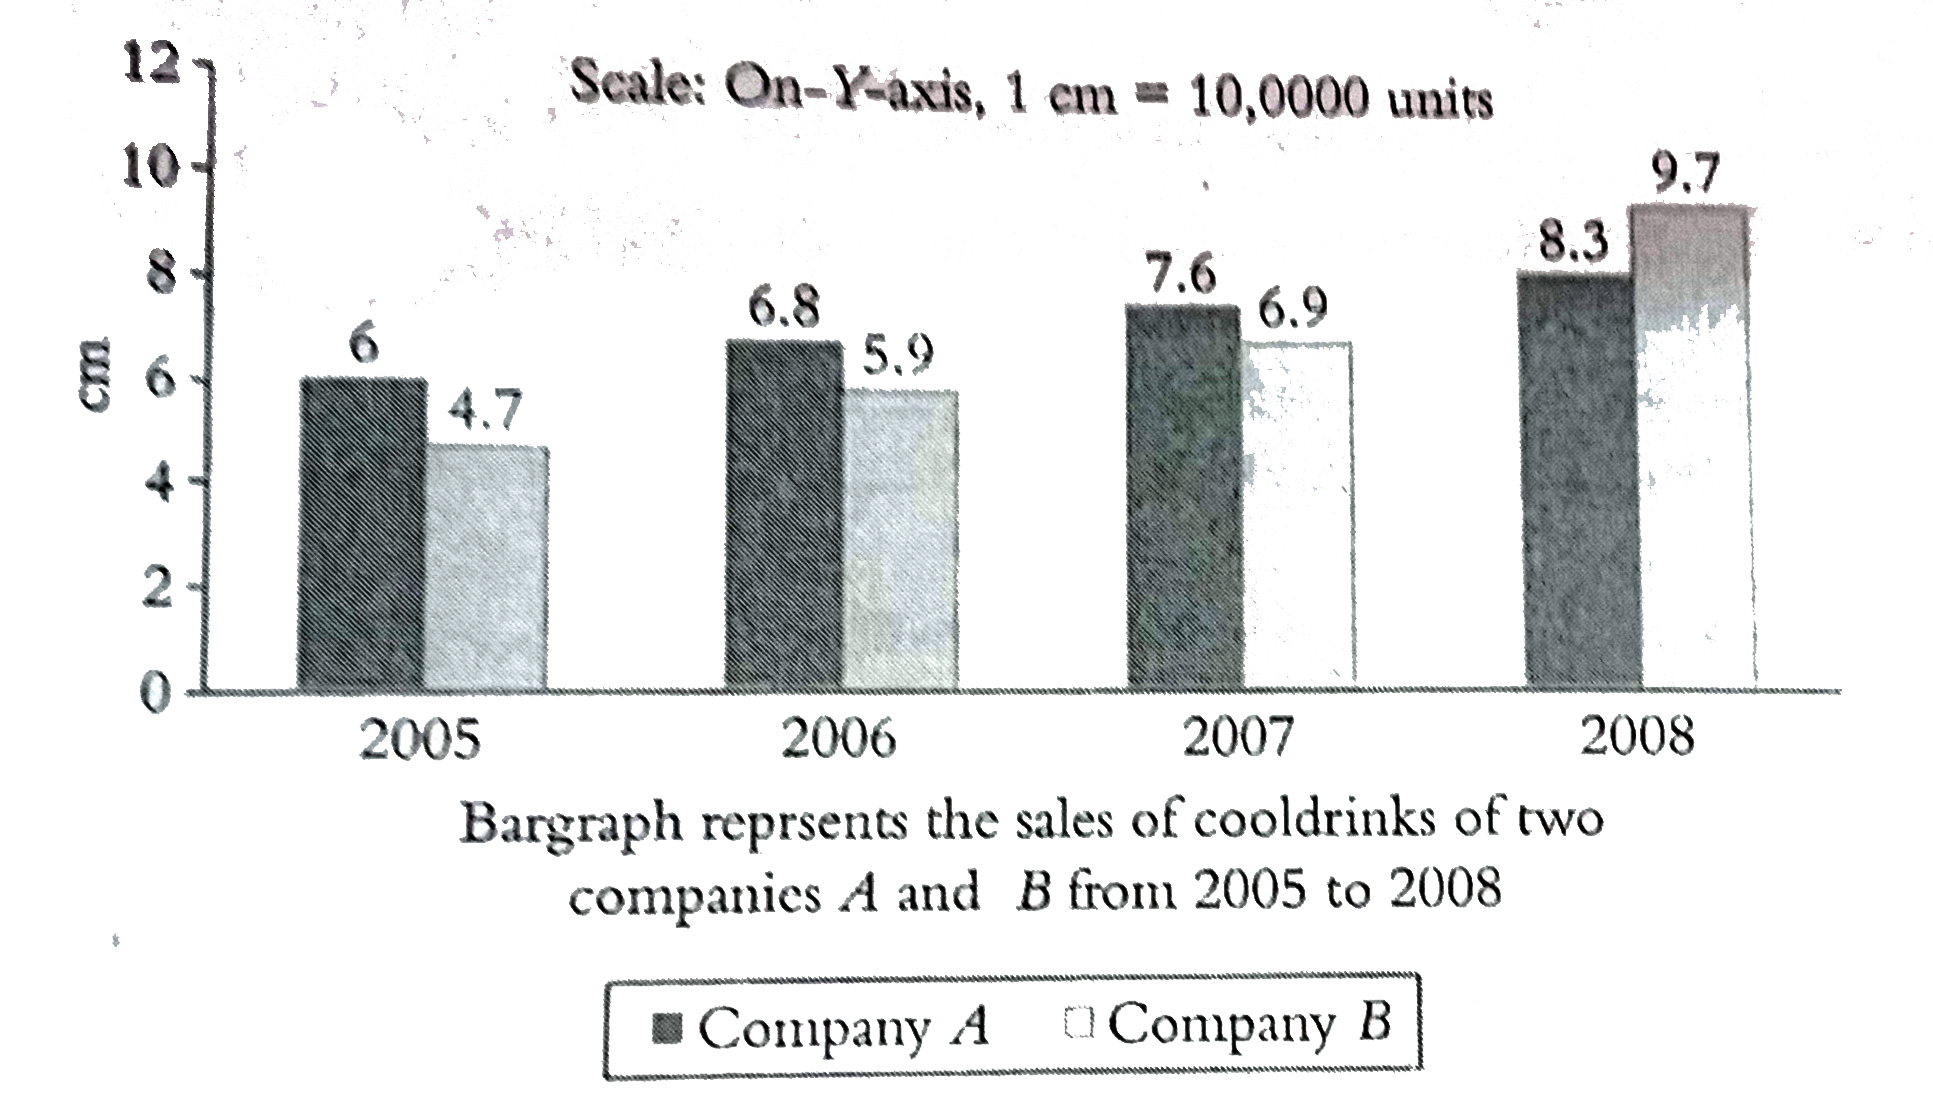
Total sales of A and B in the year 2006 is _____.
11,60,000
12,70,000
13,80,000
14,90,000
The correct Answer is:B
Total sales of A and B in the year 2006
=(6.8+5.9)×100000=1270,000
Hence, the correct option is (b).
Topper's Solved these Questions
- STATISTICSBOOK - PEARSON IIT JEE FOUNDATIONCHAPTER - STATISTICSEXERCISE - Level 2
22 Videos
- STATISTICSBOOK - PEARSON IIT JEE FOUNDATIONCHAPTER - STATISTICSEXERCISE - Level 3
11 Videos
- STATISTICSBOOK - PEARSON IIT JEE FOUNDATIONCHAPTER - STATISTICSEXERCISE - Essay Type
6 Videos
- SIMPLE INTEREST AND COMPOUND INTEREST BOOK - PEARSON IIT JEE FOUNDATIONCHAPTER - SIMPLE INTEREST AND COMPOUND INTEREST EXERCISE - Level 3
9 Videos
Similar Questions
The line graph shows the production of product A and B (in thousands) during the period 2004 to 2009 and the second line Graph shows the percentage sale of these products.
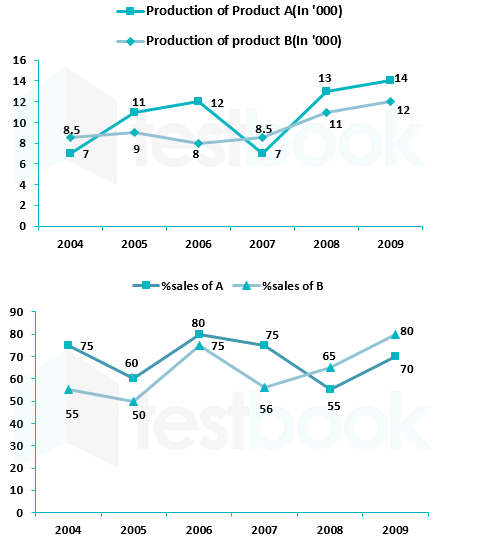
In the given line graph, what is the total sale of Products A and B in the year 2007?
View SolutionThe line graph shows the production of product A and B during the period 2004 to 2009 and the second line graph shows the percentage sale of these products
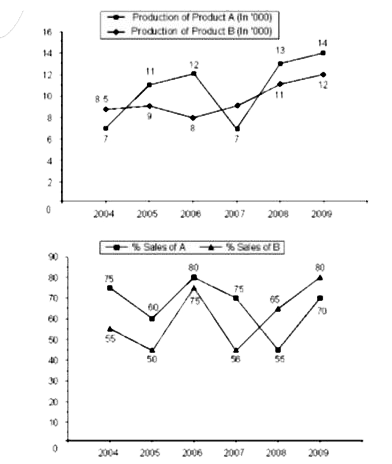
In the given line graph, what is the total sale of products A and B in the year 2007
View Solution
Knowledge Check
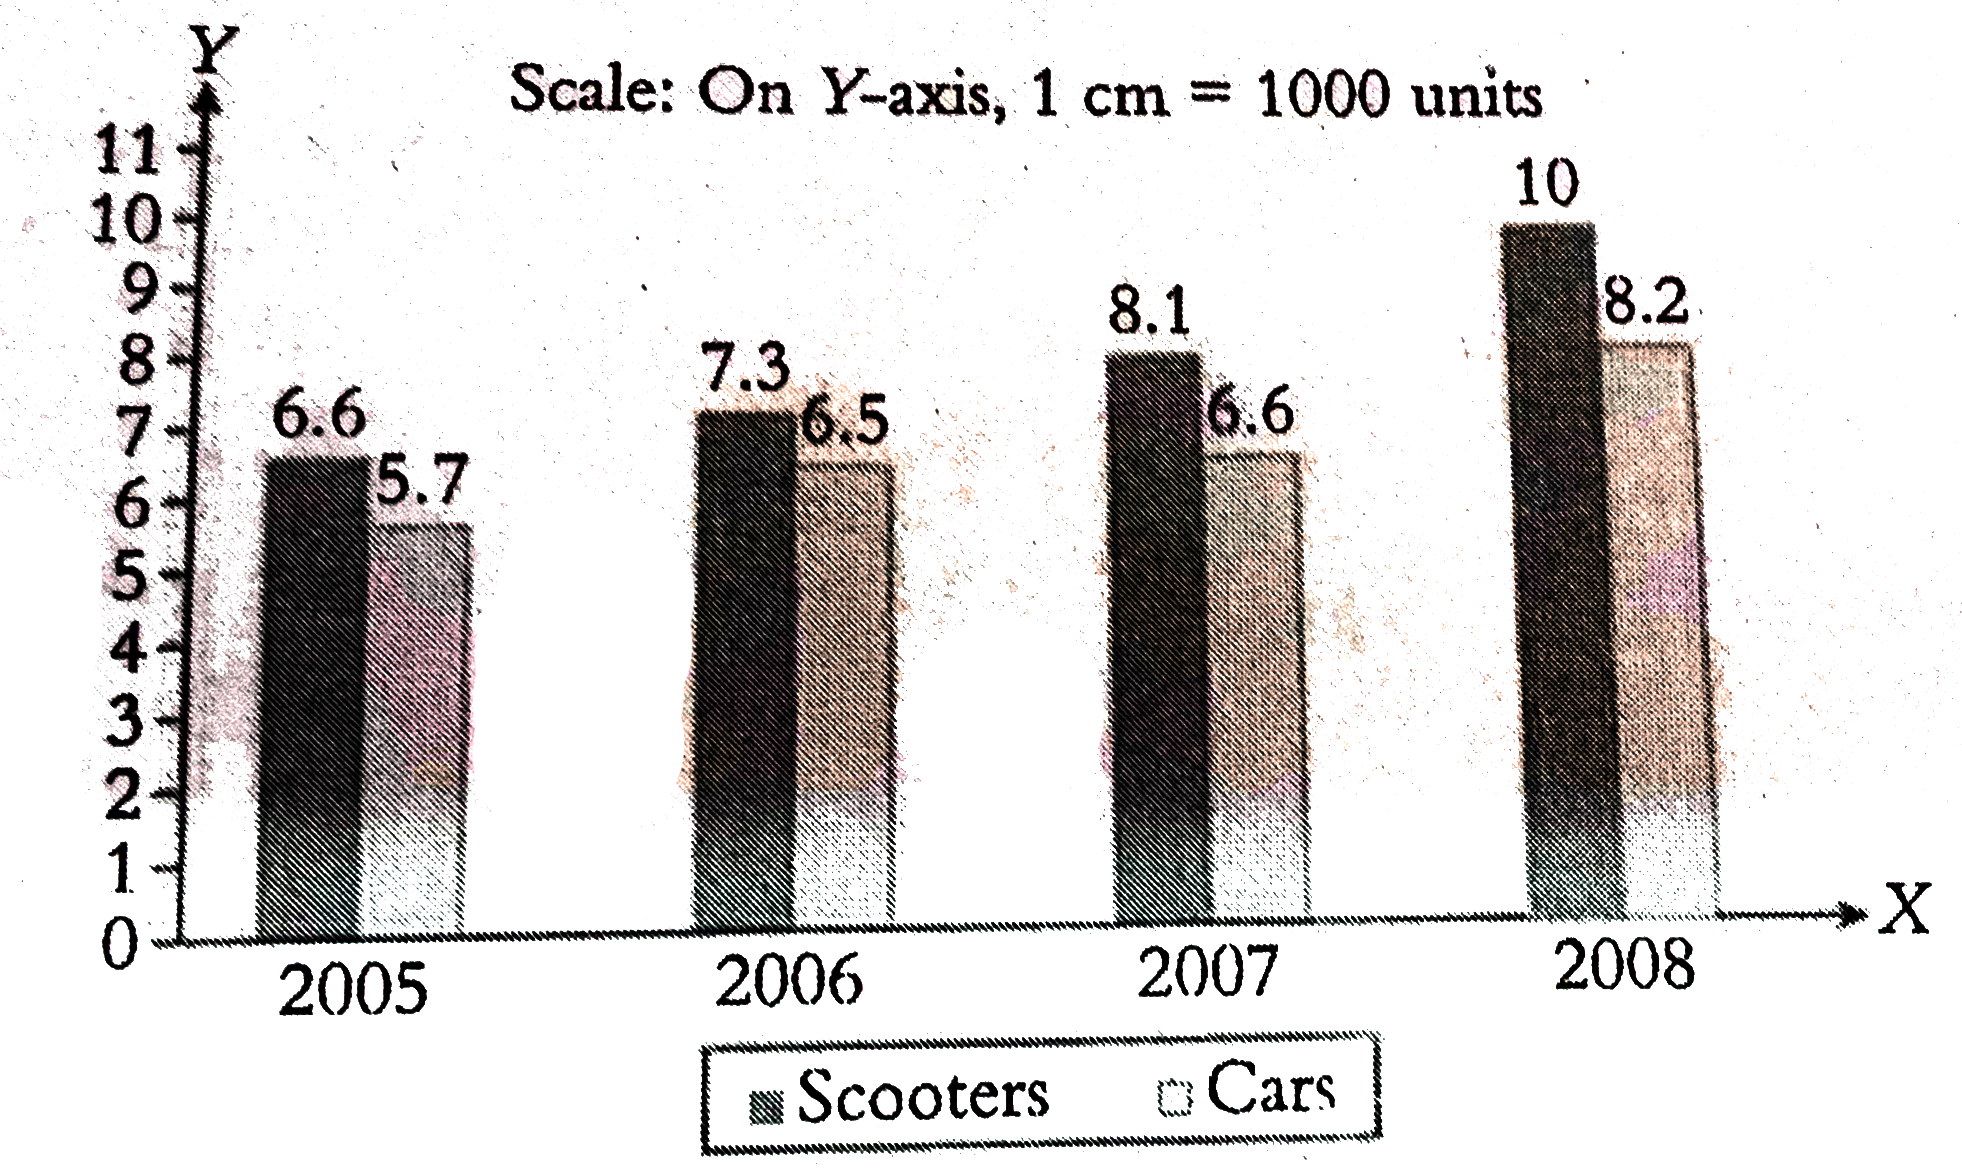
Total number of vehicles (scooters and cars) sold in the year 2005 and 2006 is ______.A26100B28500C25100D27500The bar chart given below shows the number of cars sold by brand A and B for the year for 2008 to 2016
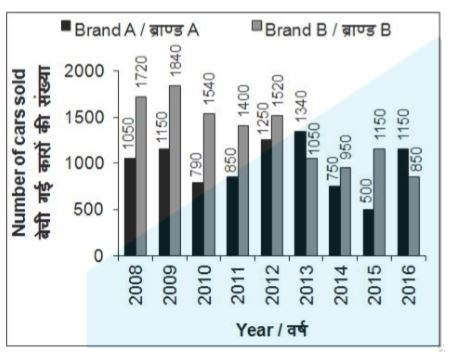
The total sales of the two brands in year 2015 is what percent of the total sales in 2016?A82.5B86.5C87.5D79.5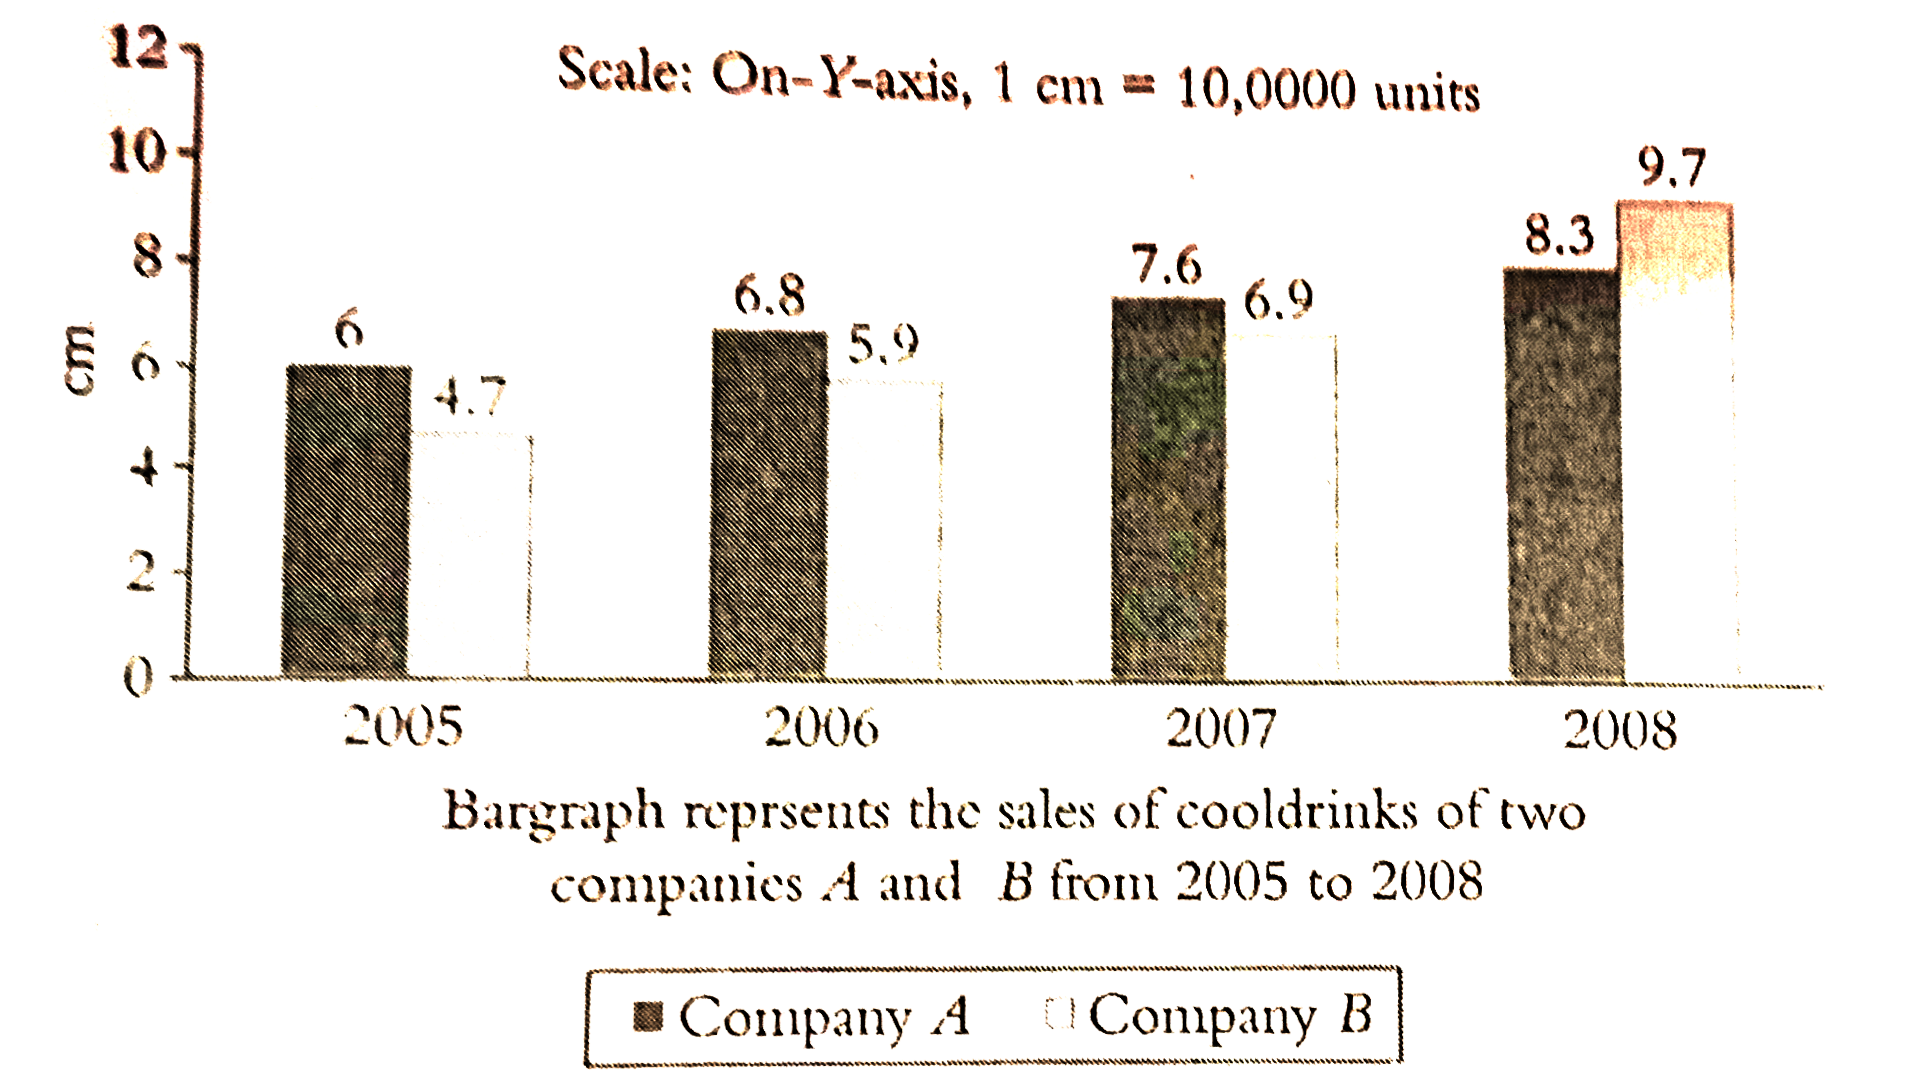
Find the ratio of the total sales in the year 2007 and that in 2008.A107:145B127:145C29:36D107:127
The given bar graph present the sales of the number of books by six branches of a publishing company during two consecutive years 2000 and 2001.
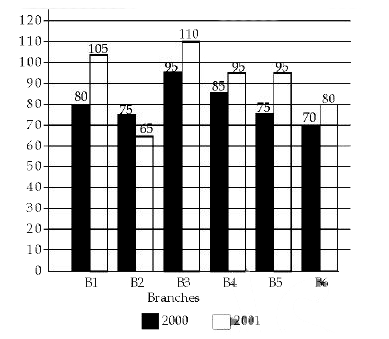
The ratio of total sales by all branches for the year 2001 to total sales by all branches for the year 2000 is:
View SolutionThe given Bar Graph present the sales of the number of books (in thousands) by six branches of a publishing company during two consecutive years 2000 and 2001.
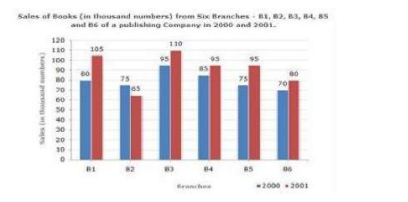
The ratio of the sales by all branches for the year 2001 to total sales by all branches for the year 2000 is:
View SolutionThe following table shows the sales of a commodity during the years 2000 to 2006. Years:, 2000, 2001, 2002, 2003, 2004, 2005, 2006 Sales (in lakhs of Rs.), 1.5, 1.8, 2.4, 3.2, 5.4, 7.8, 8.6 Draw a graph of this information.
View SolutionDirections :- Sales of Books (in thousand numbers)from Six , Branches— BI,B2,B3, B4,B5 and B6 ofa publishing company in 2009 and 2010. Study thegraph and answer the questions.
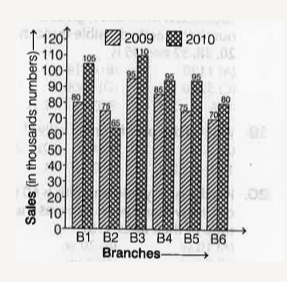
The Ratio of the total sales of Branch B2 for both years of the total sales of Branch B4 for both years is
(A) 7:9
(B) 2:3
(C) 4:5
(D) 3:5
View SolutionIn the following bar diagram sales of books (in thousand numbers) from six branches - B1, B2, B3, B4, B5 and B6 of a publishing company in 2009 and 2010 have been shown. Study the graph and answer the questions.
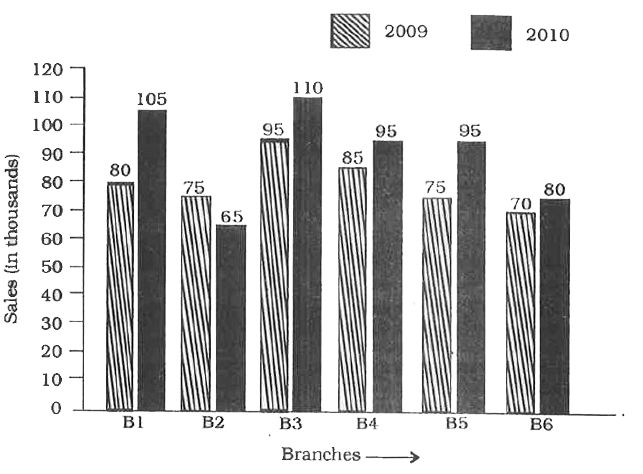
Total sales of branch B6 for both the years is x per cent of the total sales of branch B3 for both the years. The value of x is
View Solution
