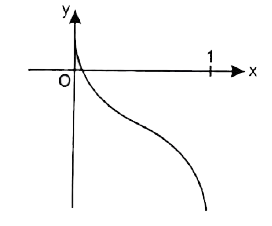
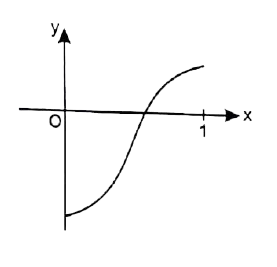
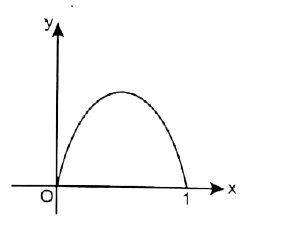
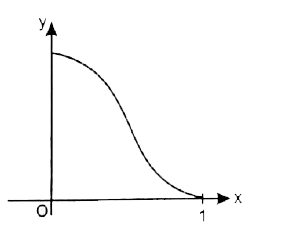
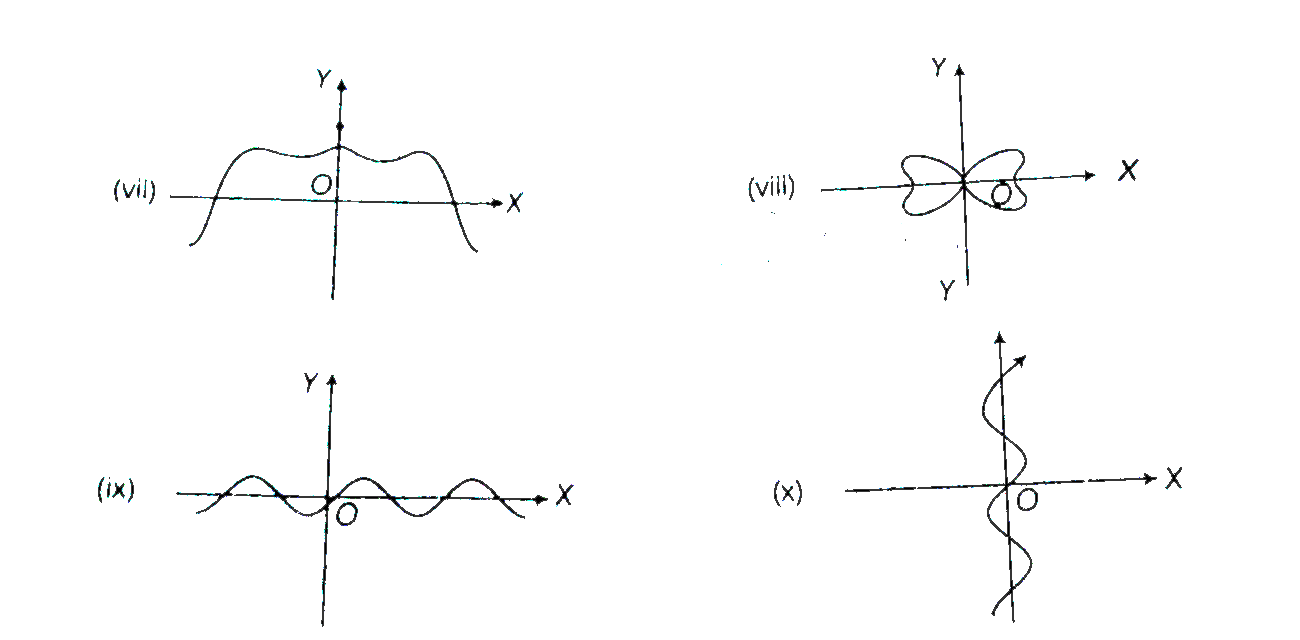
Which of the following graphs represent function whose derivatives have a maximum in the interval ?
A
B
C
D
Video Solution
Text Solution
The correct Answer is:A, B, D
|
Answer
Step by step video & image solution for Which of the following graphs represent function whose derivatives have a maximum in the interval (0,1) ? by Maths experts to help you in doubts & scoring excellent marks in Class 12 exams.
Updated on:21/07/2023Topper's Solved these Questions
- APPLICATION OF DERIVATIVES Book:VK JAISWAL ENGLISHChapter:APPLICATION OF DERIVATIVES Exercise:EXERCISE (COMPREHENSION TYPE PROBLEMS)
Explore 15 Videos
- APPLICATION OF DERIVATIVES Book:VK JAISWAL ENGLISHChapter:APPLICATION OF DERIVATIVES Exercise:EXERCISE (MATCHING TYPE PROBLEMS)
Explore 5 Videos
- APPLICATION OF DERIVATIVES Book:VK JAISWAL ENGLISHChapter:APPLICATION OF DERIVATIVES Exercise:EXERCISE (SUBJECTIVE TYPE PROBLEMS)
Explore 22 Videos
- AREA UNDER CURVESBook:VK JAISWAL ENGLISHChapter:AREA UNDER CURVESExercise:EXERCISE (SUBJECTIVE TYPE PROBLEMS)
Explore 8 Videos
Similar Questions
Knowledge Check
Which of the following graphs is NOT a function ?
A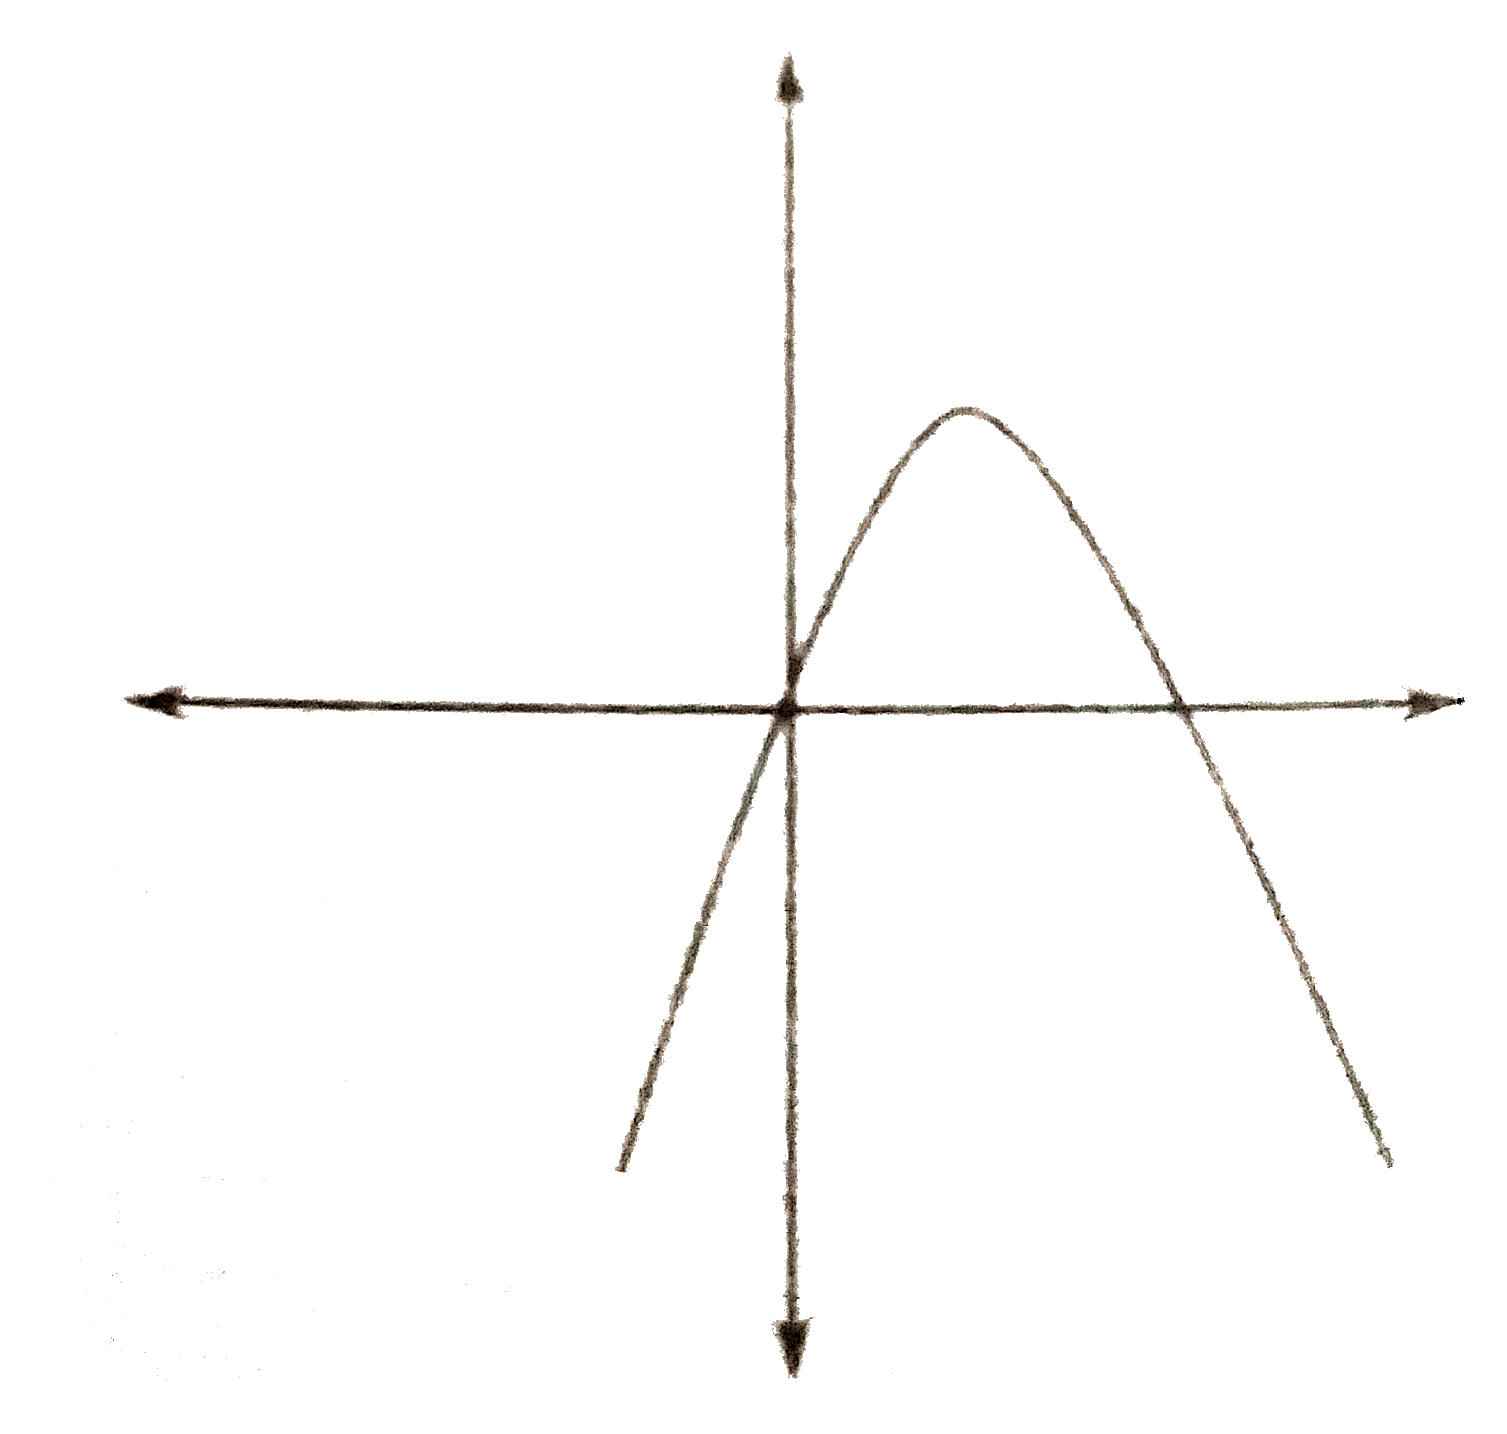 B
B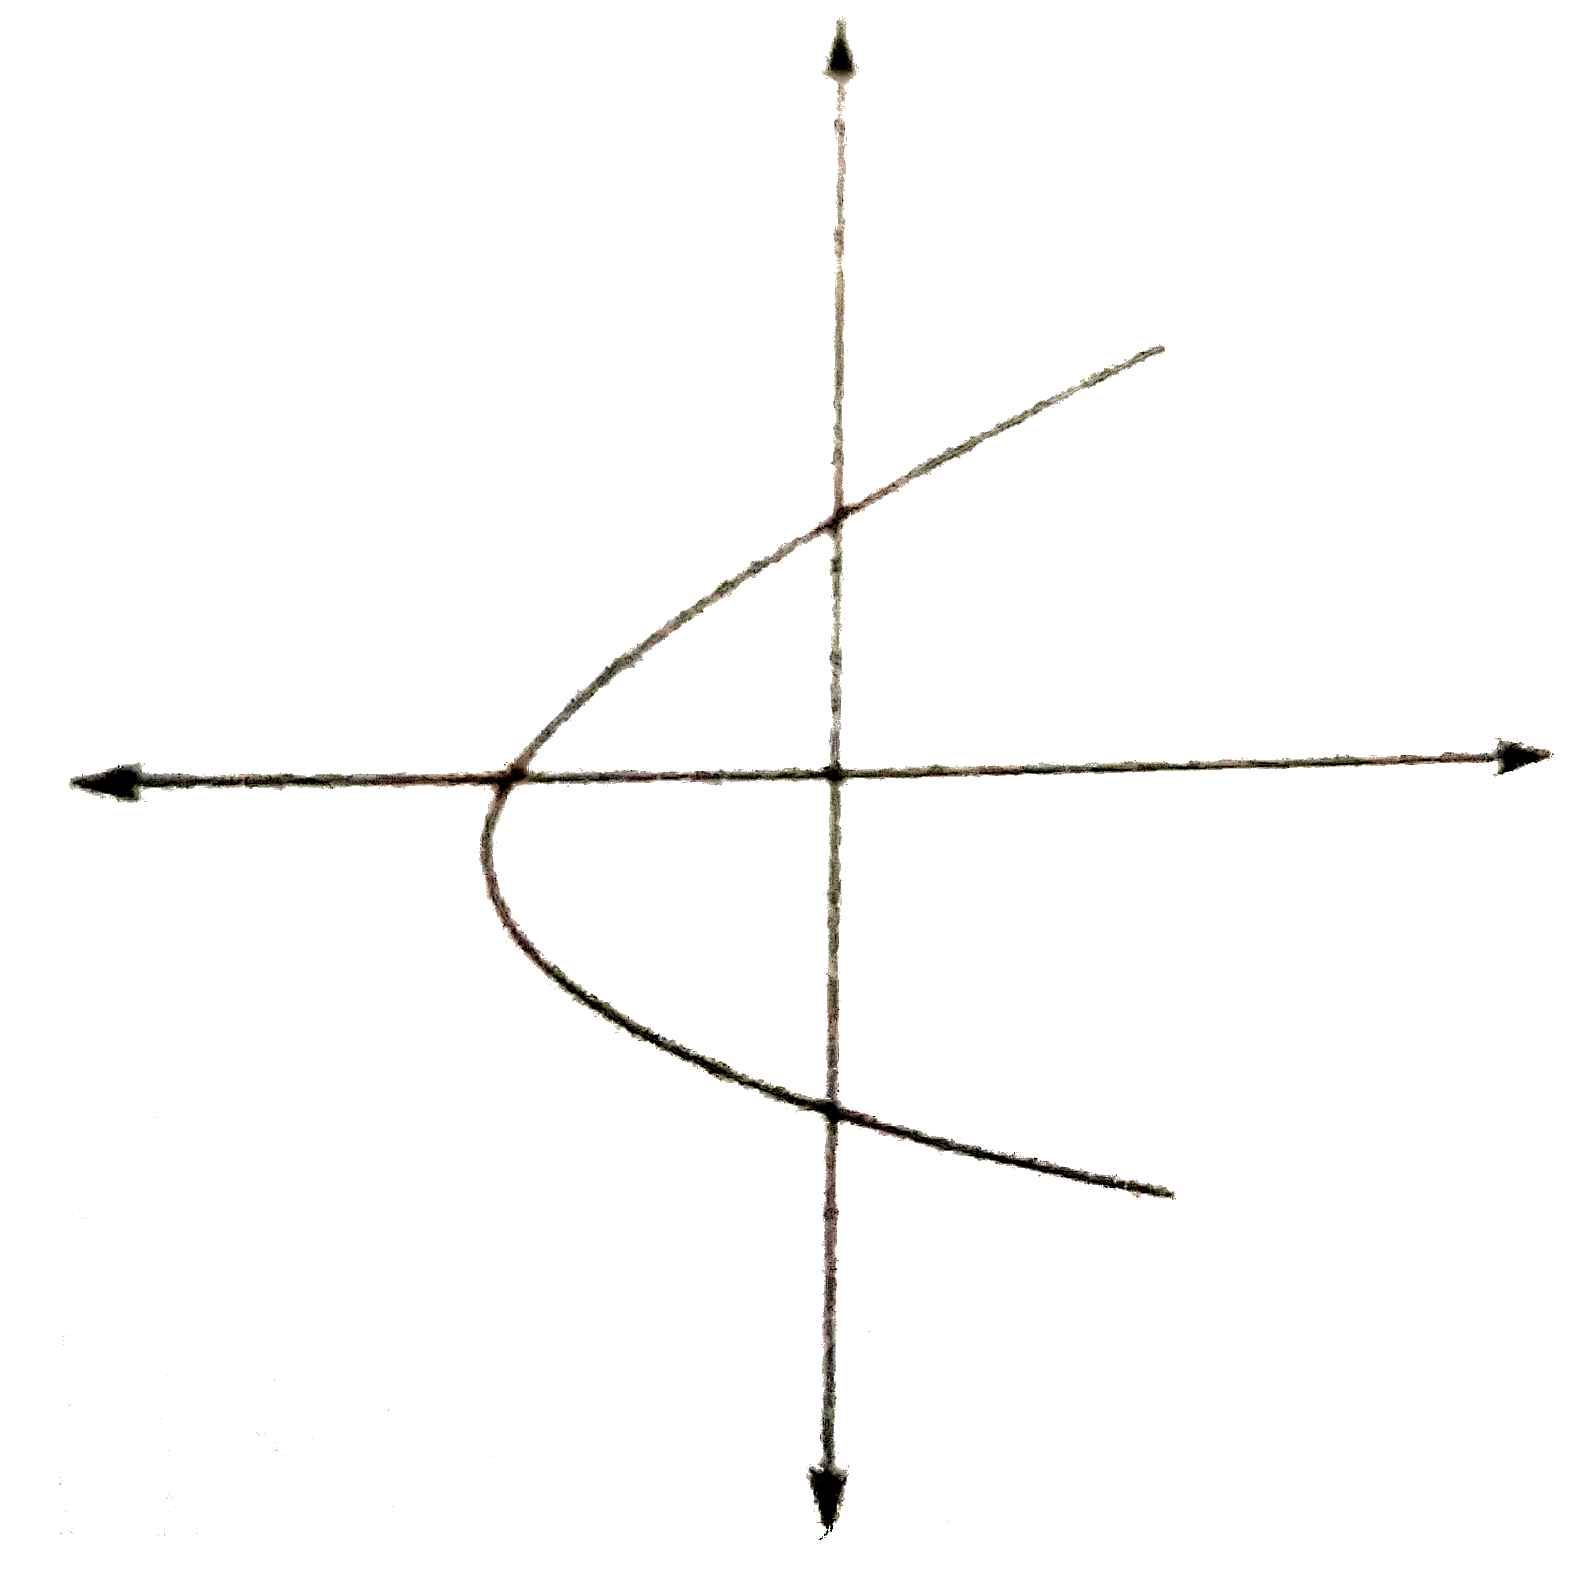 C
C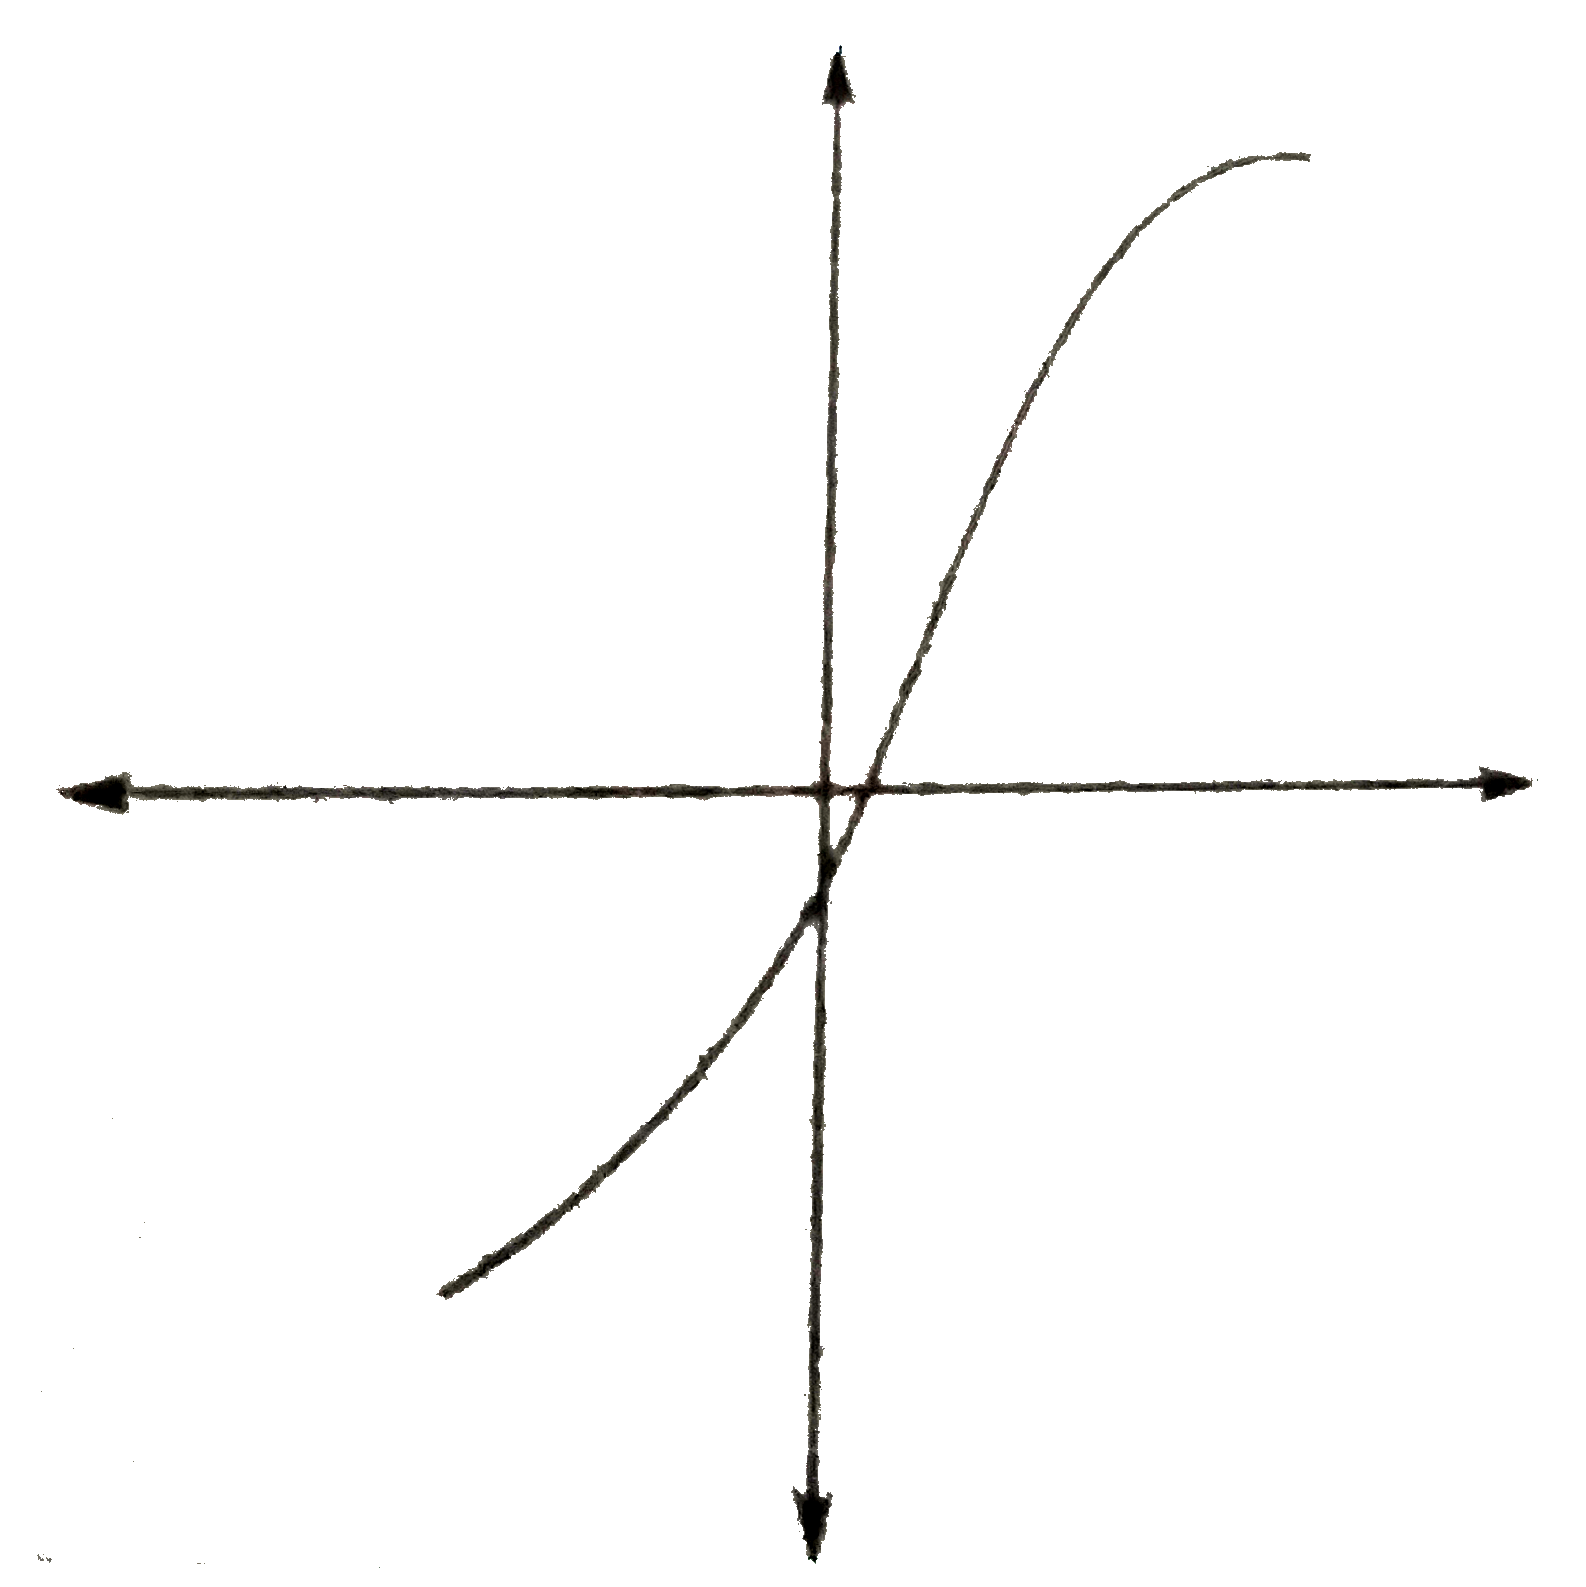 D
D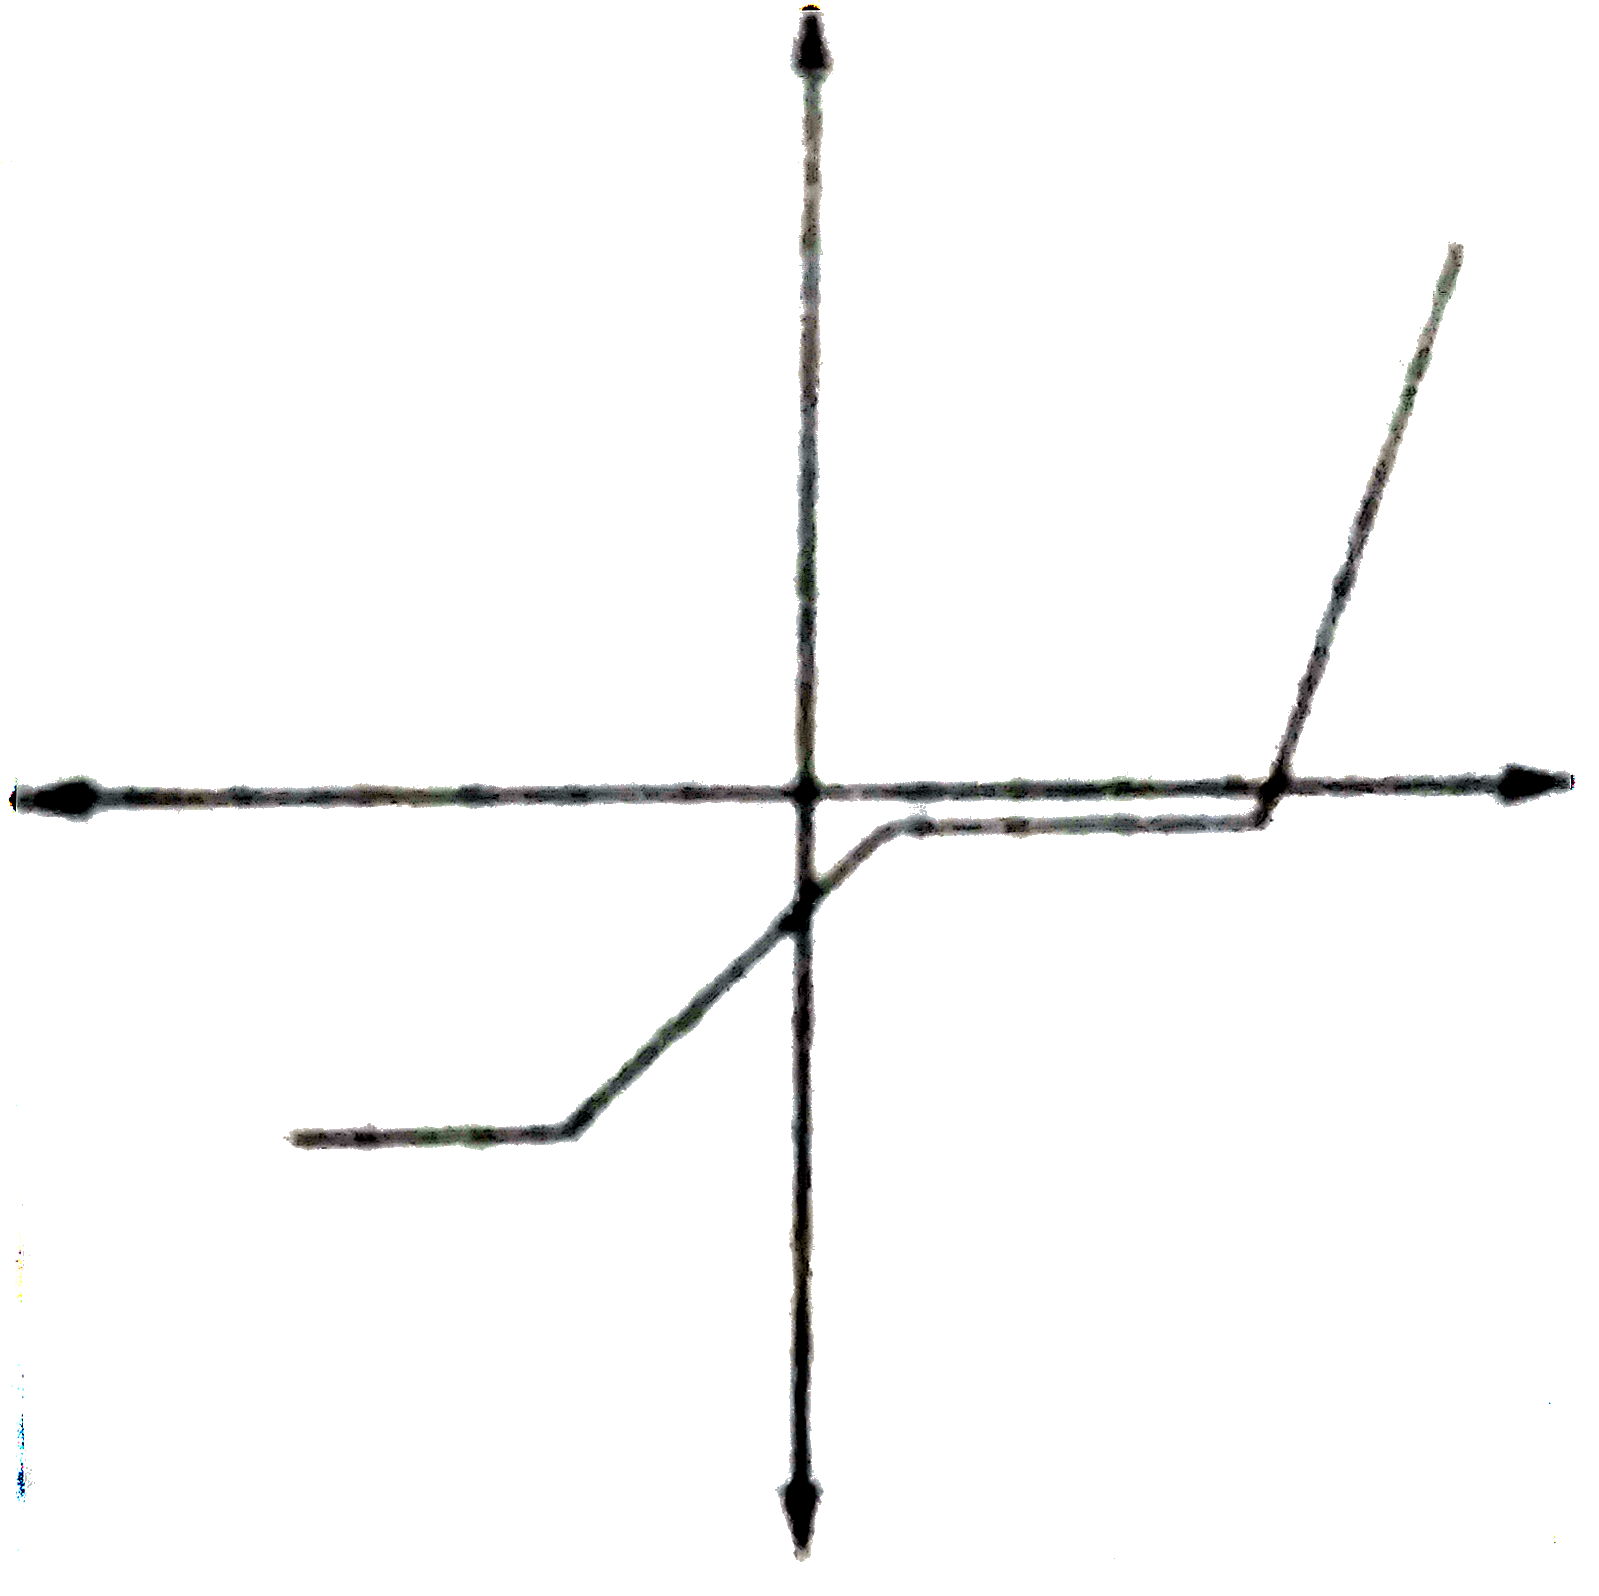
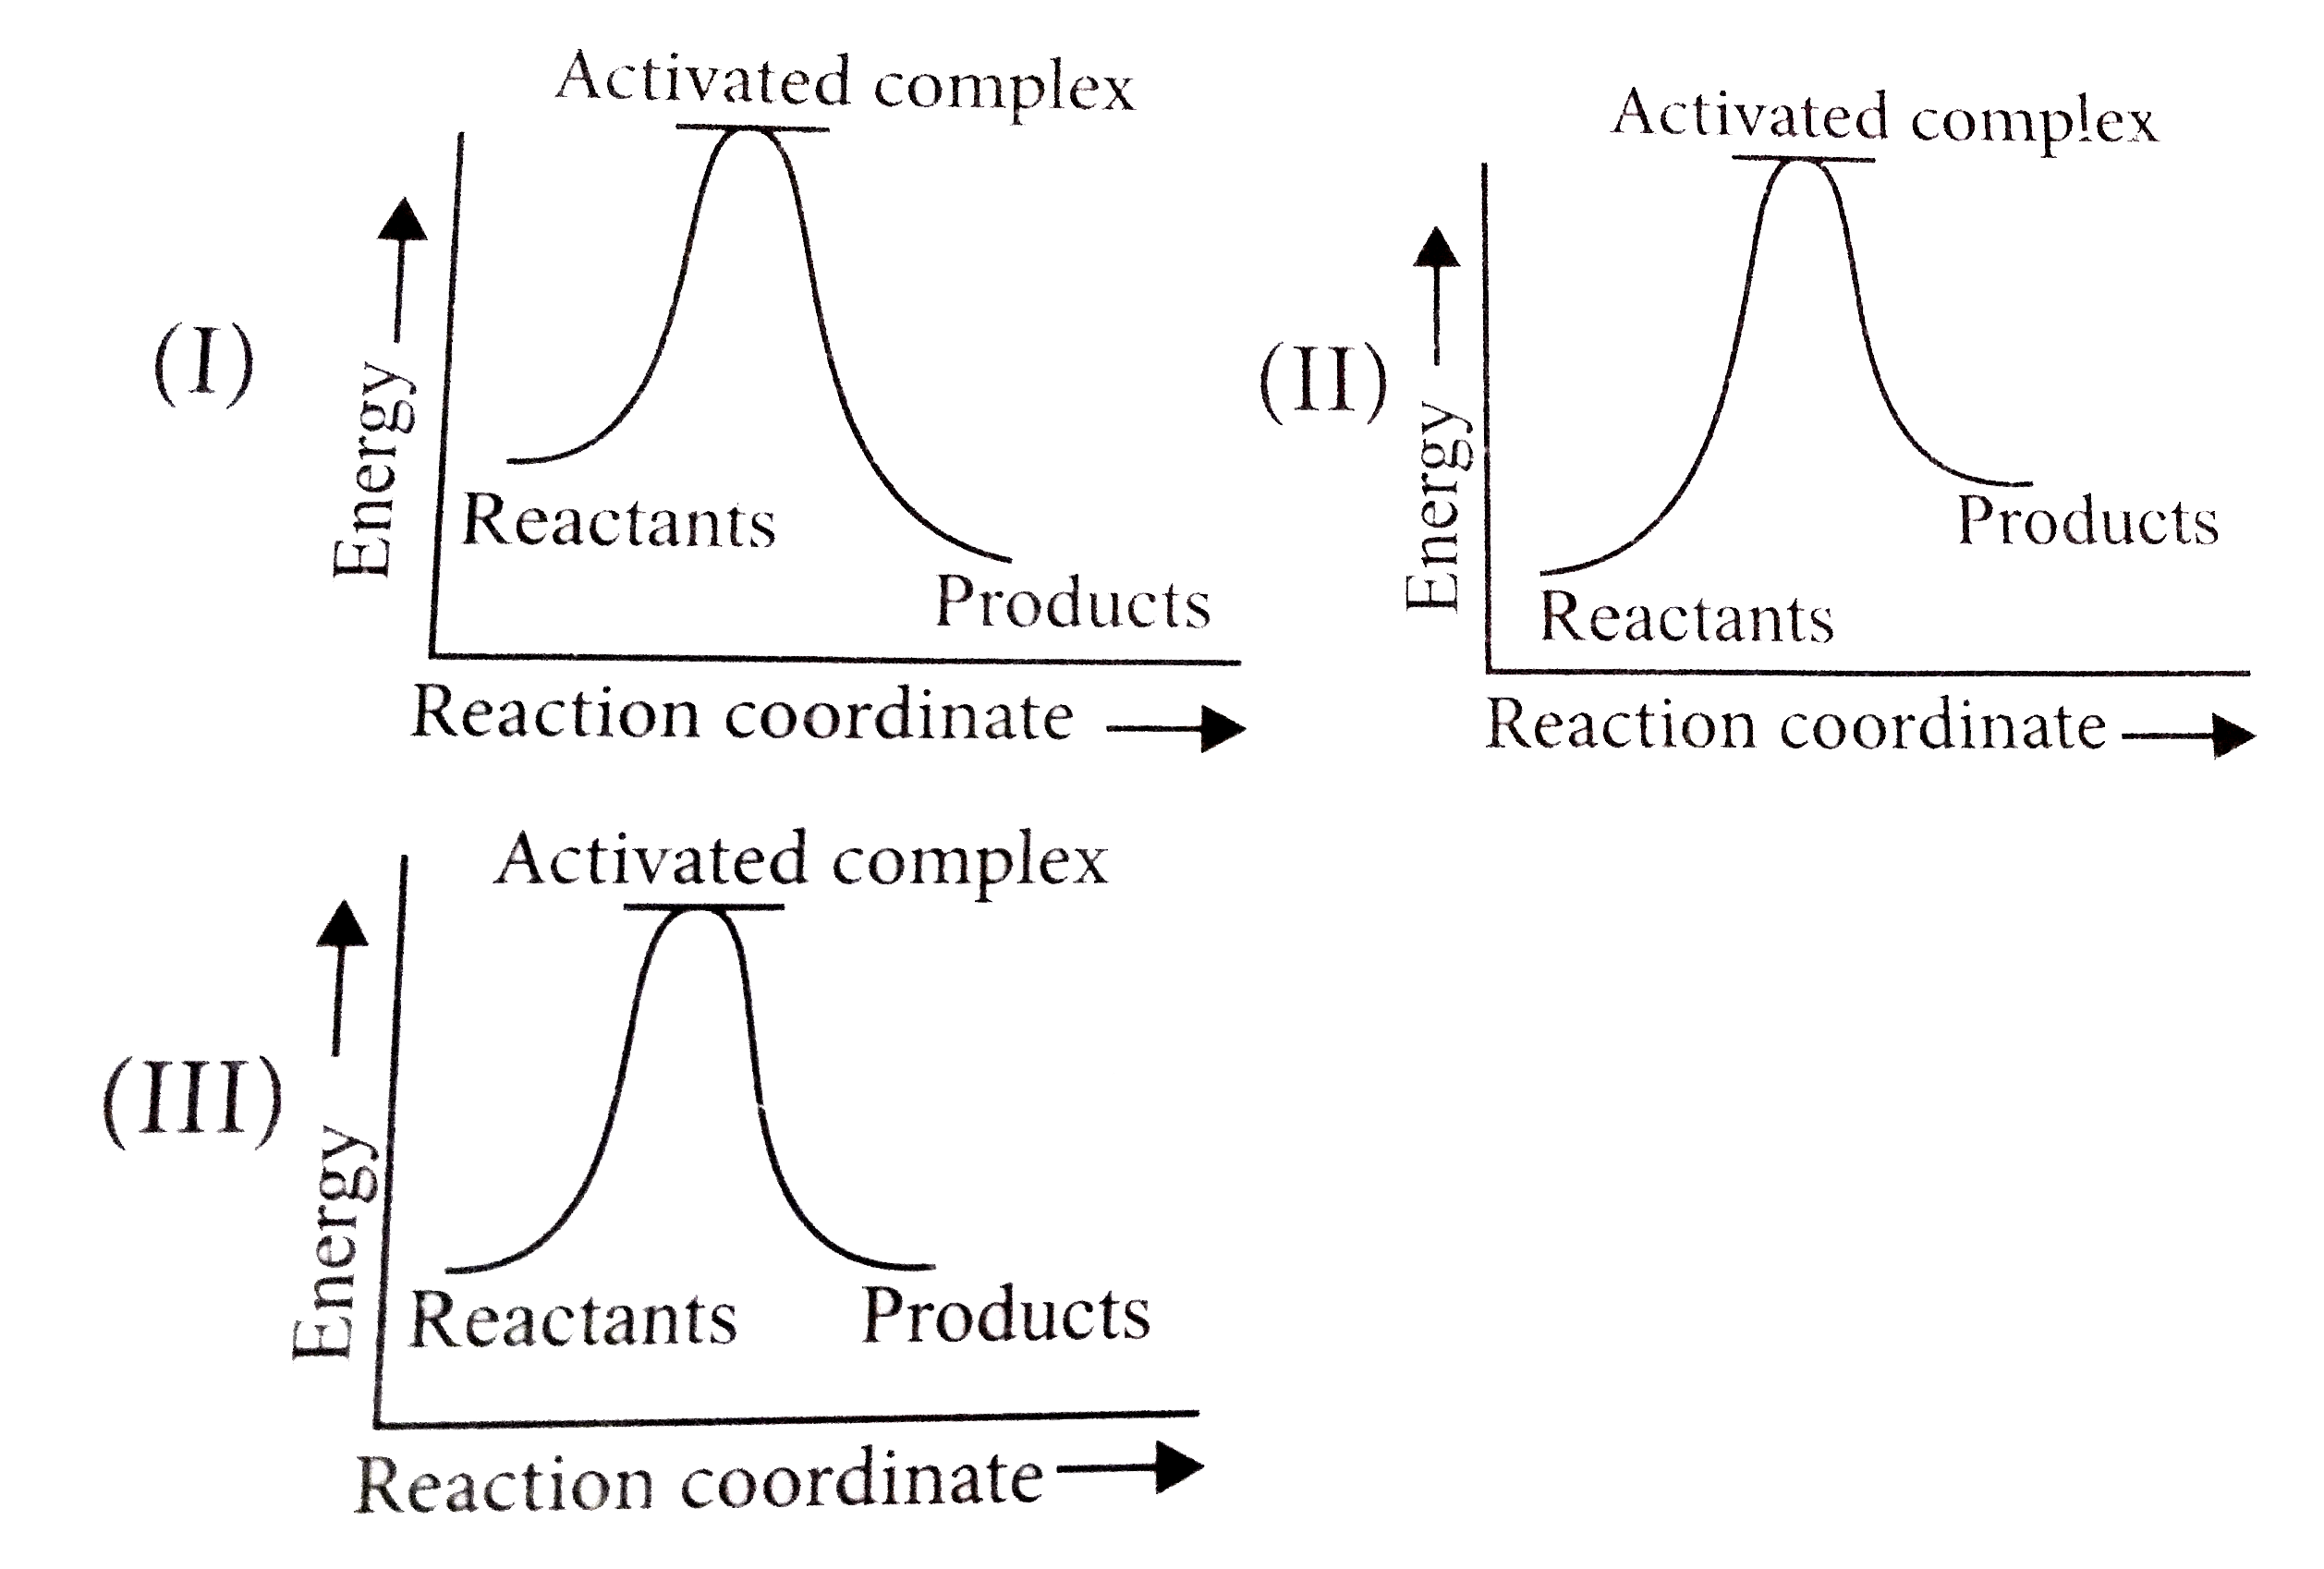
Which of the following graphs represents exothermic reaction ?
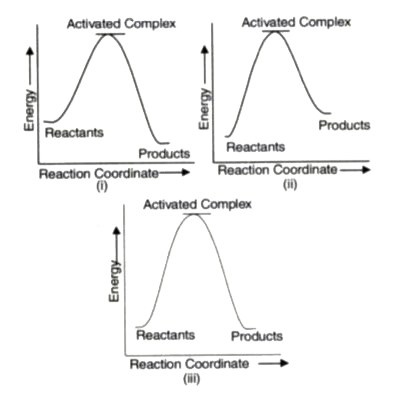 A(i) onlyB(ii) onlyC(iii) onlyD(i) and (ii)
Which of the following represents functional isomerism ?
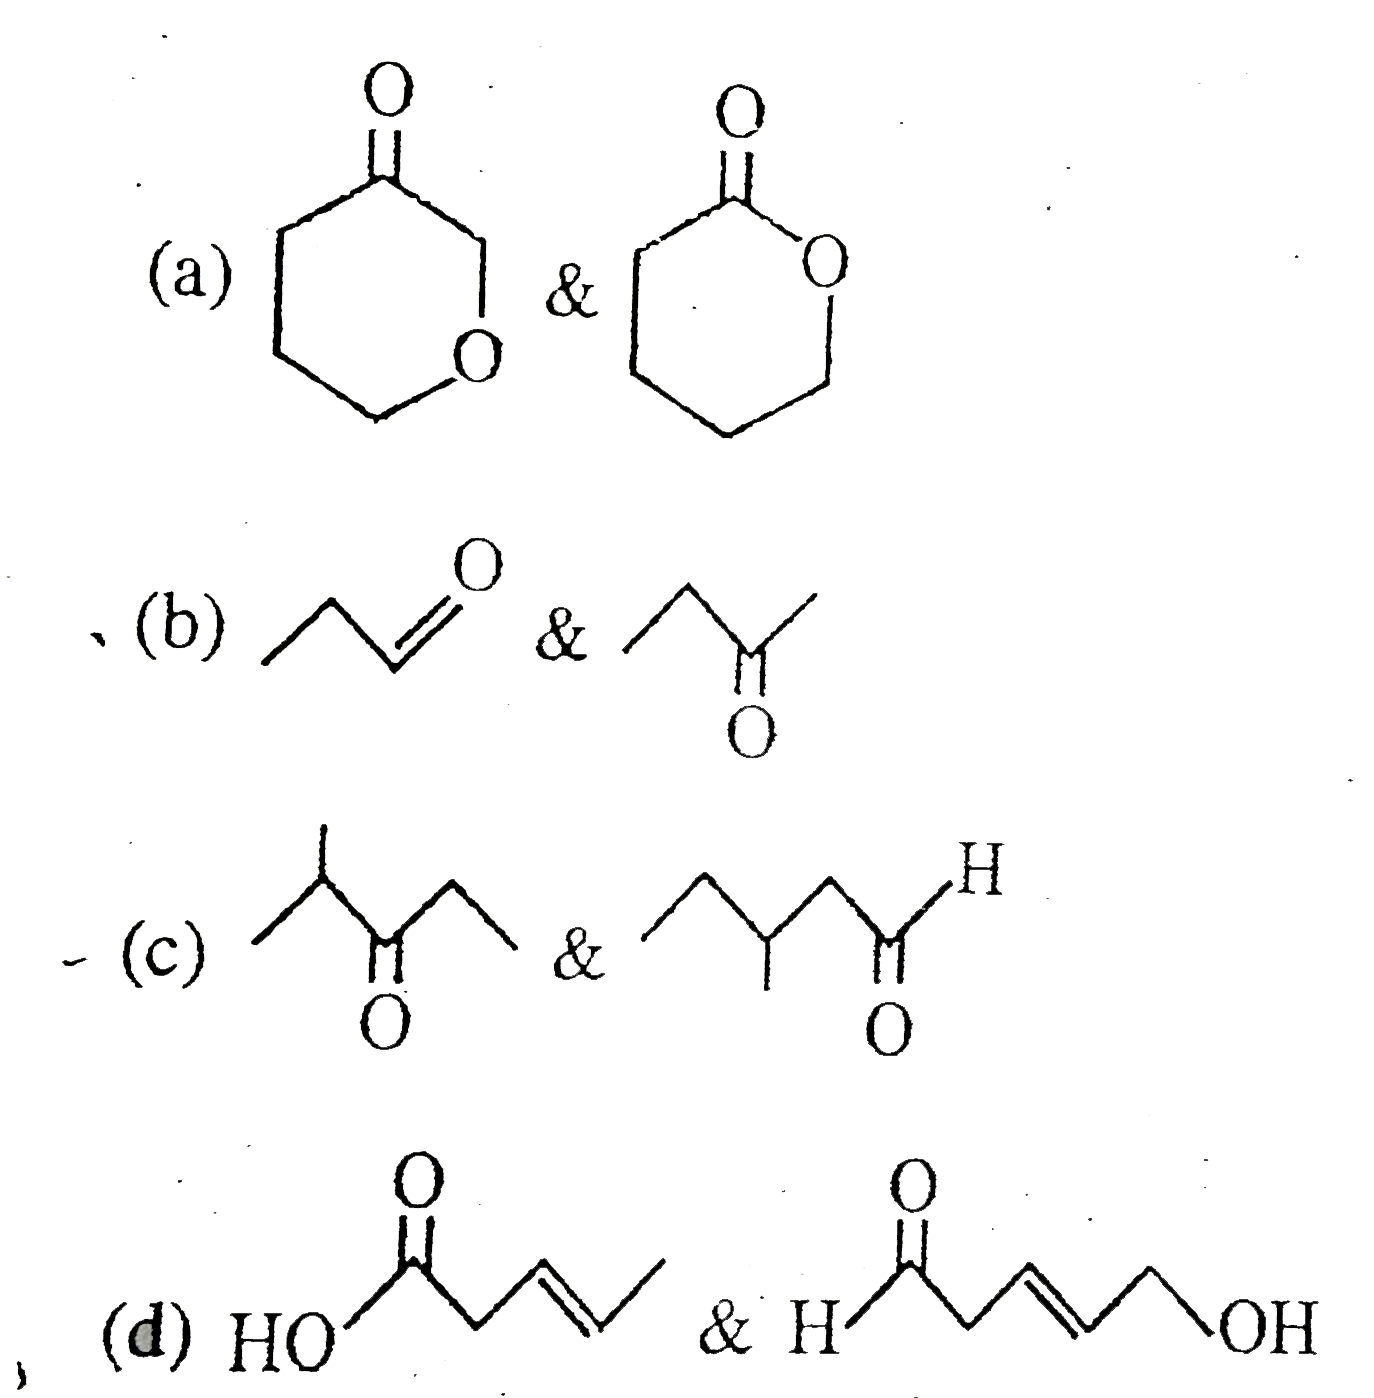
View SolutionWhich of the following graph represents Boyle's law ?
View SolutionDoes the following graph represent a function or a relation?
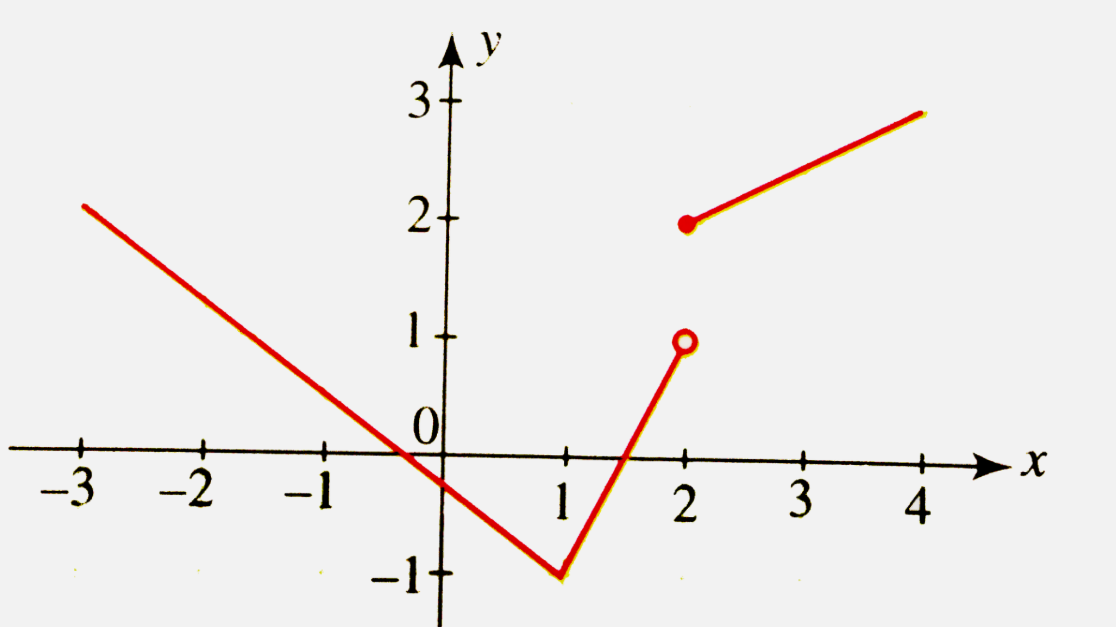
View SolutionWhich of the following graphs are graphs of a function?
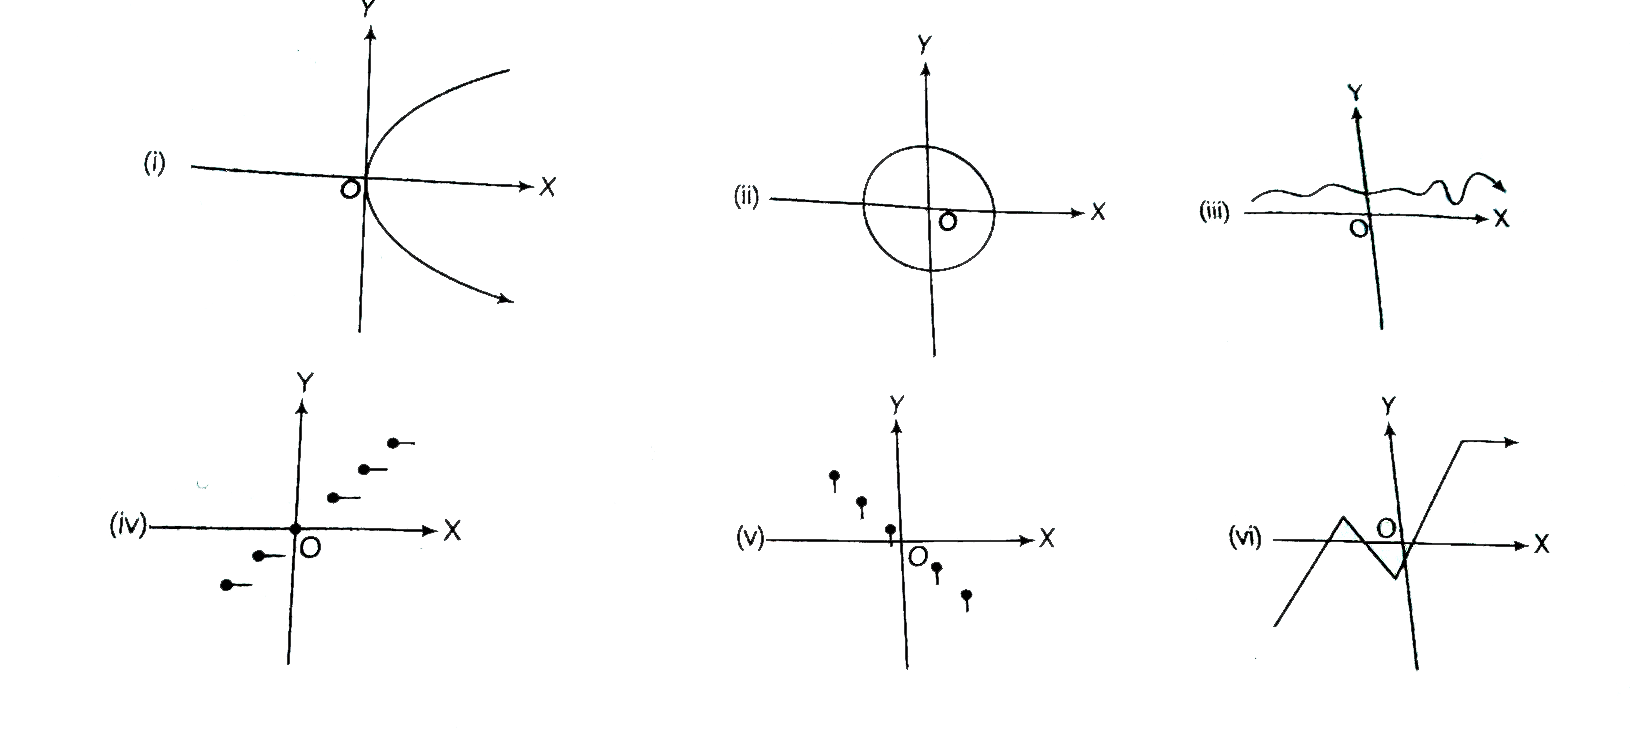
View SolutionWhich one of the following graphs represent a function? (FIGURE)
View SolutionWhich of the following graphs represents exothoermic reaction?
View Solution
