Which one
of the following is not the graphical representation of statistical data:
a)bargraph
(b) Histogram
c]Frequencypolygon
(d) Comulative
frequency distribution
To solve the question "Which one of the following is not the graphical representation of statistical data?", we will analyze each option provided.
1. Understand the Options:
- We have four options:
a) Bar graph
b) Histogram
c) Frequency polygon
d) Cumulative frequency distribution
2. Define Each Option:
- Bar Graph: A bar graph is a graphical representation of data using bars of different heights or lengths to show the values of different categories. It is a common way to display categorical data.
- Histogram: A histogram is a type of bar graph that represents the frequency distribution of numerical data. It shows the number of data points that fall within specified ranges (bins).
- Frequency Polygon: A frequency polygon is a graphical representation that uses line segments to connect points representing the frequencies of different intervals. It is often used to show the distribution of a dataset.
- Cumulative Frequency Distribution: This is a method of displaying the cumulative frequencies for a dataset, but it does not have a specific graphical representation. Instead, it is often represented in a table format or can be plotted as a cumulative frequency curve.
3. Identify the Non-Graphical Representation:
- Among the options, the cumulative frequency distribution does not have a standard graphical representation like the other three options (bar graph, histogram, and frequency polygon). While it can be represented graphically as a cumulative frequency curve, the term itself refers to a method of organizing data rather than a specific type of graph.
4. Conclusion:
- Therefore, the option that is not a graphical representation of statistical data is (d) Cumulative frequency distribution.
Final Answer:
The answer is (d) Cumulative frequency distribution.
---
- We have four options:
a) Bar graph
b) Histogram
c) Frequency polygon
d) Cumulative frequency distribution
- Bar Graph: A bar graph is a graphical representation of data using bars of different heights or lengths to show the values of different categories. It is a common way to display categorical data.
- Histogram: A histogram is a type of bar graph that represents the frequency distribution of numerical data. It shows the number of data points that fall within specified ranges (bins).
- Frequency Polygon: A frequency polygon is a graphical representation that uses line segments to connect points representing the frequencies of different intervals. It is often used to show the distribution of a dataset.
- Cumulative Frequency Distribution: This is a method of displaying the cumulative frequencies for a dataset, but it does not have a specific graphical representation. Instead, it is often represented in a table format or can be plotted as a cumulative frequency curve.
- Among the options, the cumulative frequency distribution does not have a standard graphical representation like the other three options (bar graph, histogram, and frequency polygon). While it can be represented graphically as a cumulative frequency curve, the term itself refers to a method of organizing data rather than a specific type of graph.
- Therefore, the option that is not a graphical representation of statistical data is (d) Cumulative frequency distribution.
The answer is (d) Cumulative frequency distribution.
Topper's Solved these Questions
Similar Questions
Knowledge Check
Which one of the following is not the correct representation?
AE∘cell = Red. Pot. Of cathode + Oxide pot. of anodeBE∘cell = Red. Pot of cathode - Oxid. pot. of anodeCE∘cell = Red. Pot. Of cathode + Red. pot. of anodeDE∘cell = Red. Pot of cathode - Red. pot of anodeWhich one of the following is the diagrammatic representation of a nucleotide?
A B
B C
C D
D
Which one of the following is the diagrammatic representation of a nucleotide?
A B
B C
C D
D
Which of the following is shown a graphical representation of cumulative frequency data ?
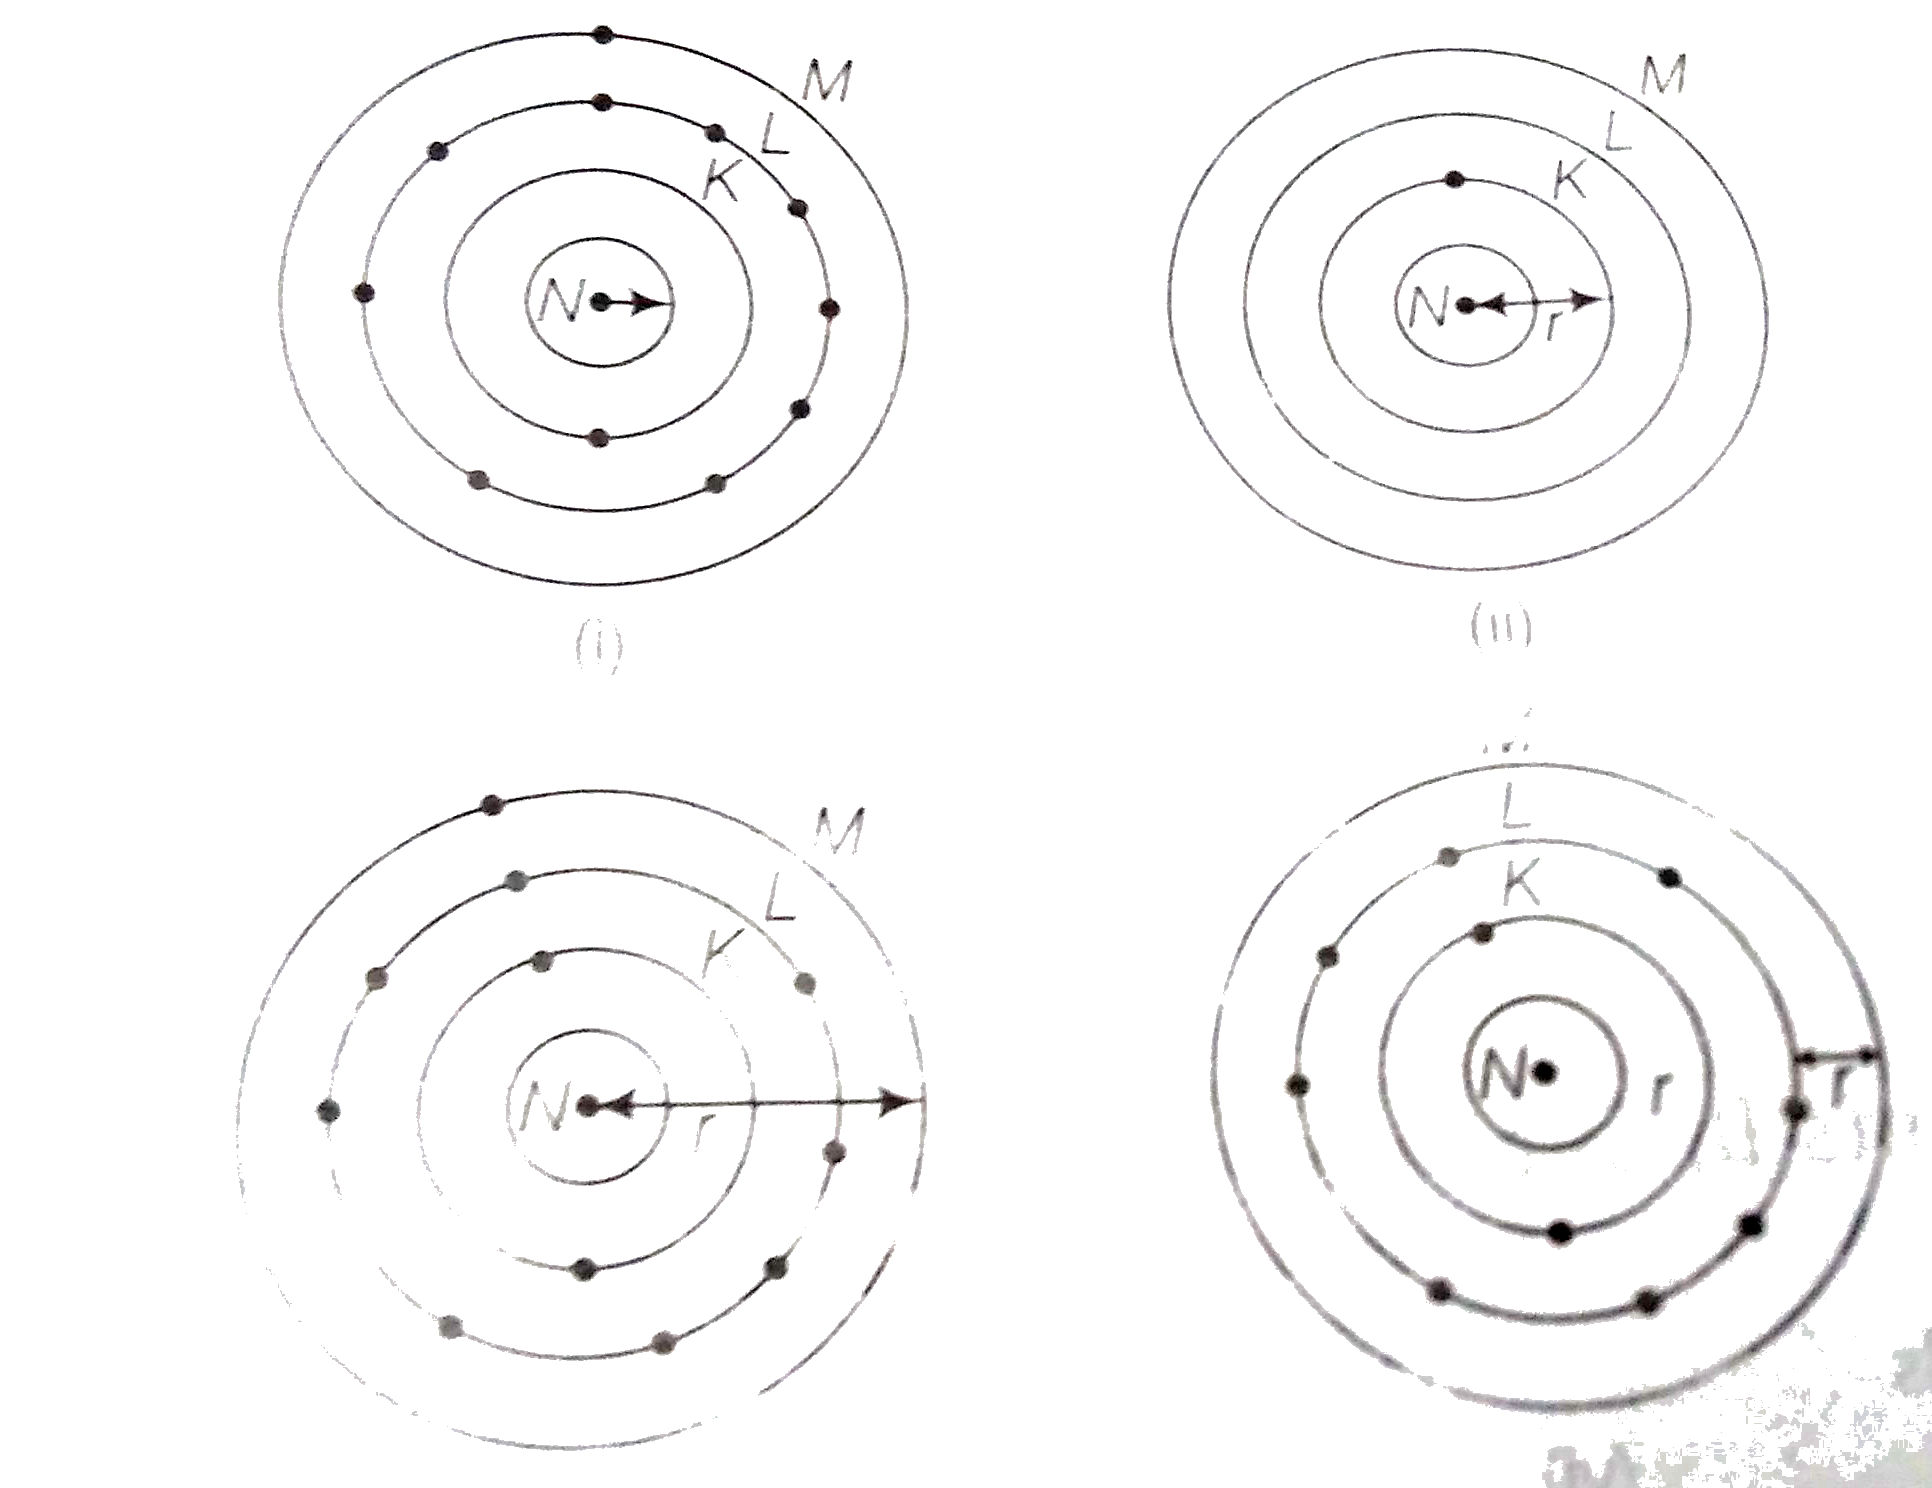
View SolutionWhich one of the following depict the correct representation of atomic radius (r) of an atom ?

View SolutionWhich one of the following depict the correct representation of atomic radius (r) of an atom ?

View SolutionWhich one of the following depict the correct representation of atomic radius (r ) of an atom?

View SolutionWhich one of the following is prerequisite to understand decimal representation of a number?
View Solution

