Complete Solutions to DIAGRAM BASED QUESTIONS of chapter PHOTOSYNTHESIS of Class 10 book with complete answers and questions
| Class 10 | BIOLOGY |
| Chapter | PHOTOSYNTHESIS |
| OSWAL GURUKUL | DIAGRAM BASED QUESTIONS |
| Number Of Questions | 6 |
| Academic Year | 2023-24 |
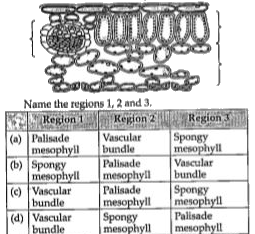
The diagram shows part of a leaf as seen in cross section under the microscope.
View SolutionCurve X on the graph shows the effect of light intensity on the rate of photosynthesis.
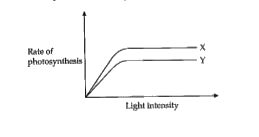
How have the conditions changed to produce curve Y?
View SolutionIn a photosynthesis experiment, a plant is left in bright sunlight for several hours. A leaf is then removed from the plant and tested for starch, using iodine solution. The diagram shows the leaf from the plant that was used in the experiment.

Which diagram shows the result of the experiment?
View SolutionThe diagram below shows two test-tubes A and B. Test-tube A contains a green water plant. Testtube B contains both a green water plant and a snail. Both Test-tubes are kept in sunlight.
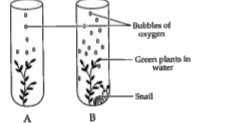
Which water plant can be used in the above experiment?
View SolutionA twig of a plant was kept inside a flask as shown is the diagram and it was kept in sunlight for a few hours.
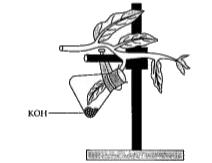
What is the aim of the experiment ?
View SolutionA potted plant with variegated leaves was taken in order to prove a factor necessary for photosynthesis. The potted plant was kept in the dark for 24 hours and then placed in bright sunlight for a few hours. What aspect of photosynthesis is being tested in the below diagram?
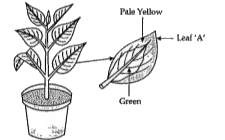
View Solution
DIAGRAM BASED QUESTIONS questions and complete solutions for chapter PHOTOSYNTHESIS of EVERGREEN BIOLOGY (ENGLISH) of Class 10