Complete Solutions to Solved Examples of chapter STATISTICS of Class 10 book with complete answers and questions
| Class 10 | MATHS |
| Chapter | STATISTICS |
| NAGEEN PRAKASHAN | Solved Examples |
| Number Of Questions | 37 |
| Academic Year | 2023-24 |
Find the mean of the following frequency distribution by direct method.

View SolutionFind the mean of the following table by direct method:

View SolutionFind the mean form the following table by direct method :

View SolutionIf the mean of the following data is 26, then find the value of p:

View SolutionFind the value of p, if the mean of the following distribution is 18 :

View SolutionFind the mean from the following data :

View SolutionFind the mean for the following distribution table by short cut method:

View SolutionFind the mean from the following distribution table using short cut method :

View SolutionThe height of 84 tress is given in the following table. Find the their arithmetic mena by short cut method :

View SolutionThe age of 40 student of a class is given in the following table. Find their mean short cut method:

View SolutionFind the mean of the following table by step deviation method :

View SolutionFind the mean of the following table by step dcviation method :

View SolutionThe makes obtained by 30 students are given in the following table. Find their mean by step deviation method :

View SolutionFind the mean from the following table using step deviation method :

View SolutionFind the mean for the following data by step-deviatiion method :

View SolutionFind the mean for the following frequency distribution :

View SolutionFind the class limits corresponding to each frequency if the mean of the following distribution is 33 and assumed mean 35 :

View SolutionFind the mediaan from the following table :

View SolutionFind the median from the following table :

View SolutionFind the median from the following table :

View SolutionFind the median from the following data :

View SolutionMarks of 40 student in a test out of maximum 50 marks are as follow :

View SolutionFind the median of the following frequency distibution :

View SolutionFind the median for the following frequency distribution:

View SolutionFind the median for the following data :

View SolutionFind the missing frequency if the median for the given distribution is 24:

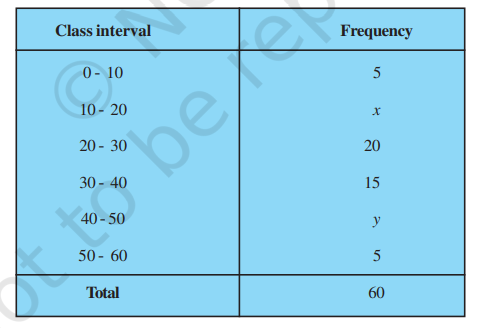
View SolutionIf the median of the distribution given below is 28.5, find the values of x and y.

View SolutionCompute the mode for the following frequency distribution :

View SolutionCalculate the value of mode for the following frequency distribution :

View SolutionThe mode of the following series is 17.3 . Find the missing frequecny :

View SolutionA survey reagarding the heights ( in cm) of 50 girls of class X of a school was conducted and the following data was obtained.

Find the mean, median and mode of the above data.
View SolutionFind the mean median of the following frequency distrbution :

Also, find the mode of the following data.
View SolutionDraw a less than cumuative frequency curve (ogive) for the following distribution :

View SolutionIn a study of the cases of diabetes the following data was obtained.

Draw a less than ogive for above data .
View SolutionConstruct a less than ogive and a more than ogive from the following data :

View SolutionDuring the medical checkup of 35 students of a class their weight were recorded as follows :

Draw a less than type a more than type ogive from the given data. Hene obtain the median weigth from the graph.
View SolutionFind the median for the following distribution :

View Solution
Solved Examples questions and complete solutions for chapter STATISTICS of NAGEEN MATHS (HINGLISH) of Class 10