Complete Solutions to Check point 3.6 of chapter MOTION IN A PLANE of Class 11 book with complete answers and questions
| Class 11 | PHYSICS |
| Chapter | MOTION IN A PLANE |
| DC PANDEY NEET | Check point 3.6 |
| Number Of Questions | 20 |
| Academic Year | 2023-24 |
Which of the following graph represents uniform motion
View SolutionFrom the following displacement-time graph find out the velocity of a moving body.
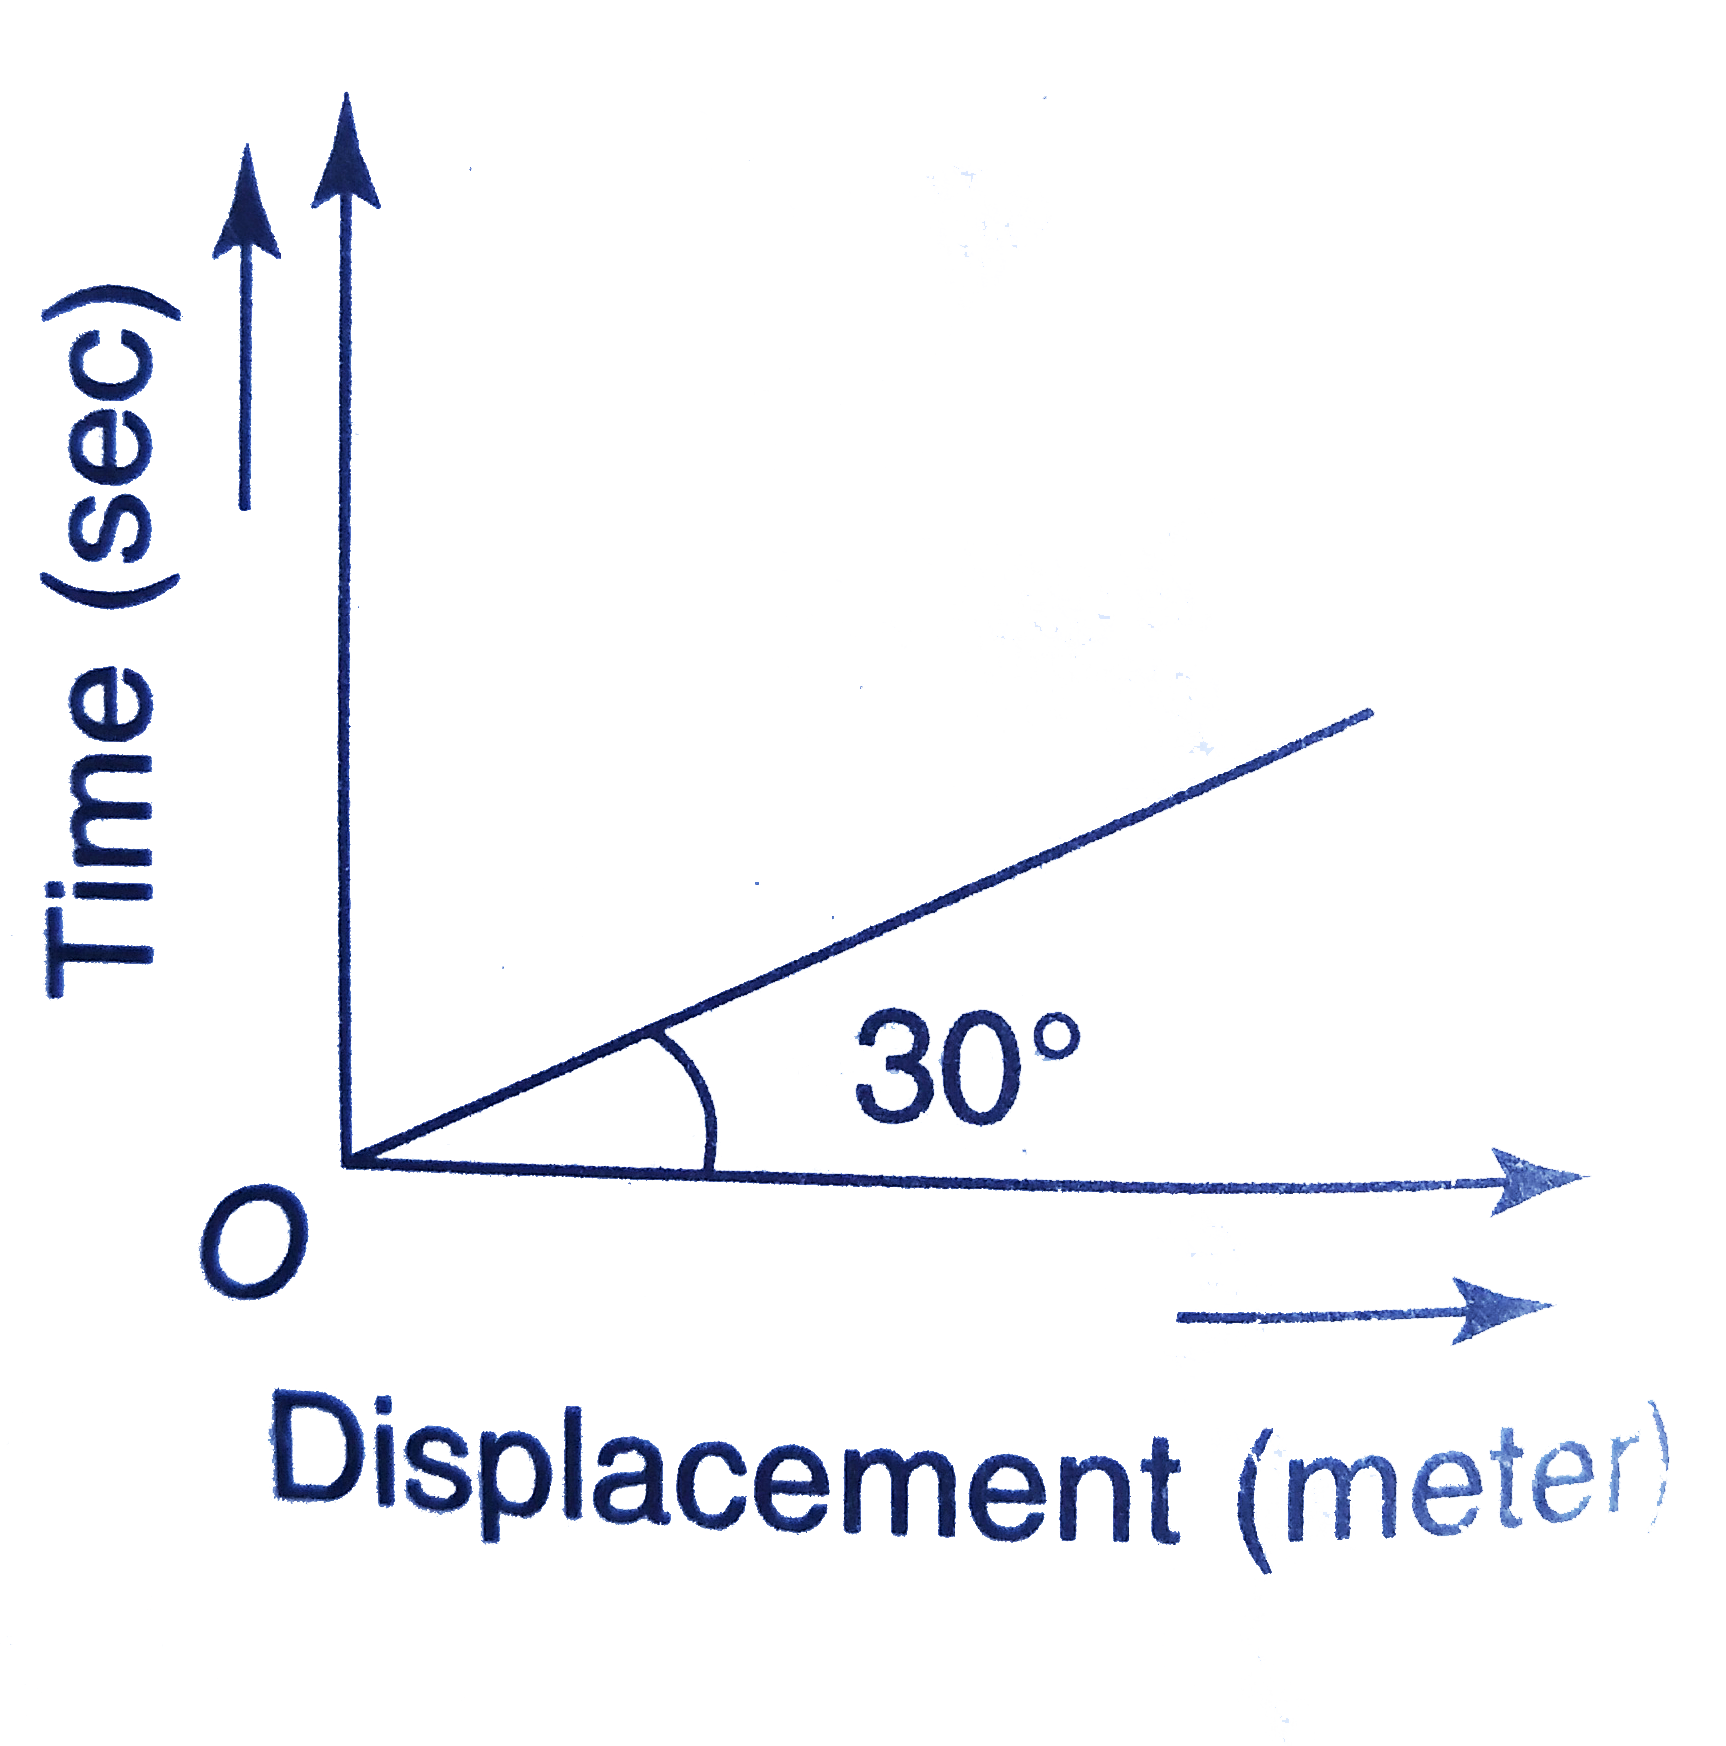
View SolutionThe distance time graph of a particle at time `t` makes angle `45^(@)` with respect to time axis. After `1s`, if makes angle `60^(@)` with respect to time axis. What is the acceleration of the particle?
View SolutionThe graph between displacement and time for a particle moving with uniform acceleration is a
View SolutionThe `v -t` graph of a moving object is given in figure. The maximum acceleration is
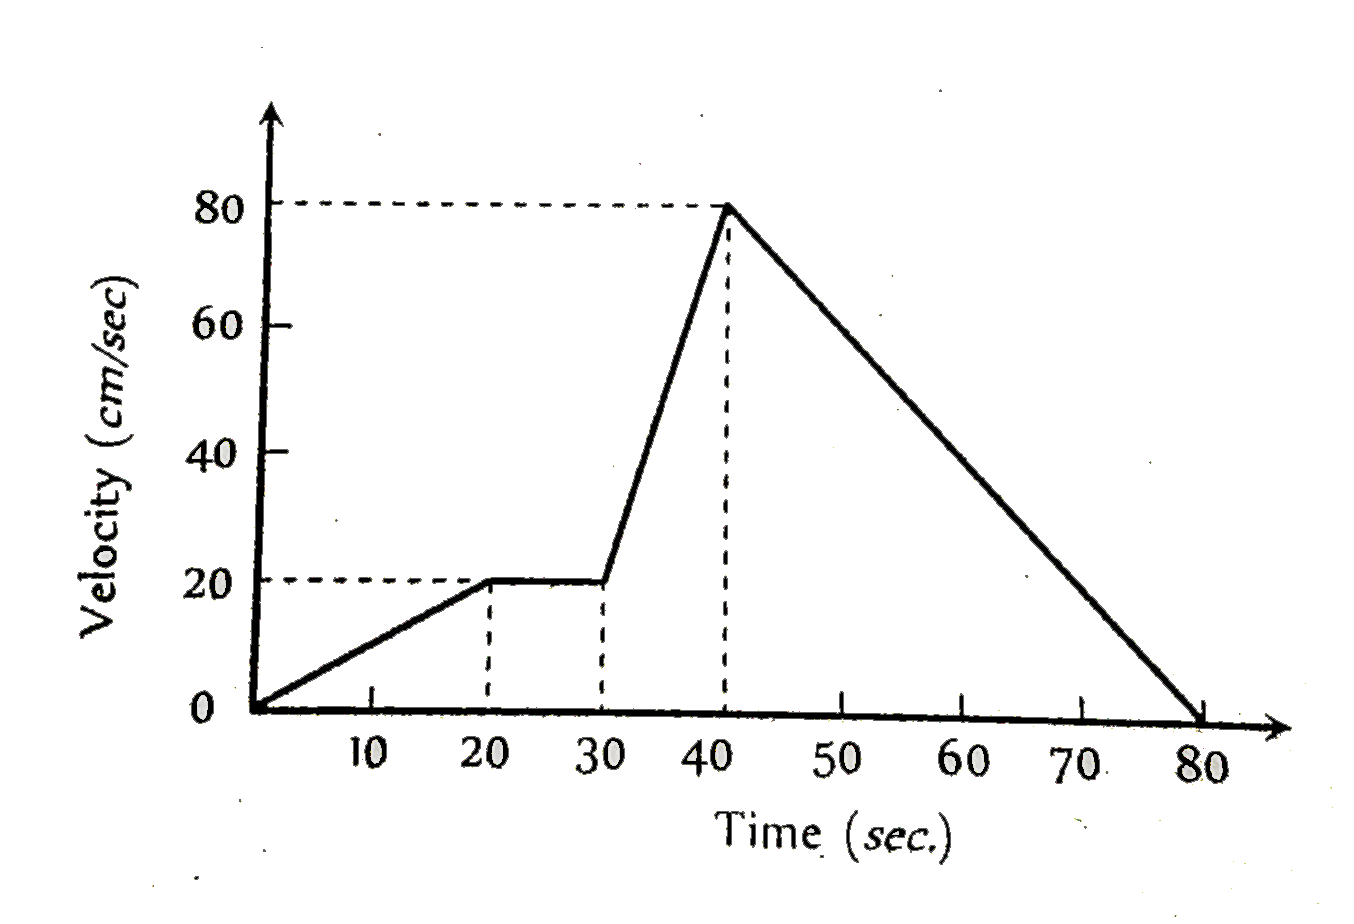
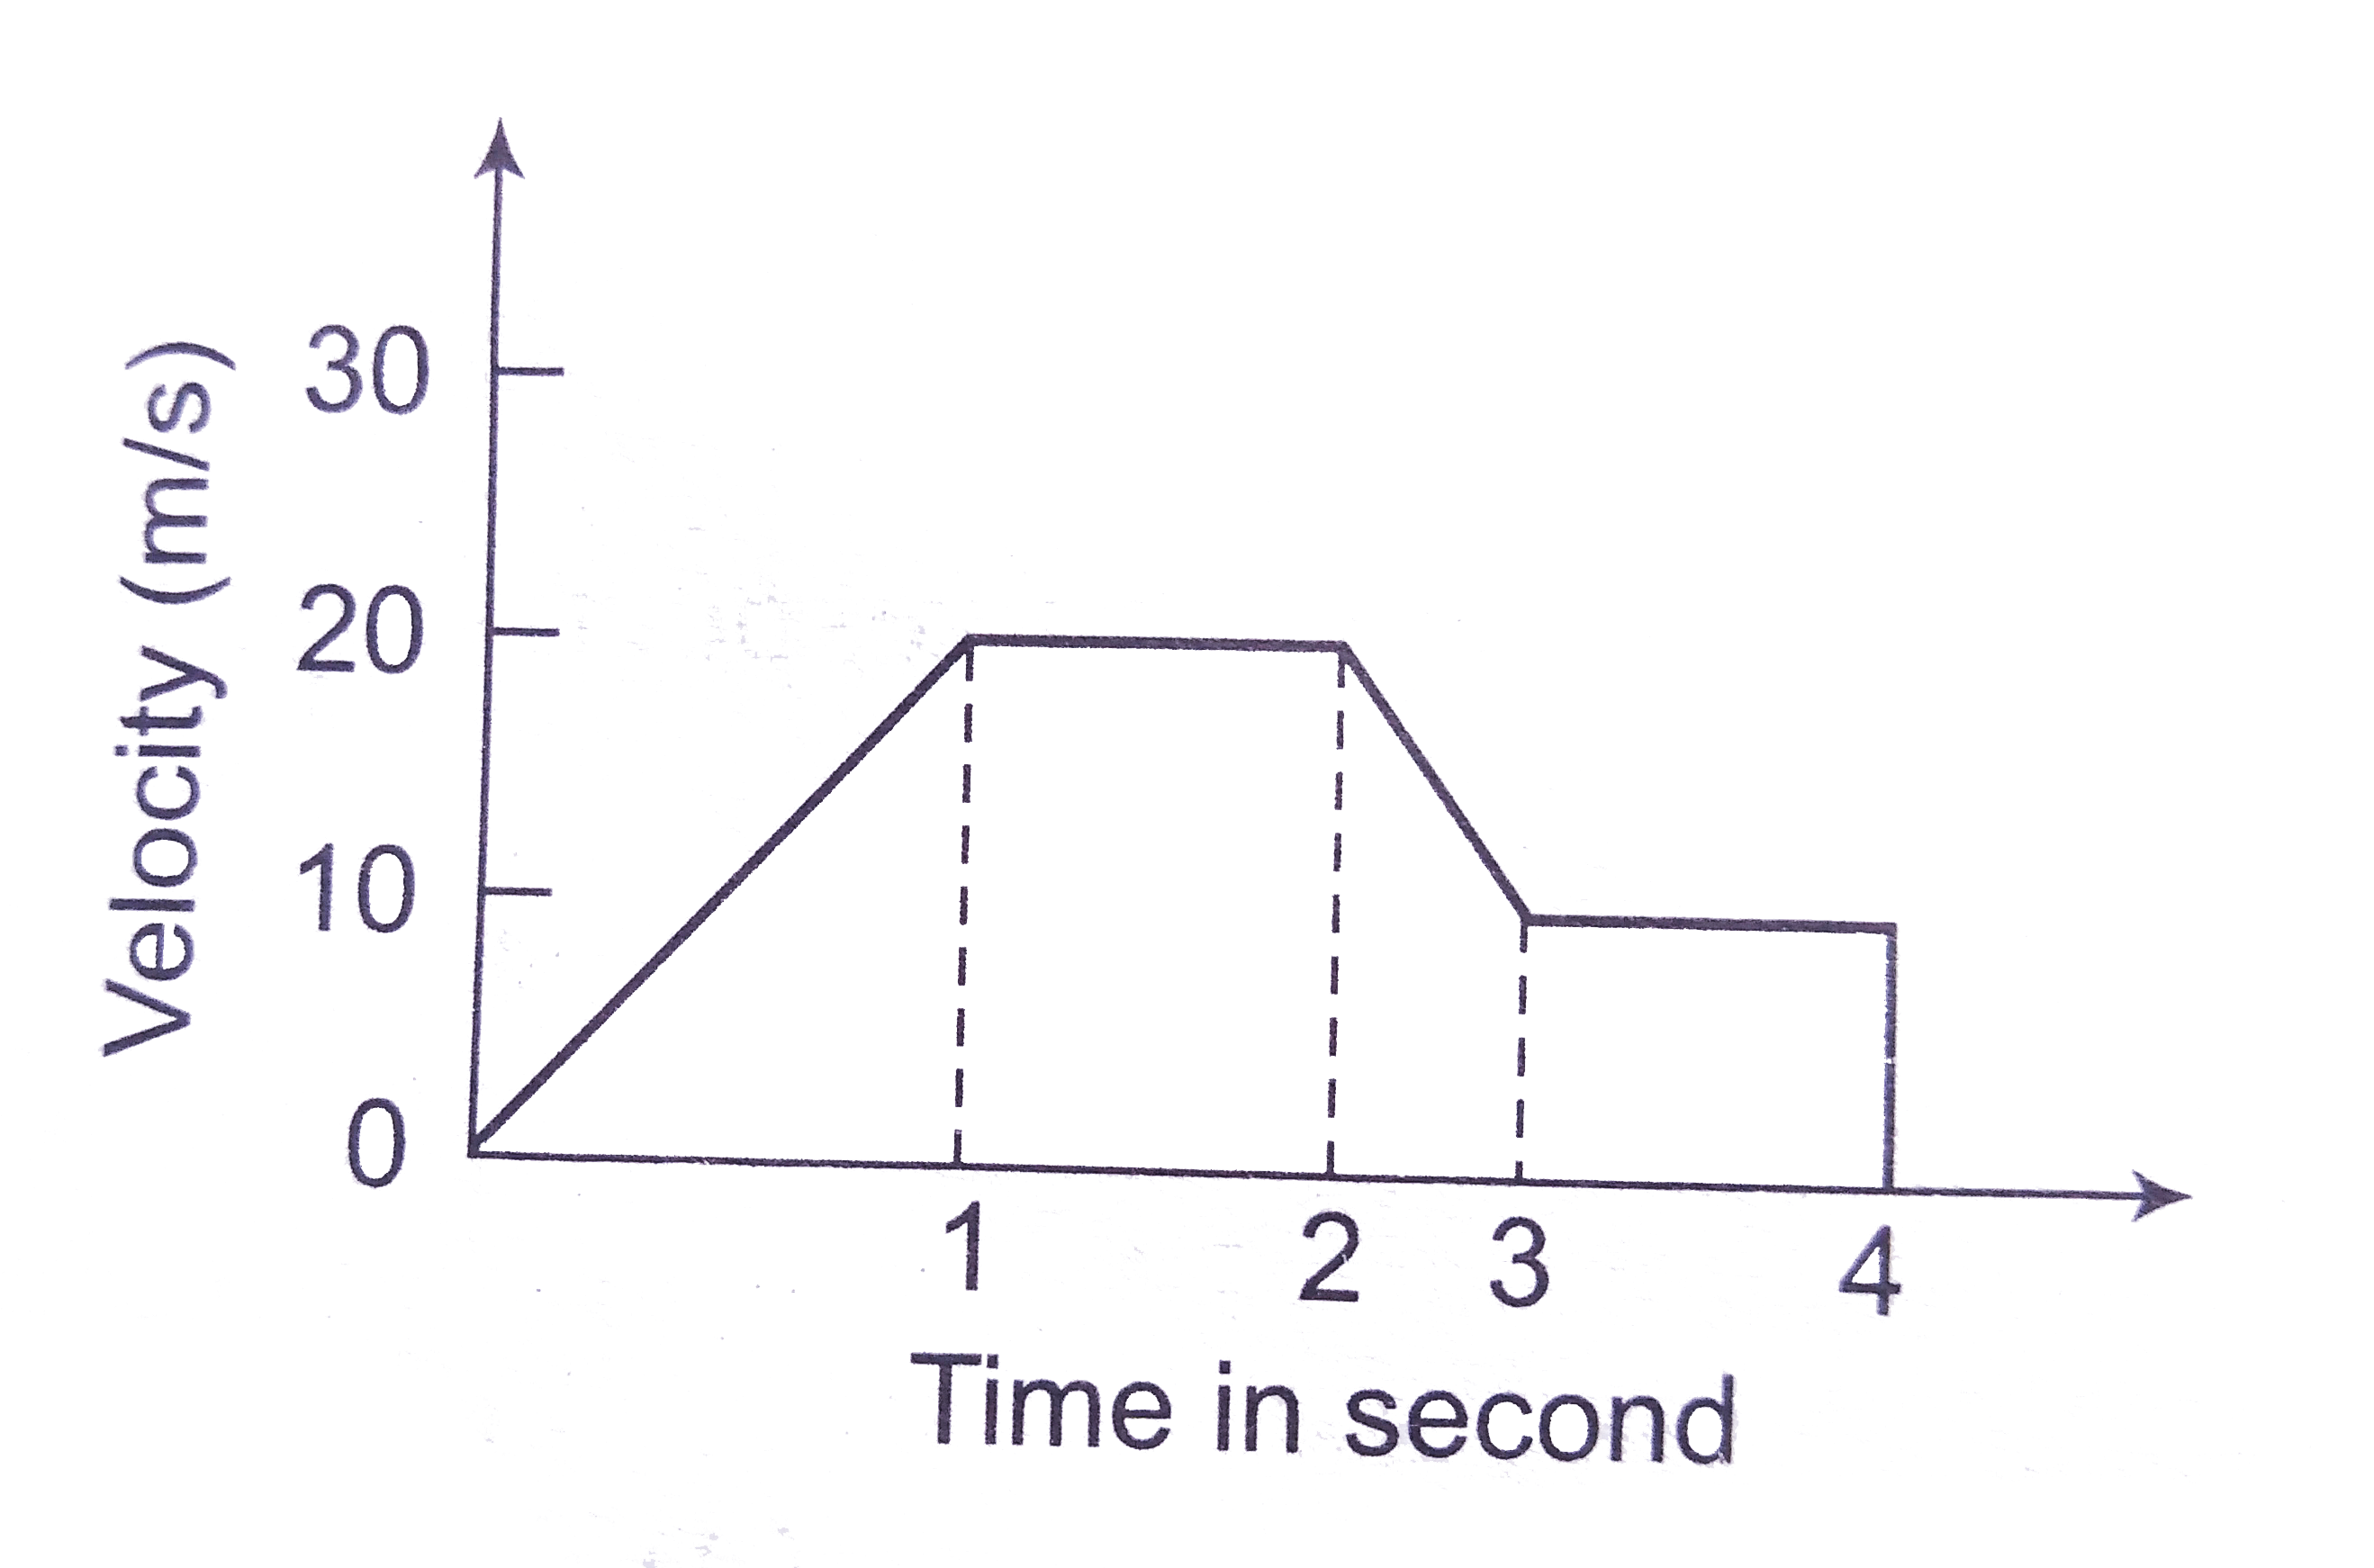
View SolutionThe variation of velocity of a particle with time moving along a straight line is illustrated in the following figure. The distance travelled by the particle in four seconds is.
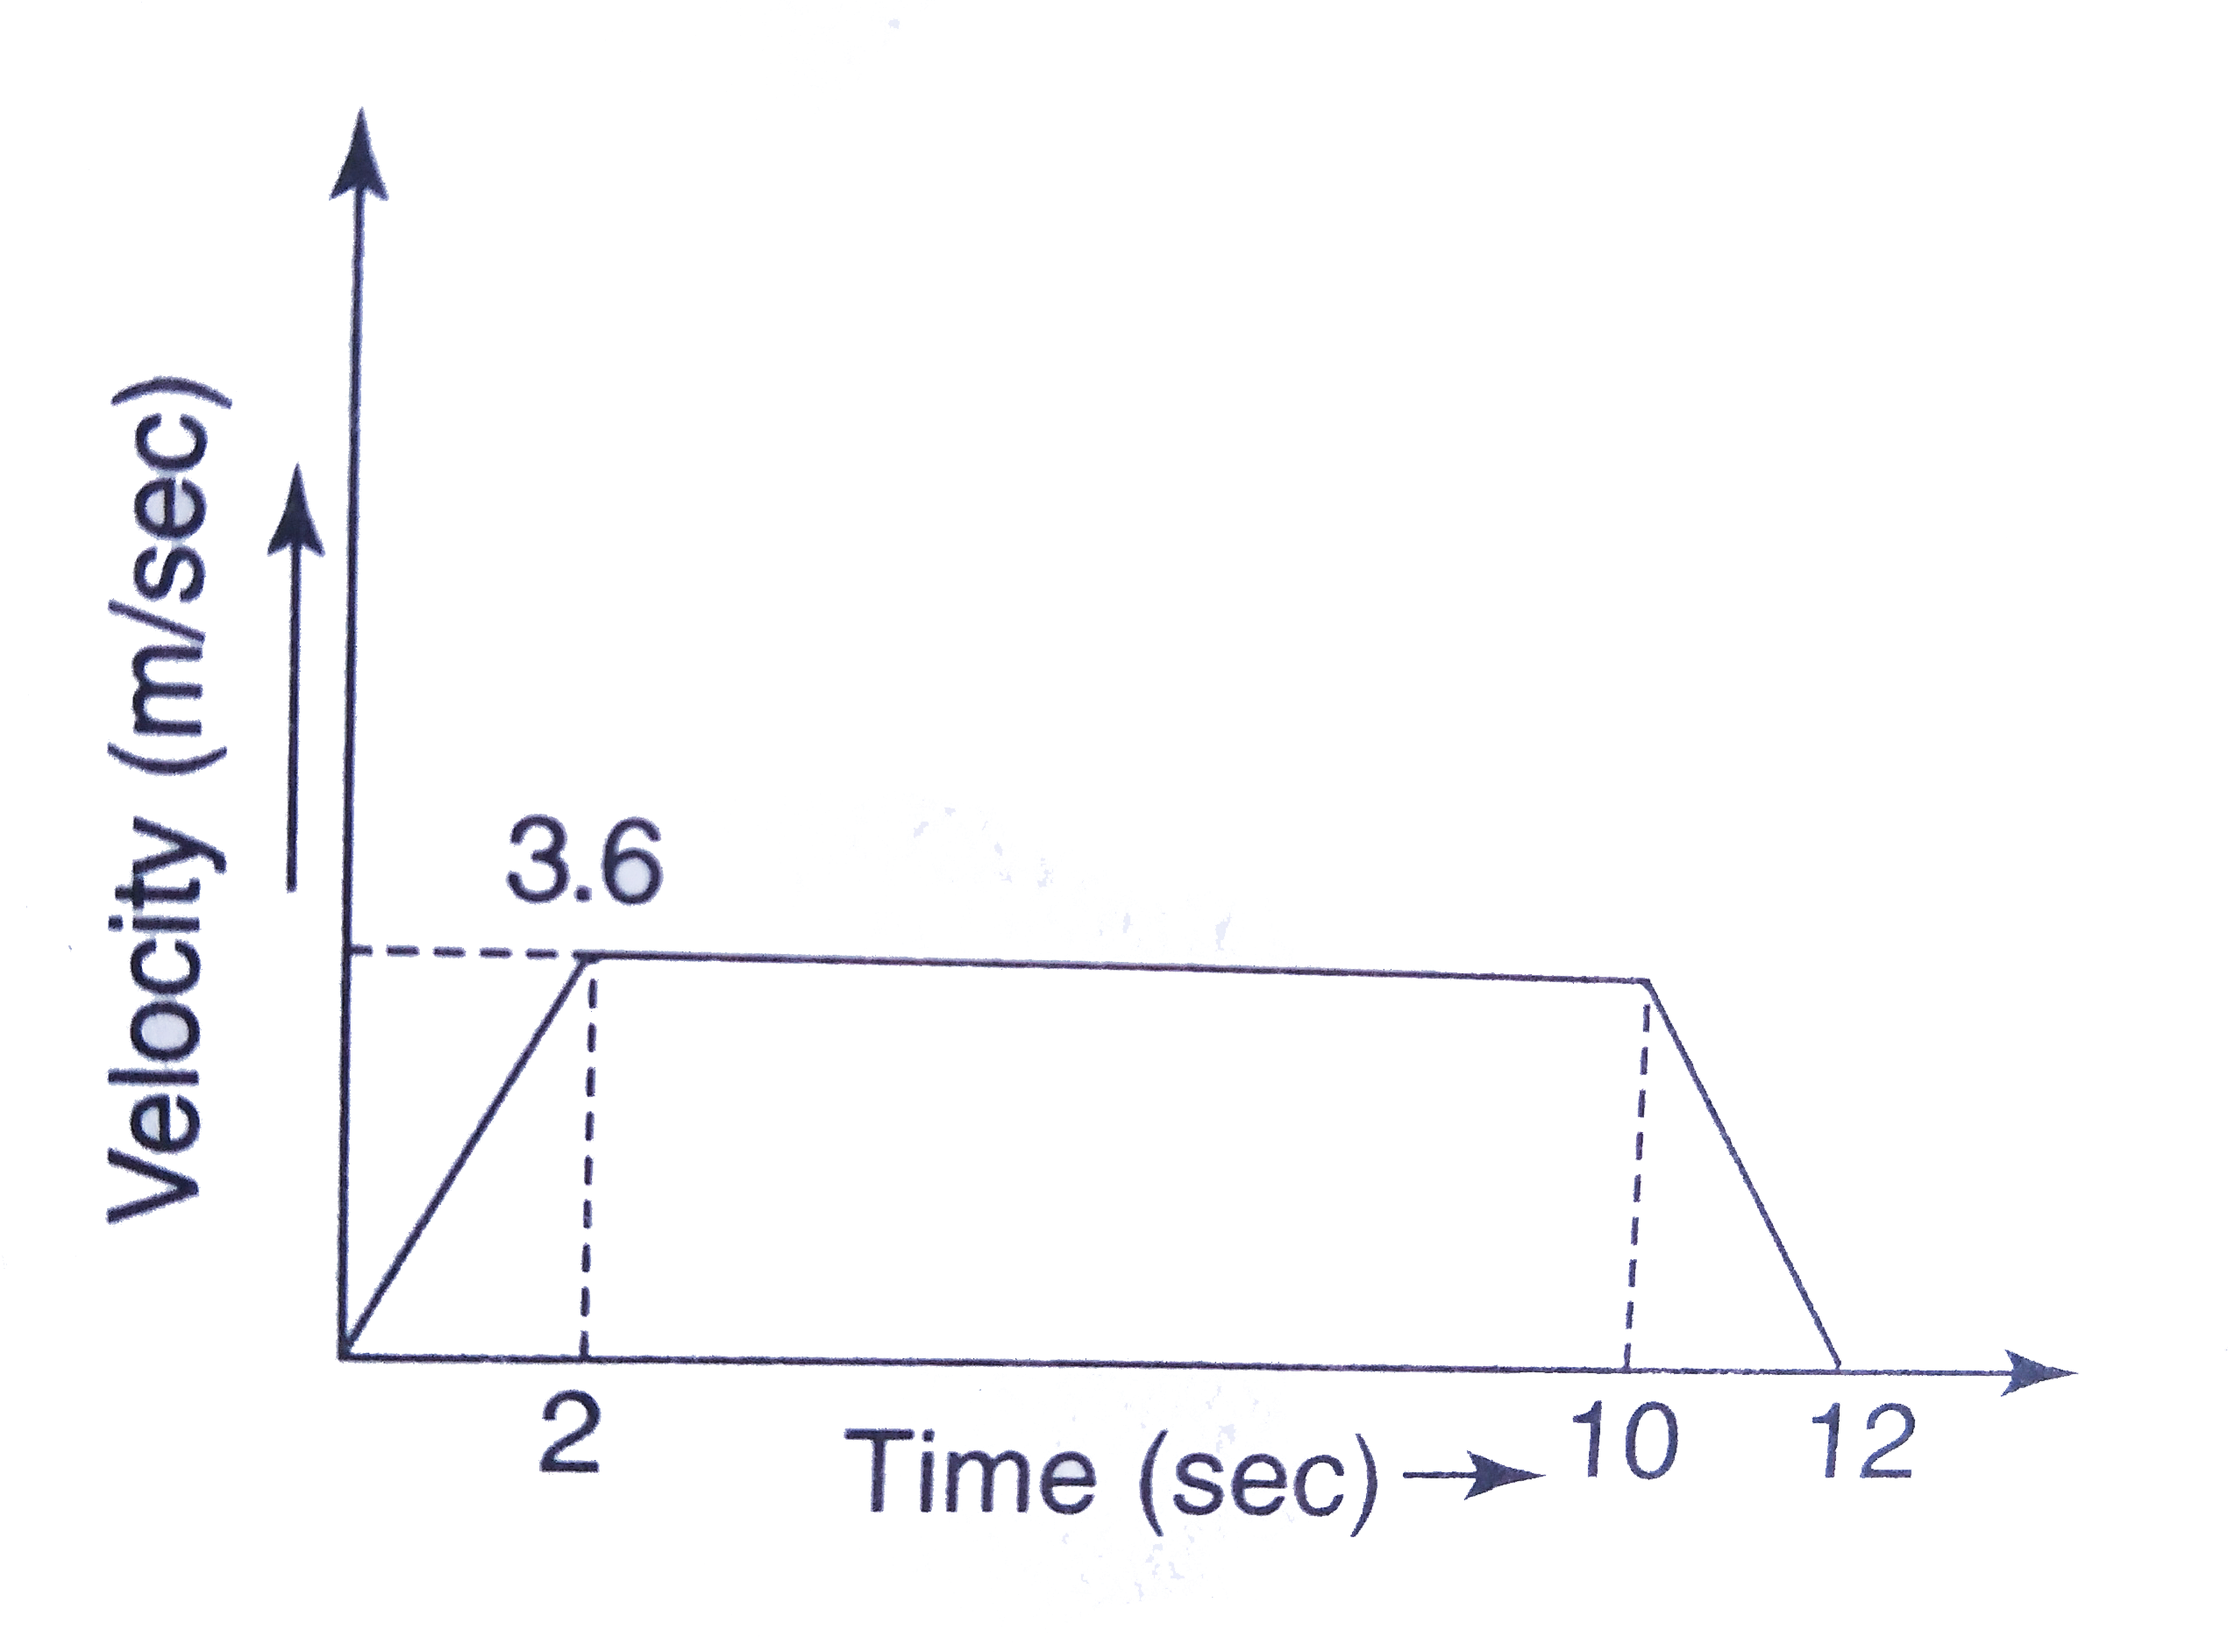
View SolutionA lift is going up. The variation in the speed of the lift is as given in the graph in the graph. What is the height to which the lift takes the passengers ?
View SolutionThe velocit-time graph of a body moving in a straight line is shown in Fig. 2 (d) . 32. Find the displacement and the distance travelled by the body in ` 6 seconds`.
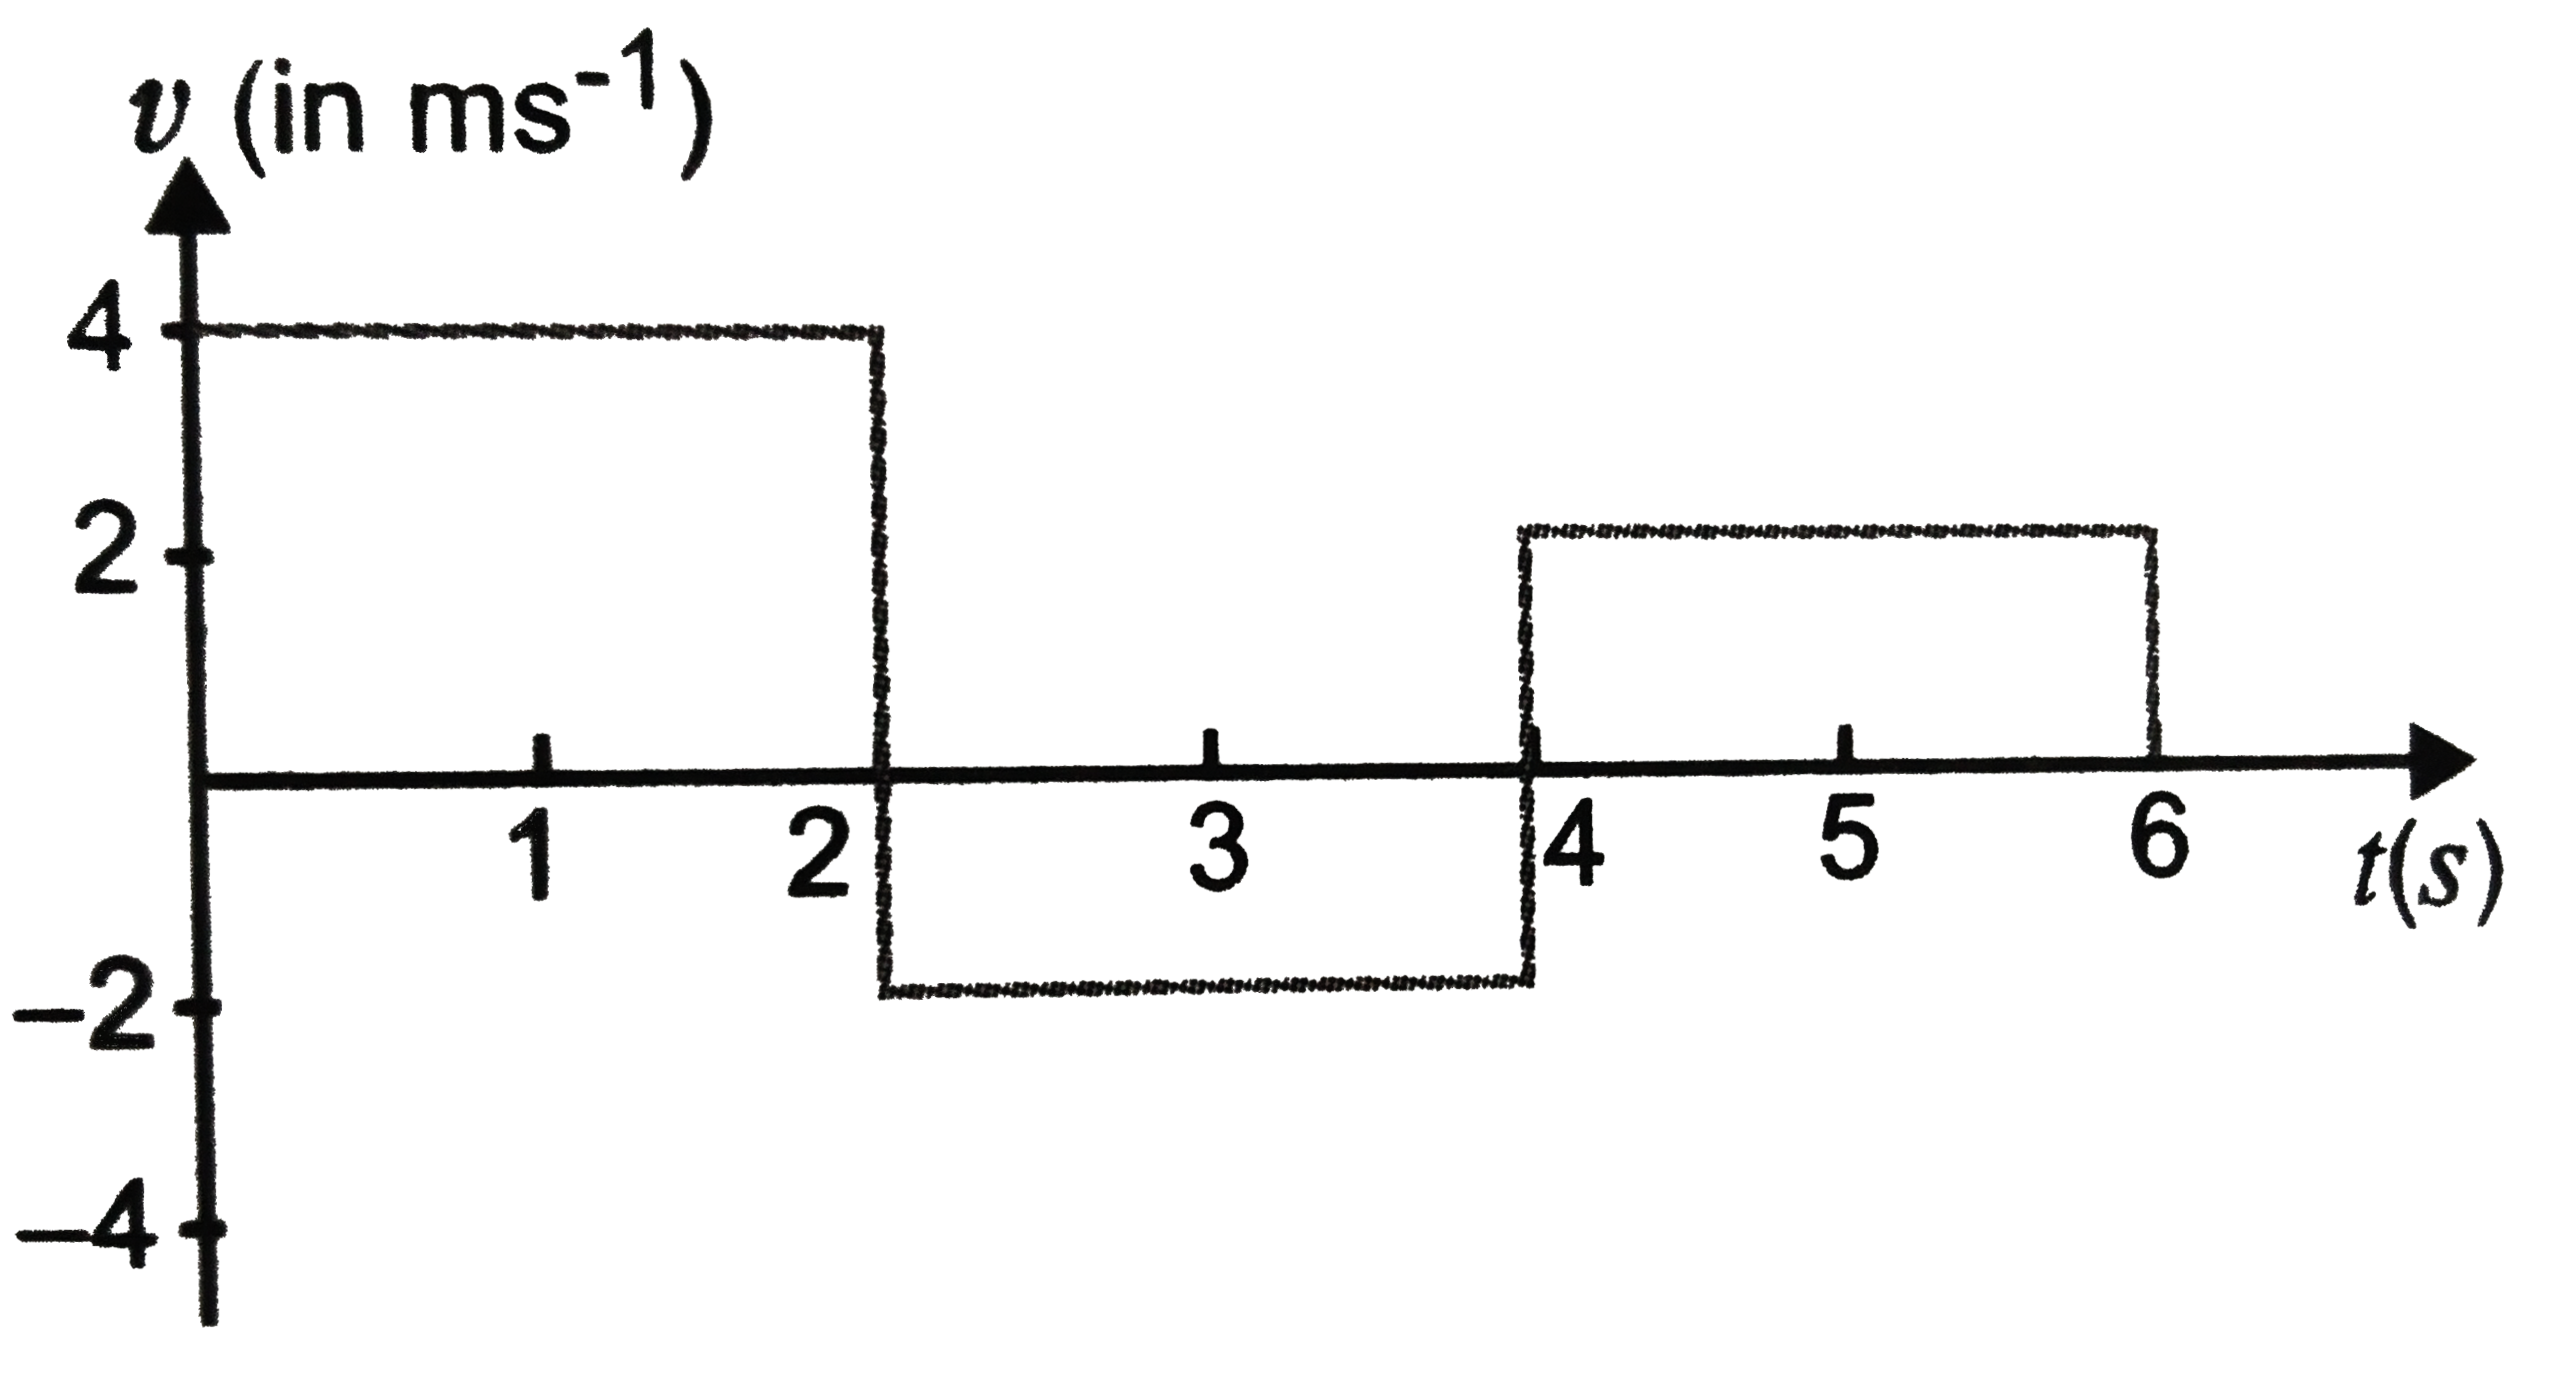 .
.
View SolutionThe x-t equation is given as `x=2t+1`. The corresponding v-t graph is
View SolutionWhich of the following graph correctly represents velocity-time relationship for a particle released from rest to fall freely under gravity ?
View SolutionA particle is thrown vertically upwards with a velocity `v`. It returns to the ground in time T. which of the following graphs correctly represents the motion ?
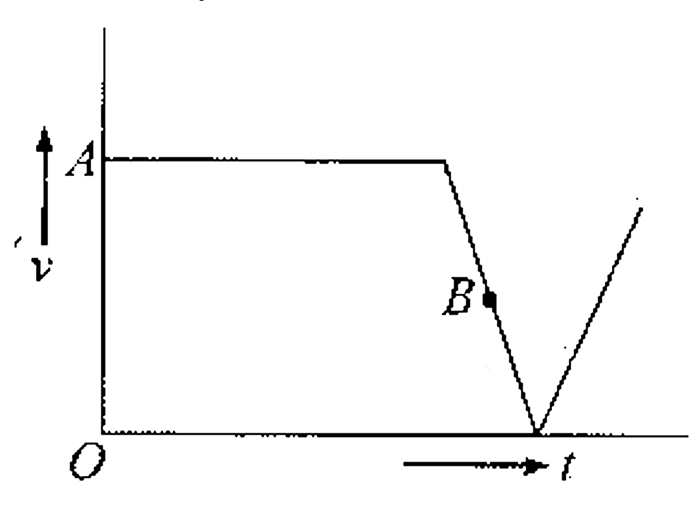
View SolutionThe following figure shows the velocity-time graph of a body. According to this, at the point B:
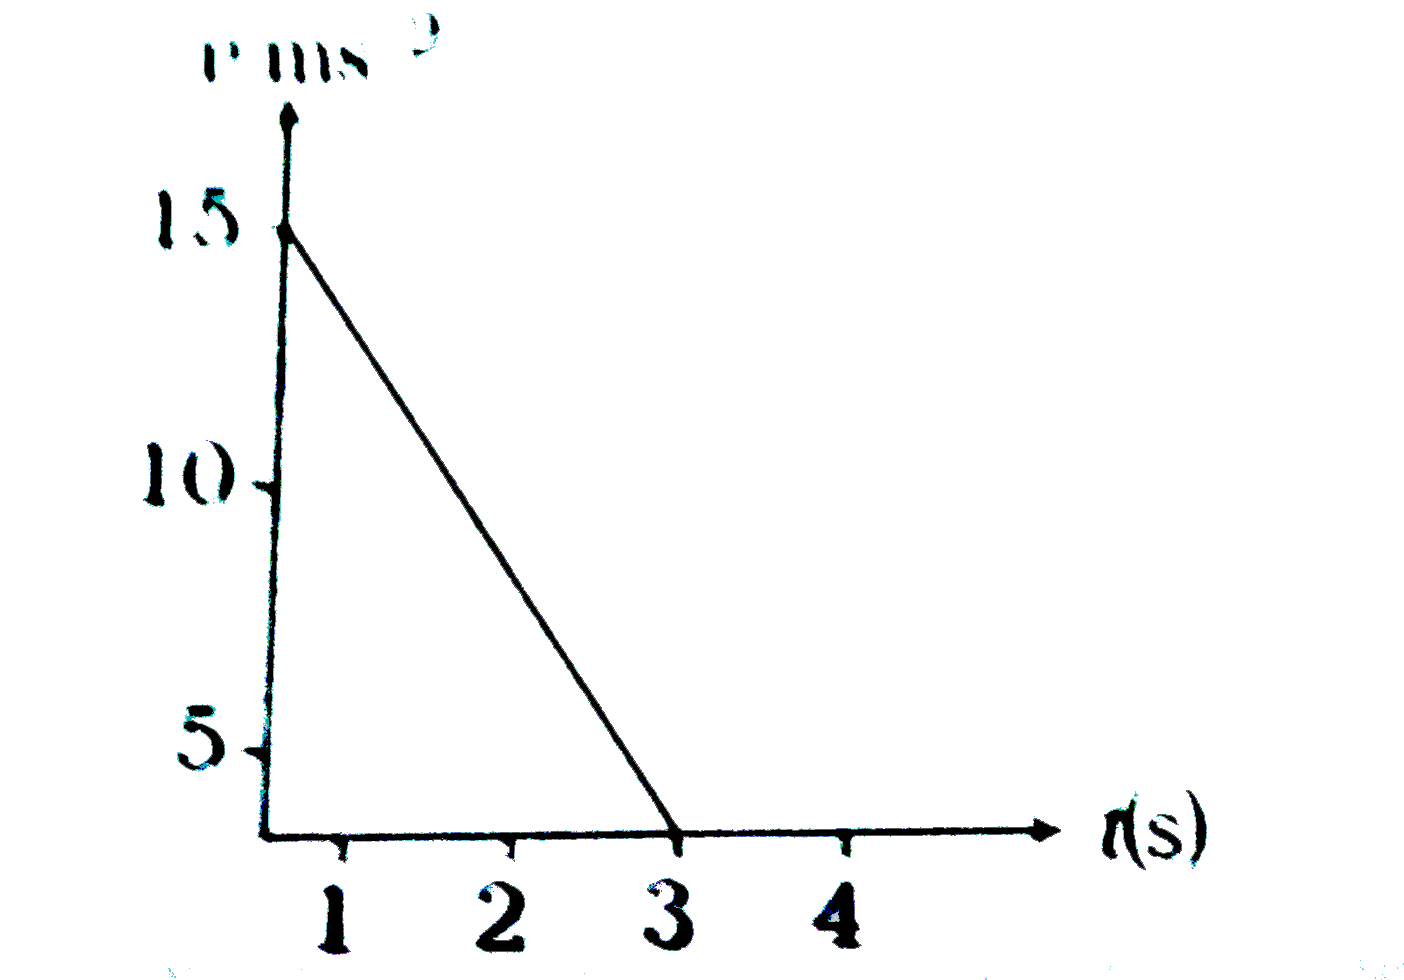
View SolutionThe velocity - time graph is shown in the figure, for a particle. The acceleration of particle is
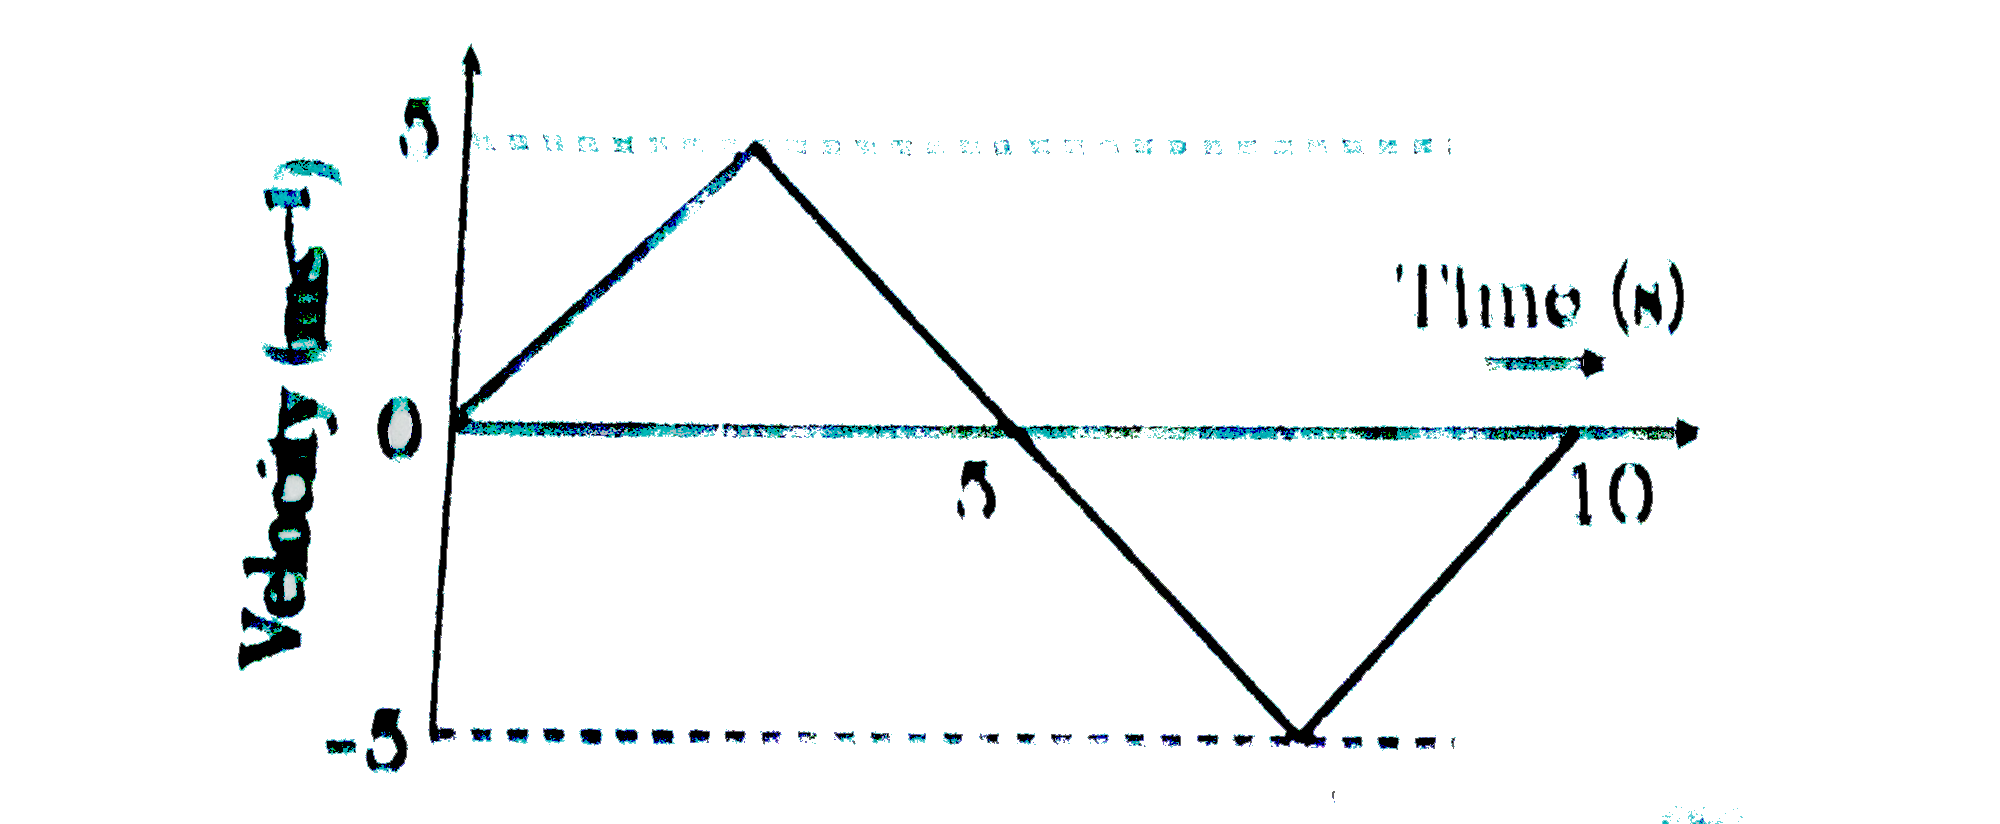
View SolutionThe v-t plot of a moving object ios shown in the figure. The average velocity of the object during the first 10 s is
View SolutionWhich of the following graphs cannot possibly represent one dimensional motion of a particle.
 .
.
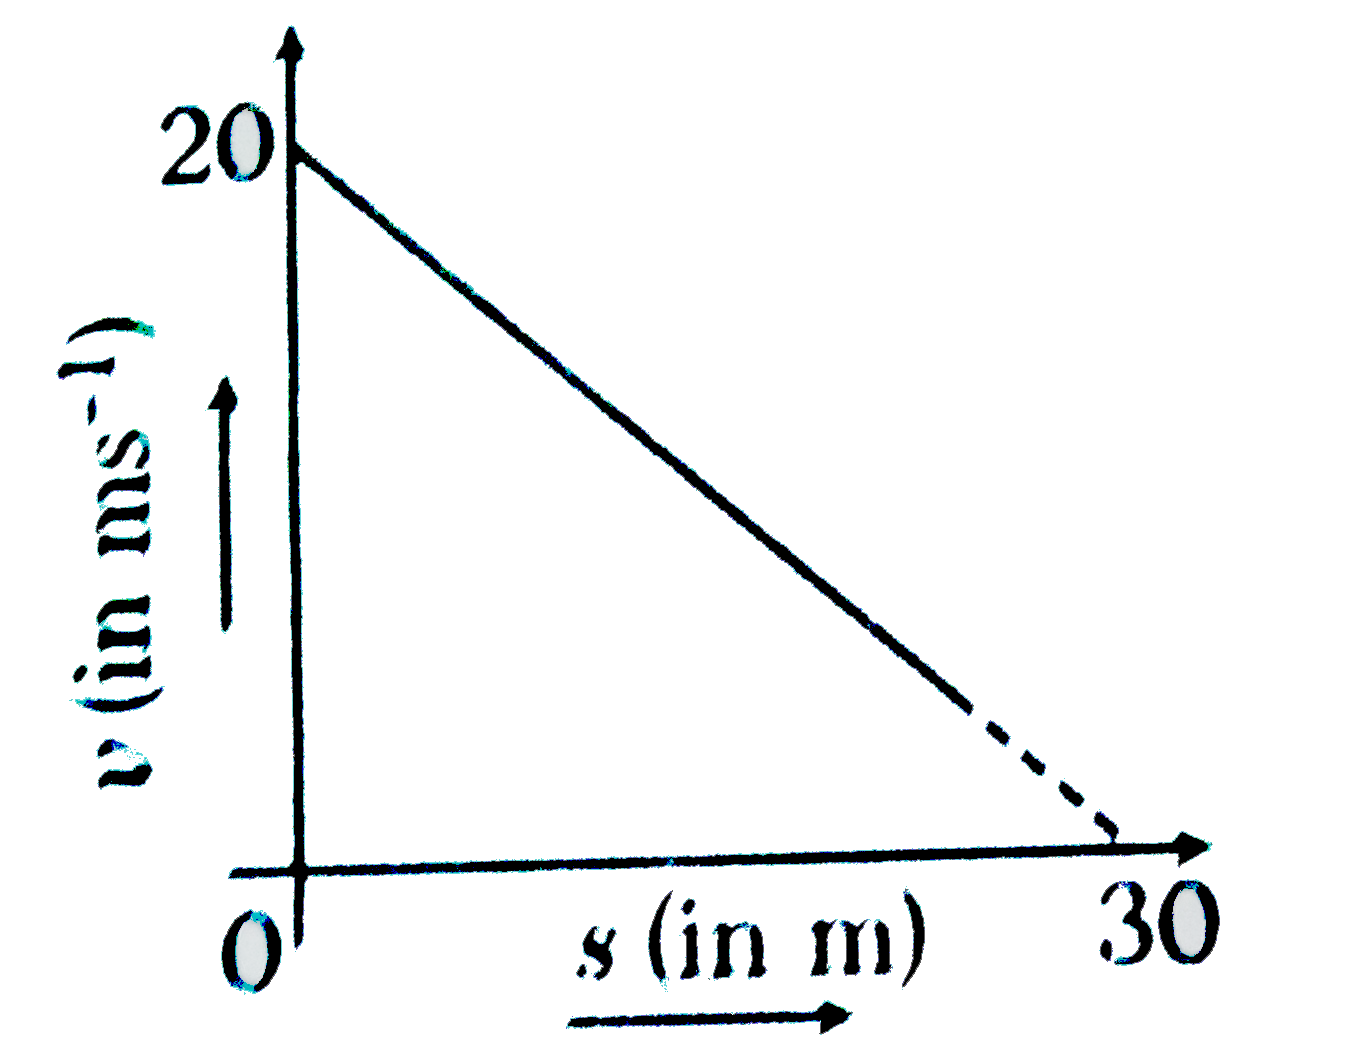
View SolutionIf the velocity v of particle moving along a straight line decreases linearly with its displacement s from `20 ms^(-1)` to a value approaching zero at s = 30 m, then acceleration of the particle at v=10ms^(-1)` is
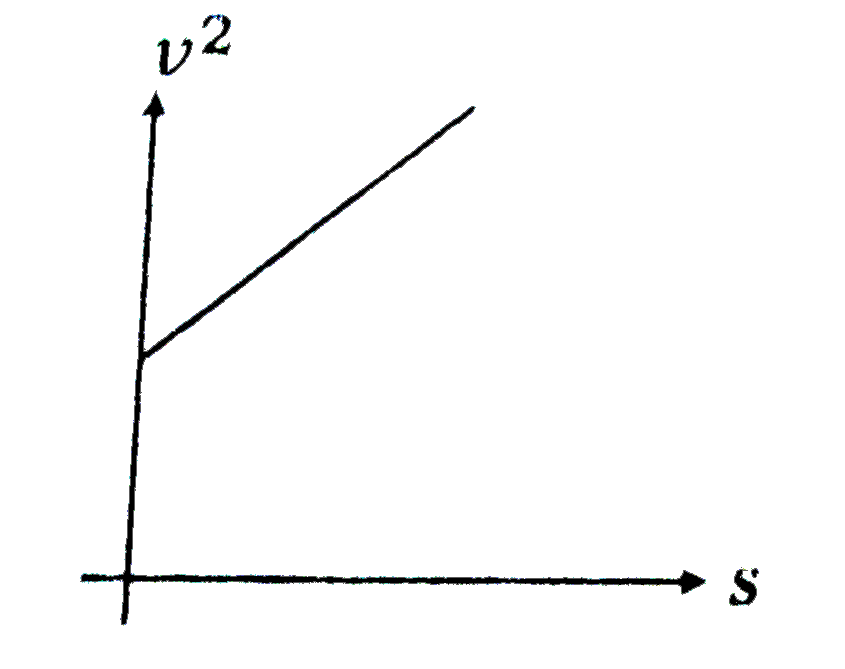
View Solution`v^(2)` versus s-graph of a particle moving in a straight line is shown in the figure. From the graph some conculsions are drawn. State which statement is wrong ?
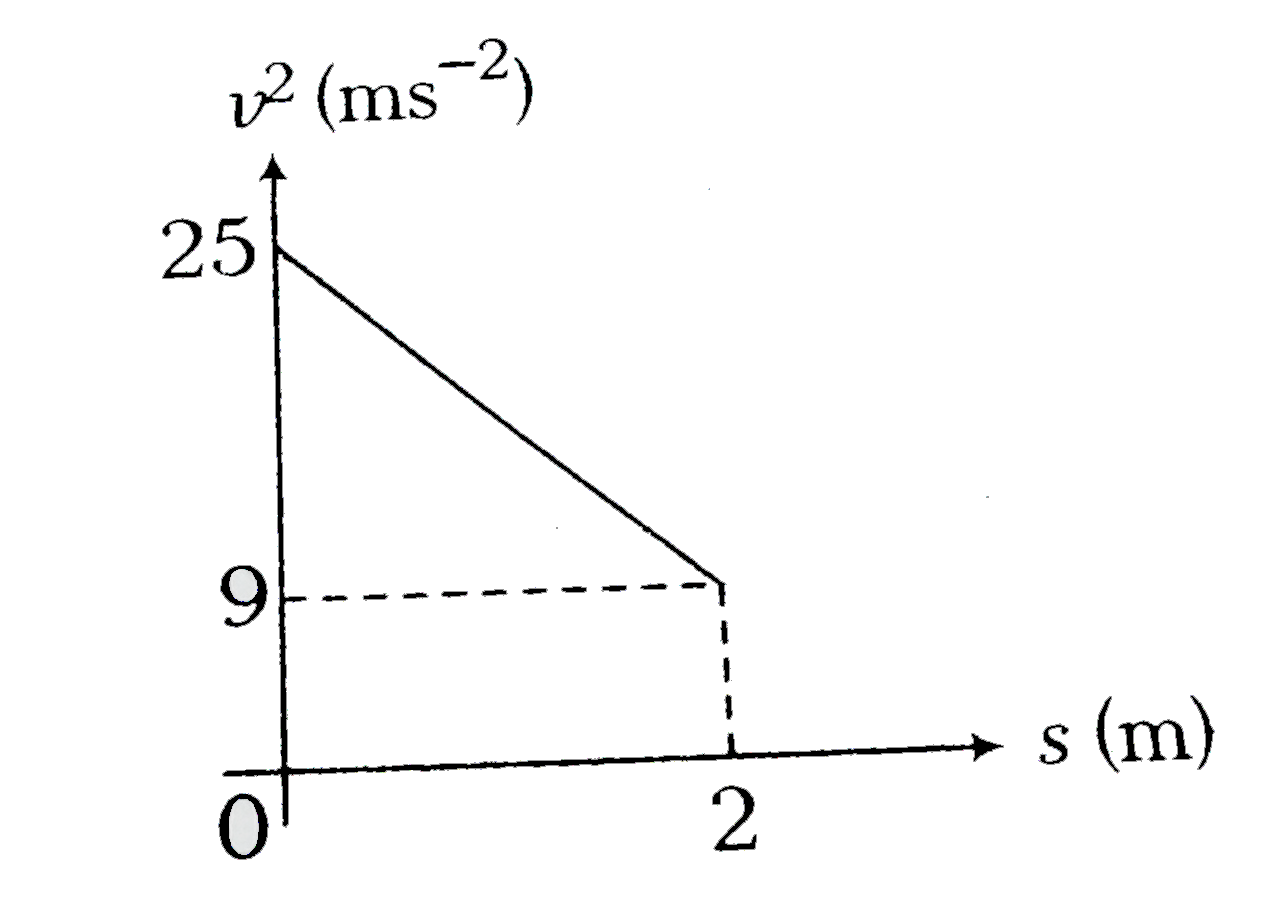
View SolutionA graph between the square of the velocity of a particle and the distance s moved by the particle is shown in the figure. The acceleration of the particle is
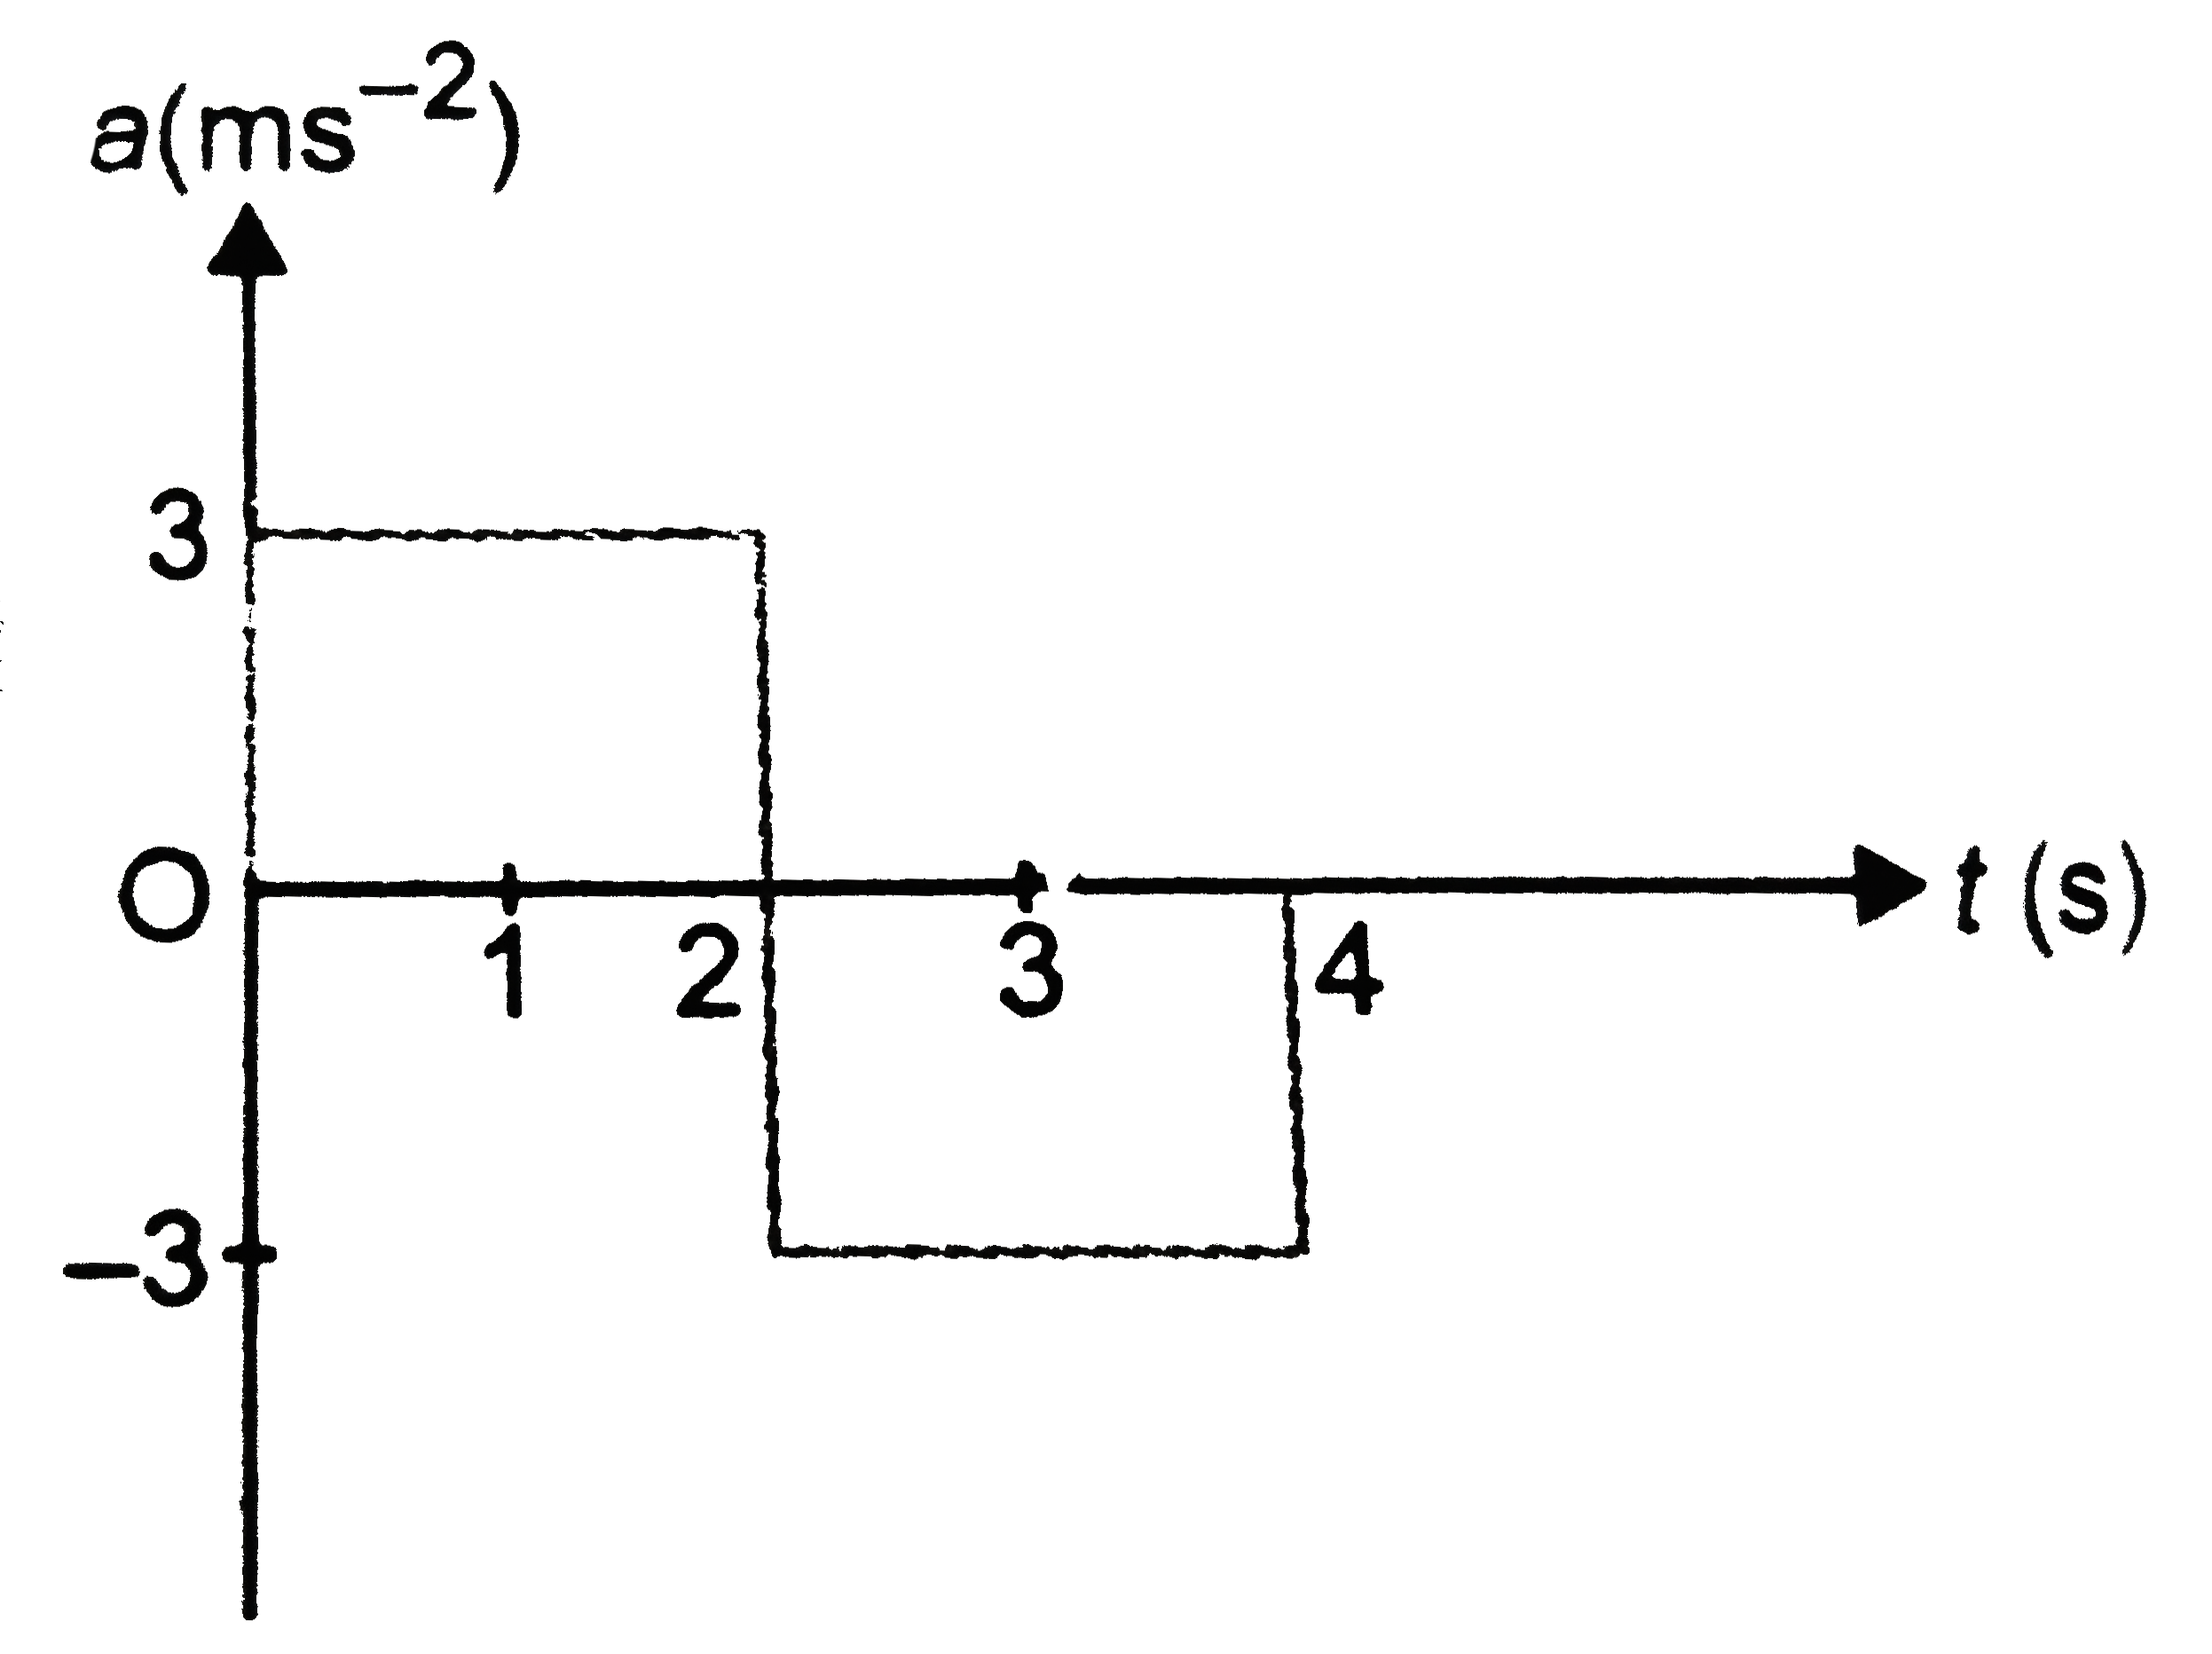
View SolutionThe area under acceleration-time graph gives
View SolutionA particle starts from rest at ` t= 0` and undergoes and acceleration (a) in `ms^(-2)` with time (t) in seconds which is shown in Fig. 2 (DF) .16 . Which one of the following plot represents velocity (v) (in `ms^(-1)`) verses time (in seconds ) ?
View Solution
Check point 3.6 questions and complete solutions for chapter MOTION IN A PLANE of DC PANDEY PHYSICS (HINGLISH) of Class 11