Complete Solutions to SET-VI: Problems on graphical aptitude of chapter MISCELLANEOUS (TOPICS OF GENERAL INTEREST) of Class 11 book with complete answers and questions
| Class 11 | CHEMISTRY |
| Chapter | MISCELLANEOUS (TOPICS OF GENERAL INTEREST) |
| OP TANDON | SET-VI: Problems on graphical aptitude |
| Number Of Questions | 53 |
| Academic Year | 2023-24 |
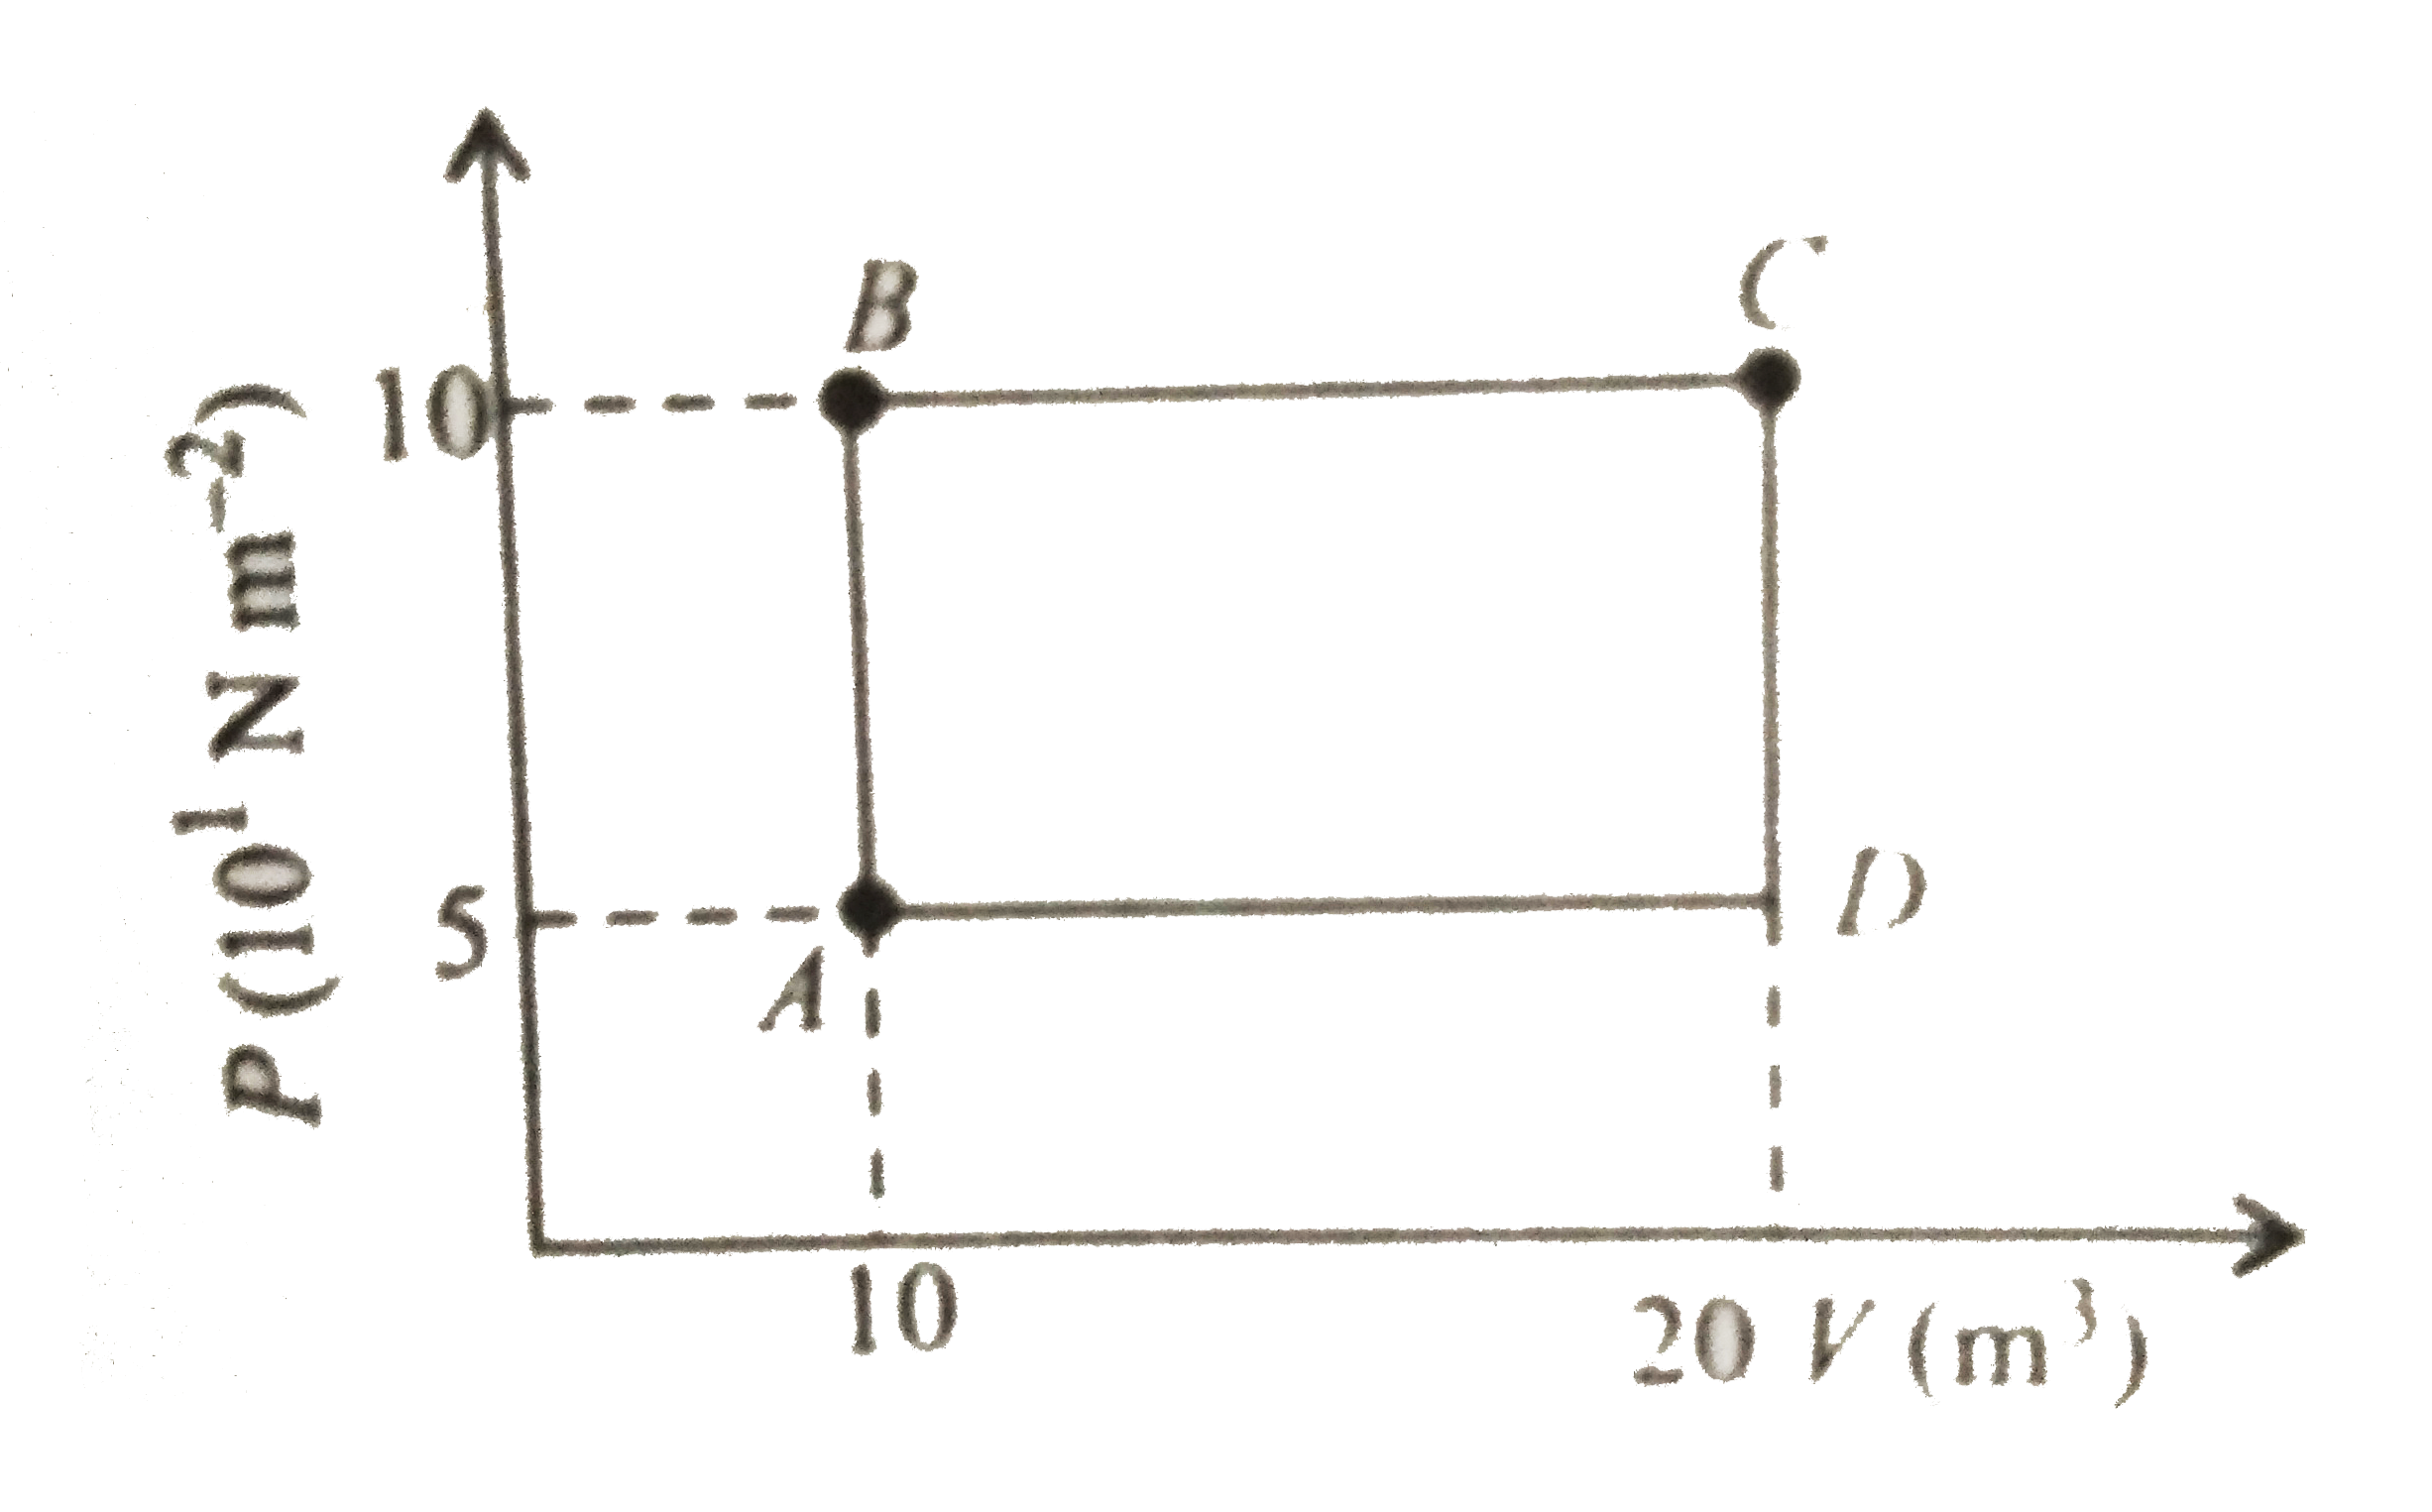
A sample of `2kg` of helium (assumed ideal) is taken through the process `ABC` and another sample of `2kg` of the same gas is taken through the process `ADC`. Then the temperature of the states `A` and `B` are (given `R = 8.3J mol^(-1)K^(-1))`
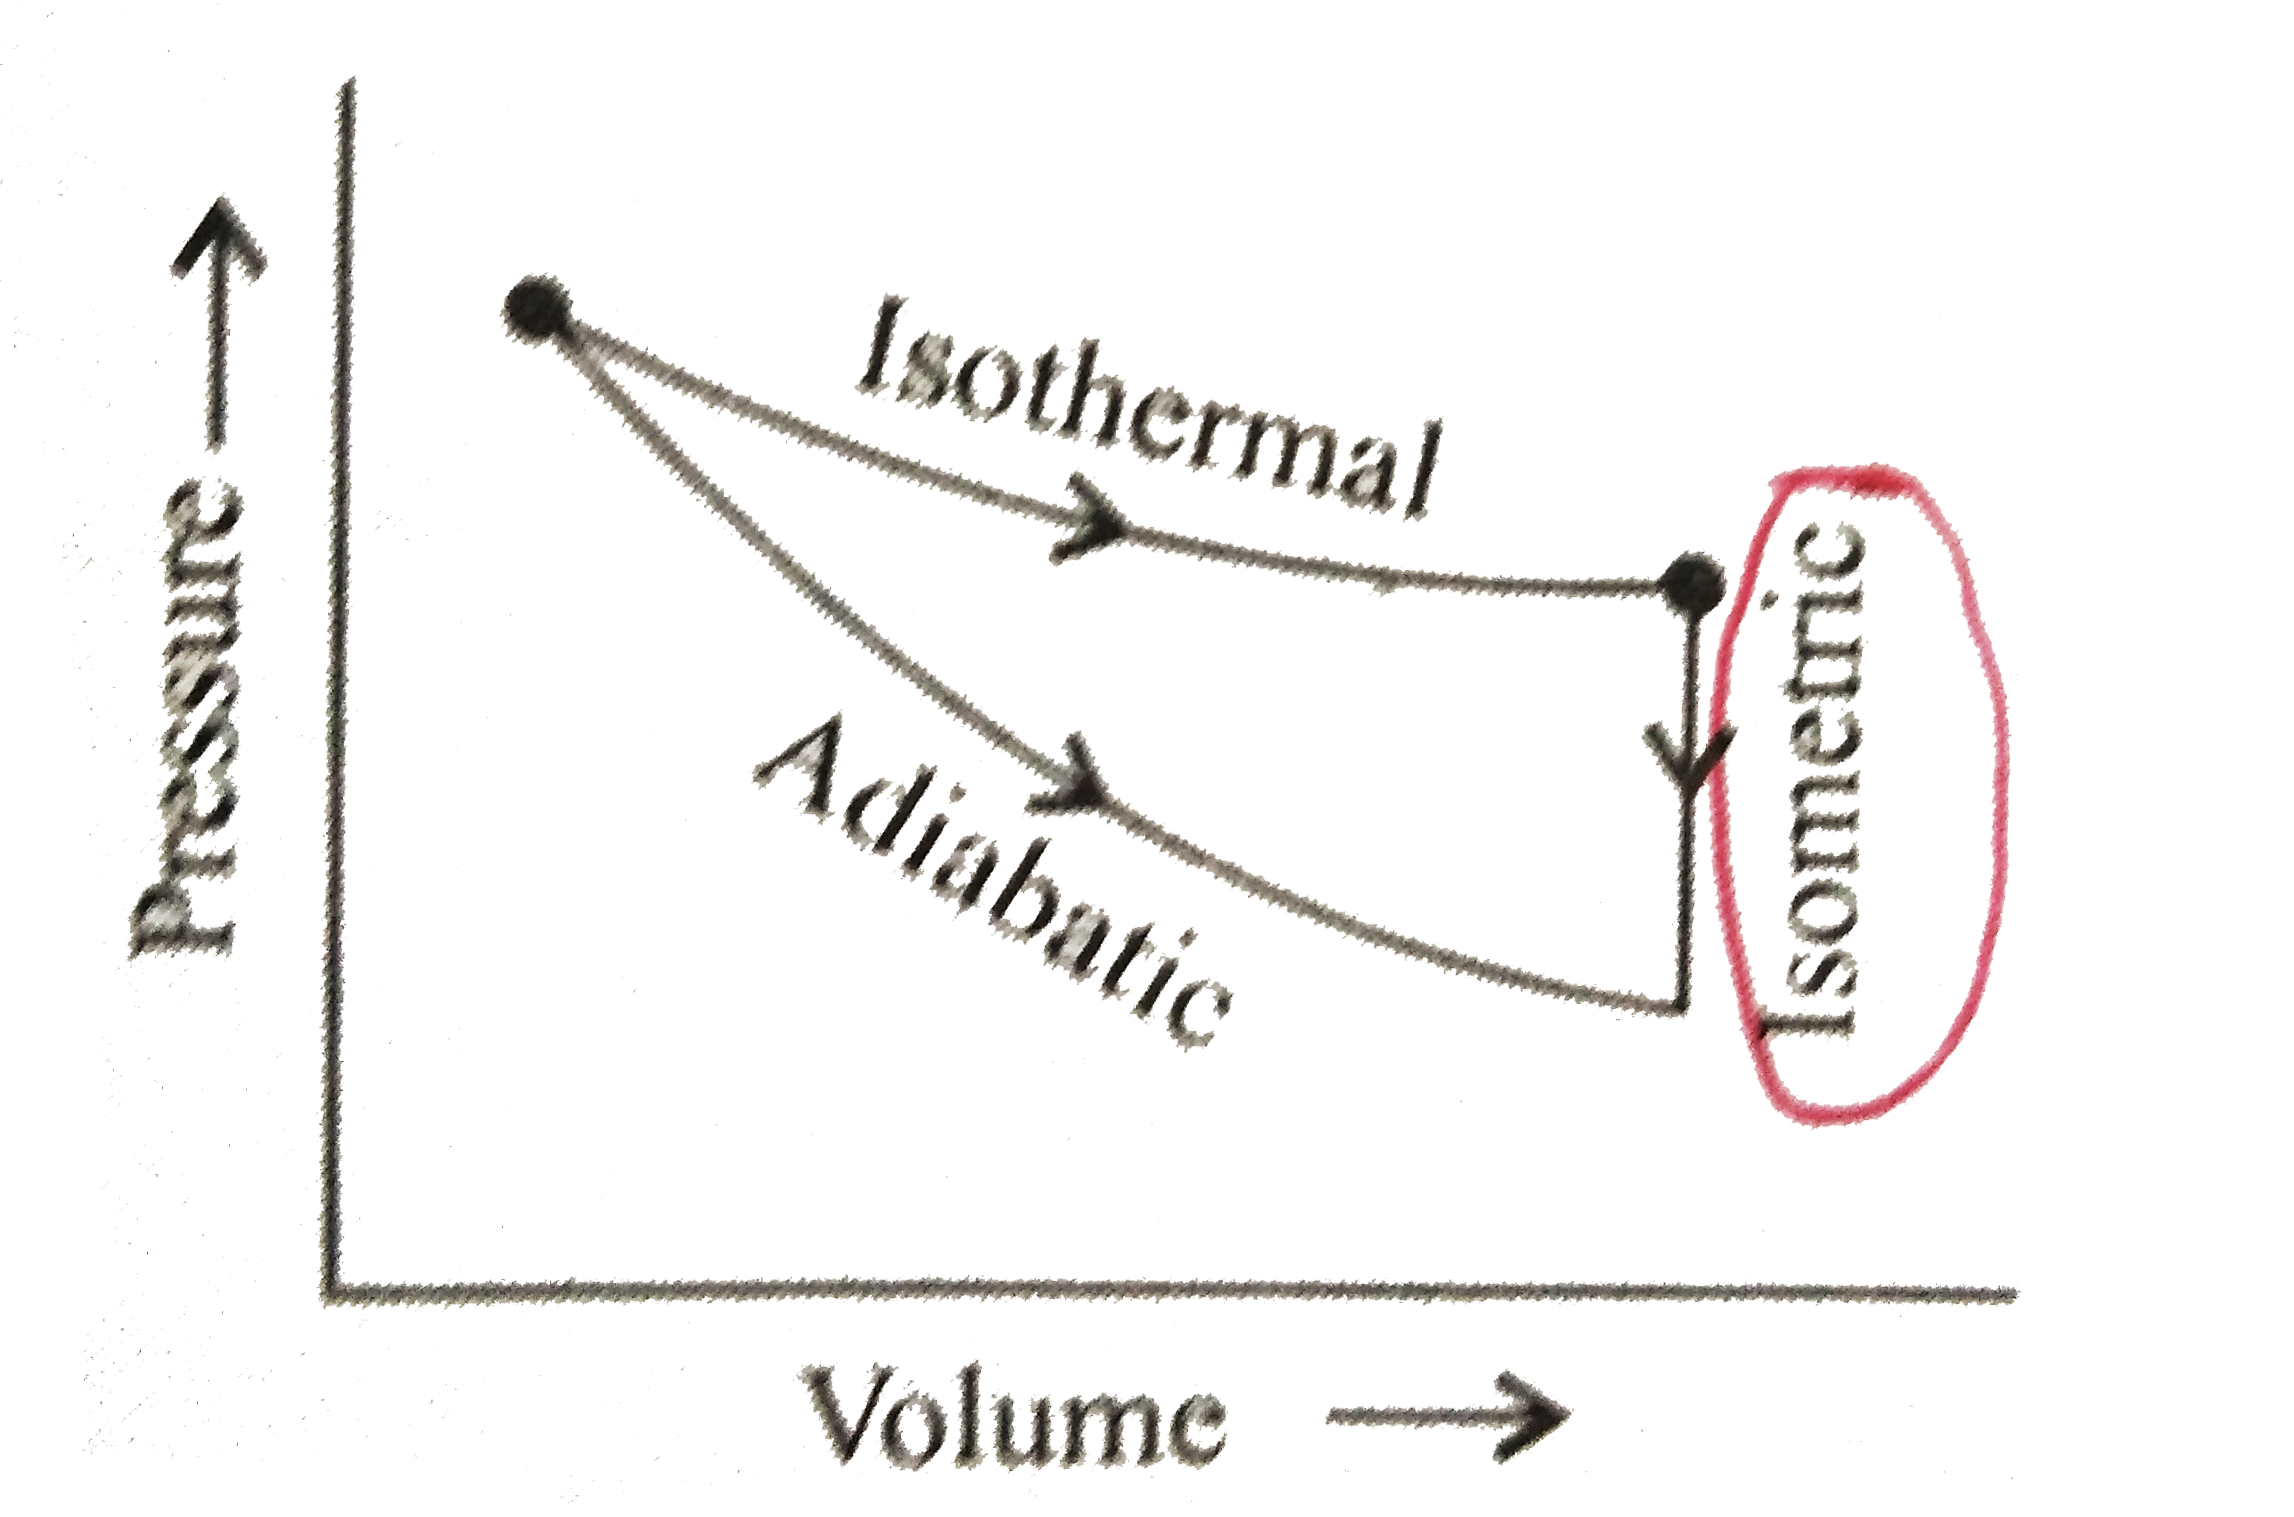
View SolutionAn ideal diatomic gas is caused to pass through a cycle shown on the `P-V` diagram in figure, where `V_(2) = 3.00V_(1)`. If `P_(1),V_(1)`,and `T_(1)` specify the state `1`, then the temperature of the state `3` is
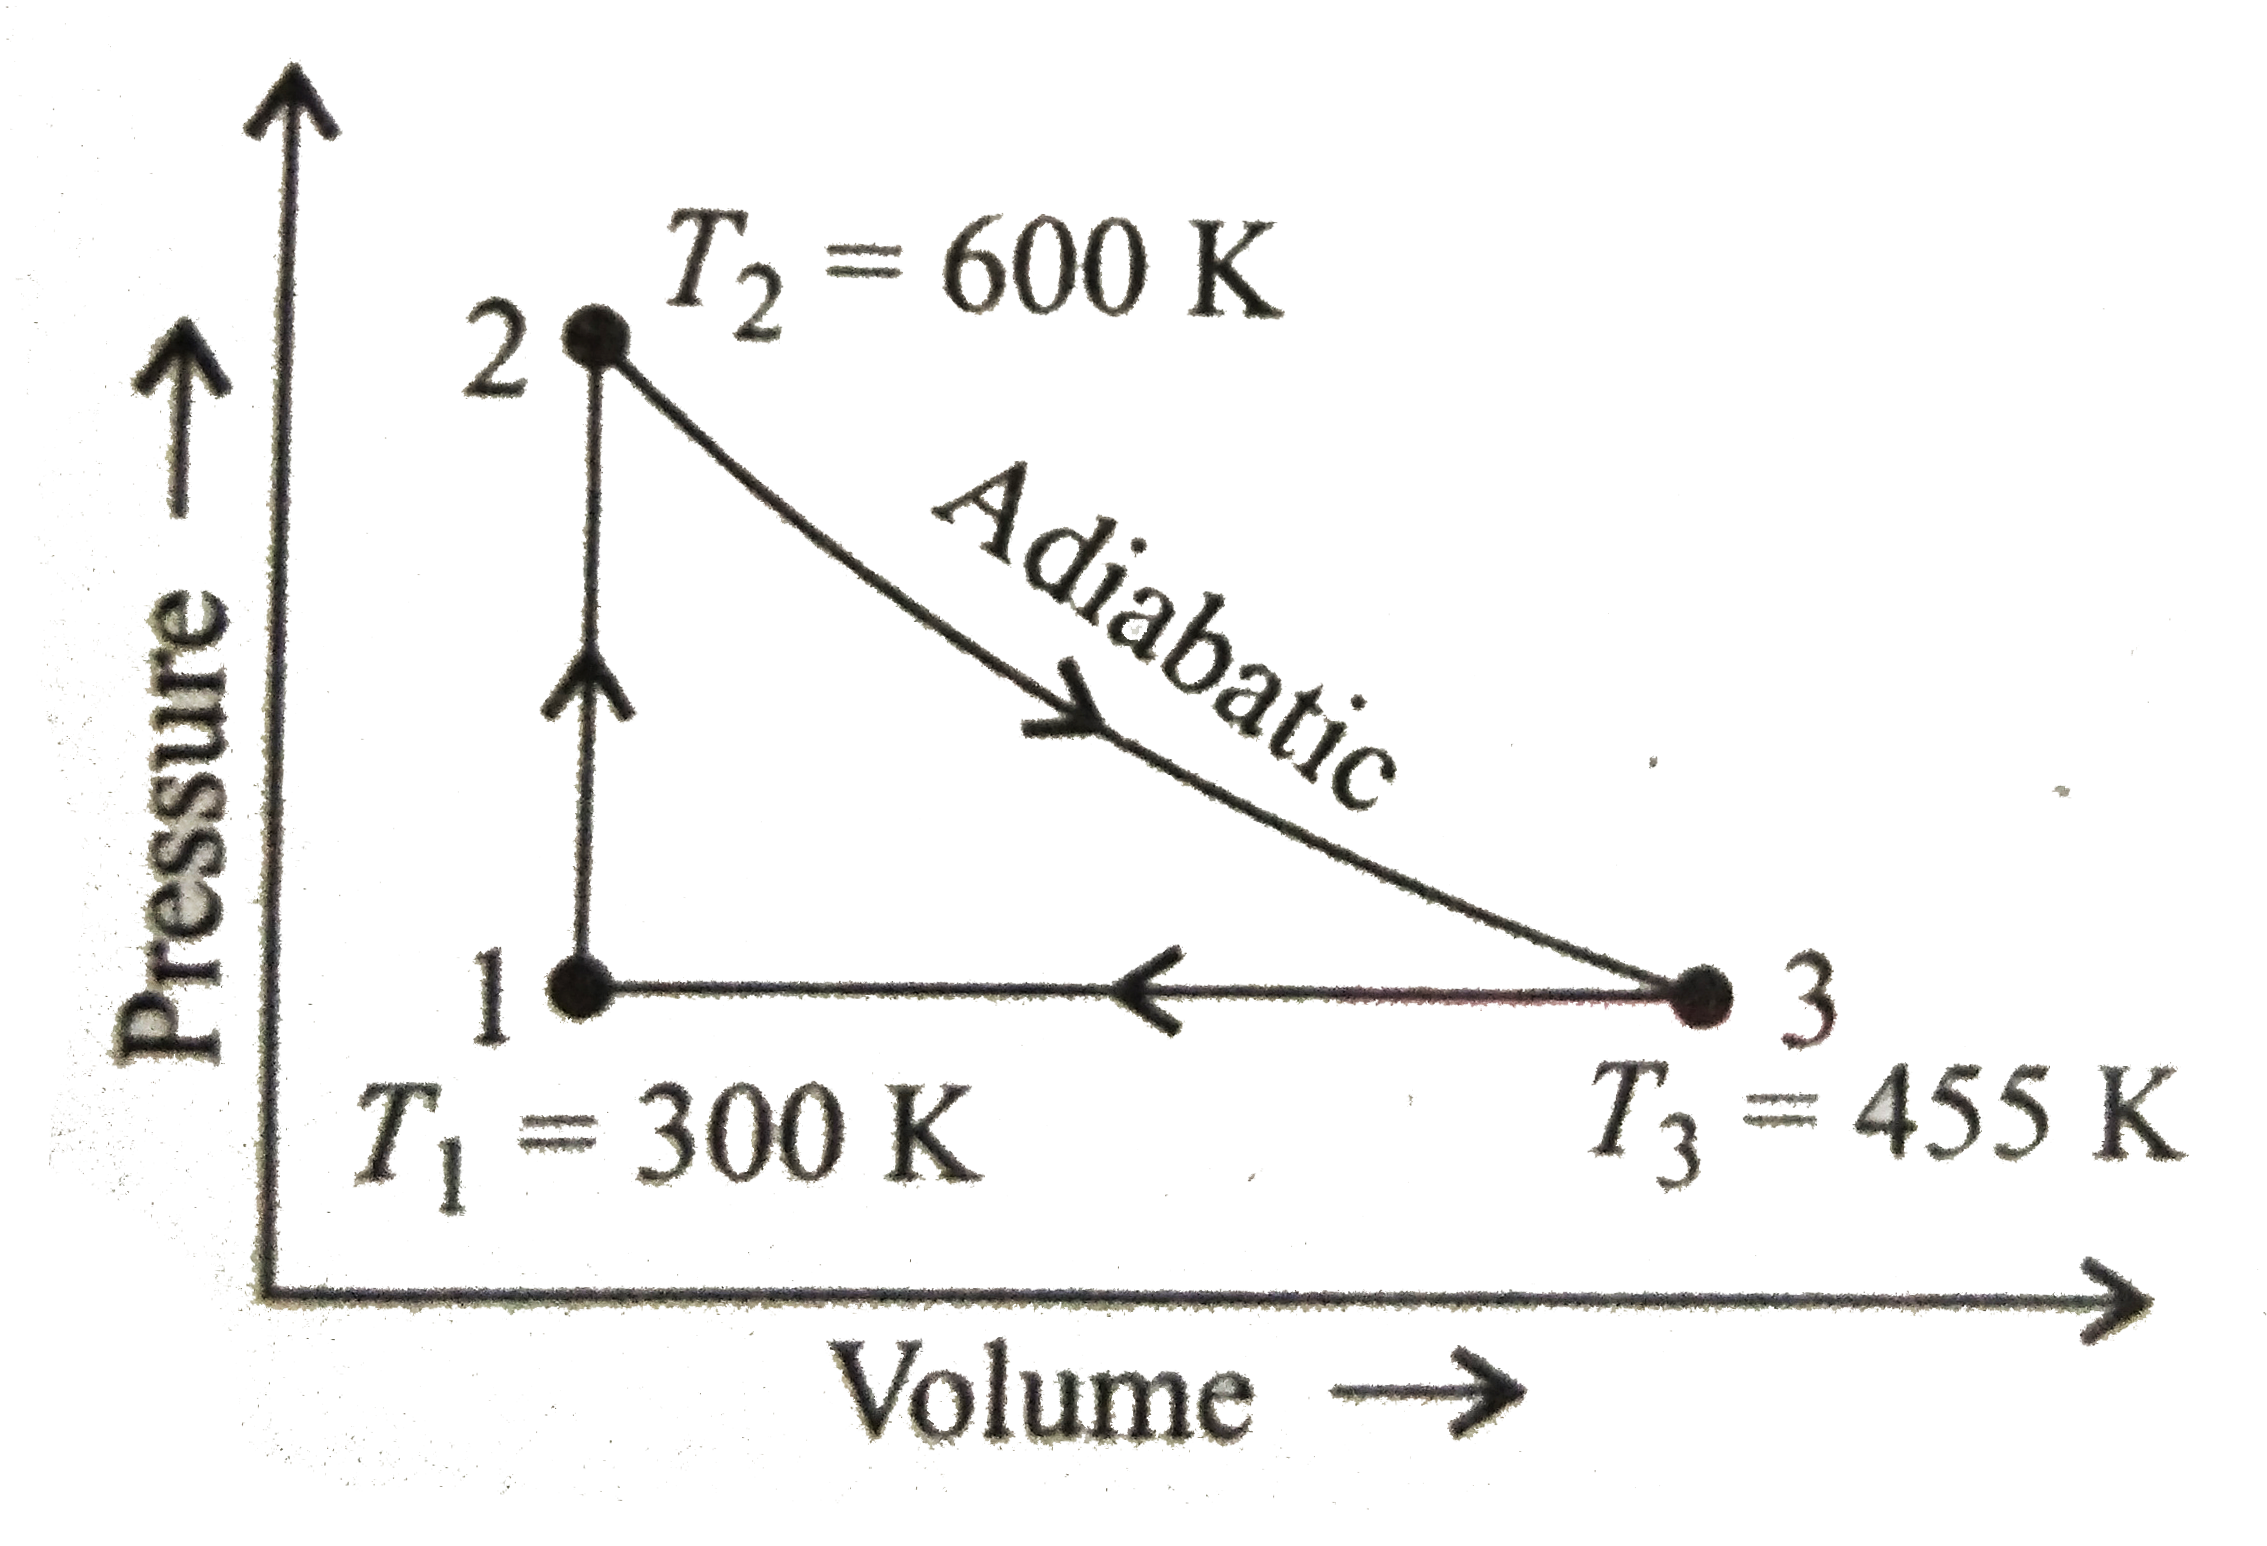
View SolutionA heat engine carries one mole of an ideal mono-atomic gas around the cycle as shown in the figure below. Process `1 rarr 2` takes place at constant volume, process `2 rarr 3` is adiabatic and process `3 rarr 1` takes place at constant pressure. Then the amount of heat added in the process `1 rarr2` is
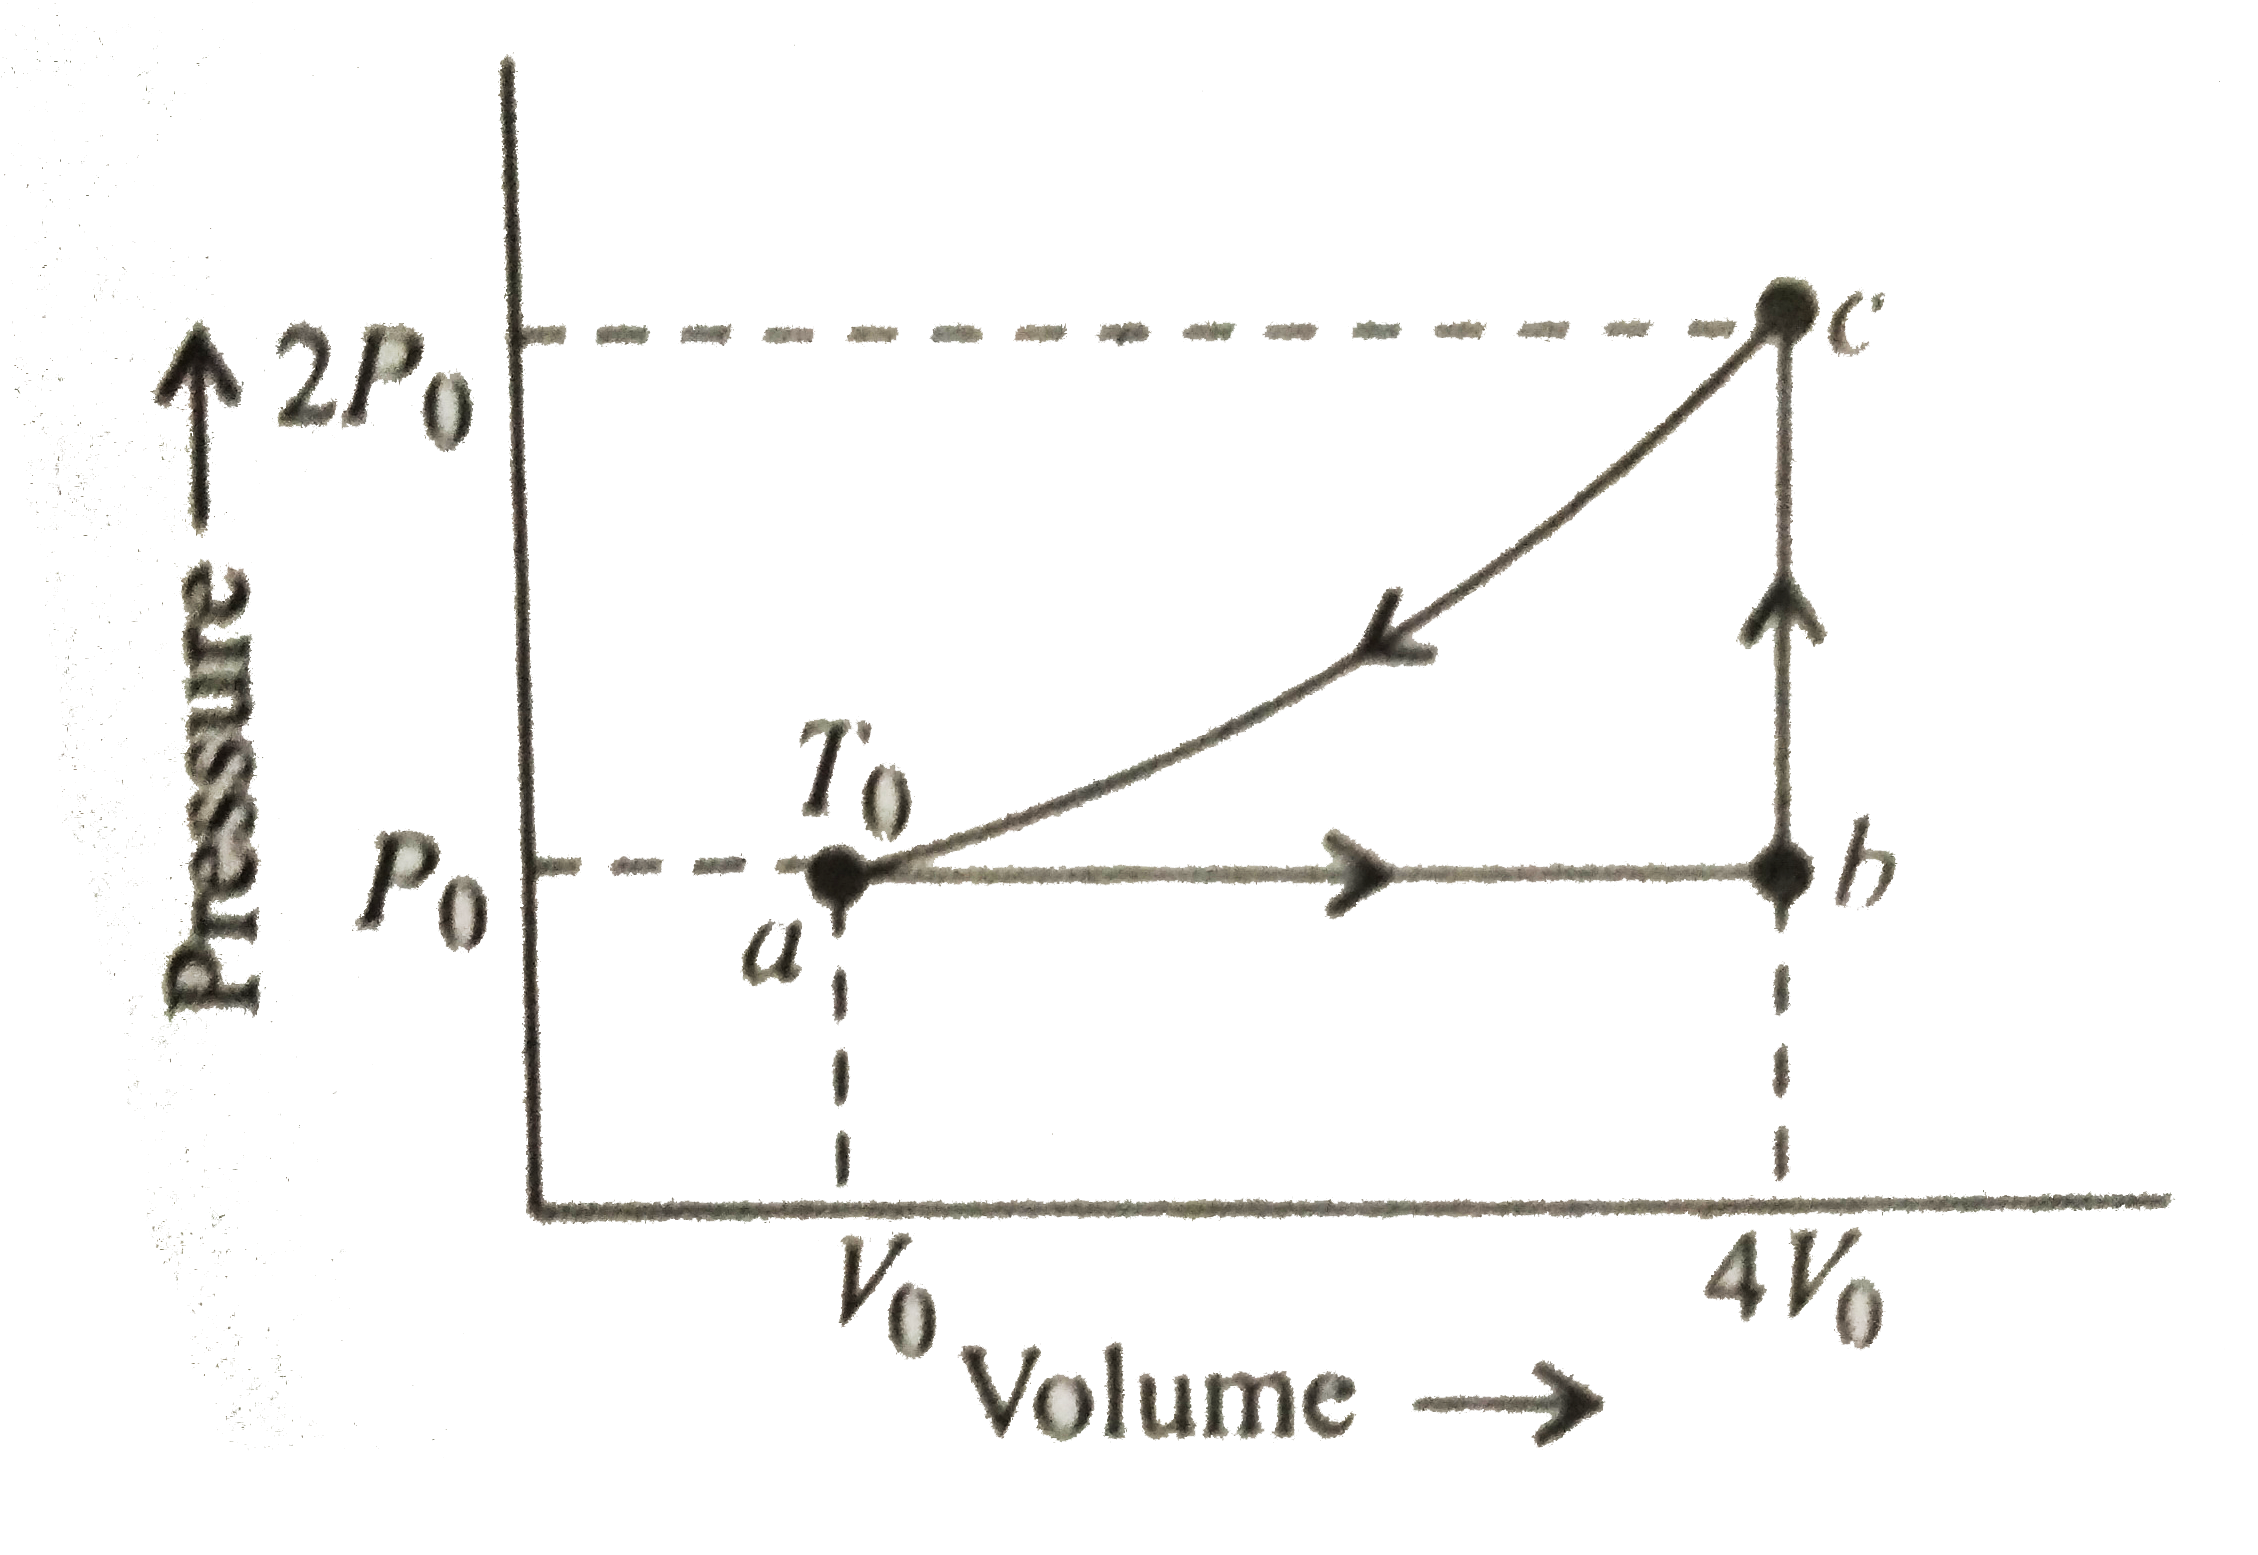
View SolutionOne mole of an ideal mono-atomic gas is caused to go through the cycle shown in the figure below. Then the change in the internal enegry in expanding the gas from `a` to `c` along the path `abc` is:
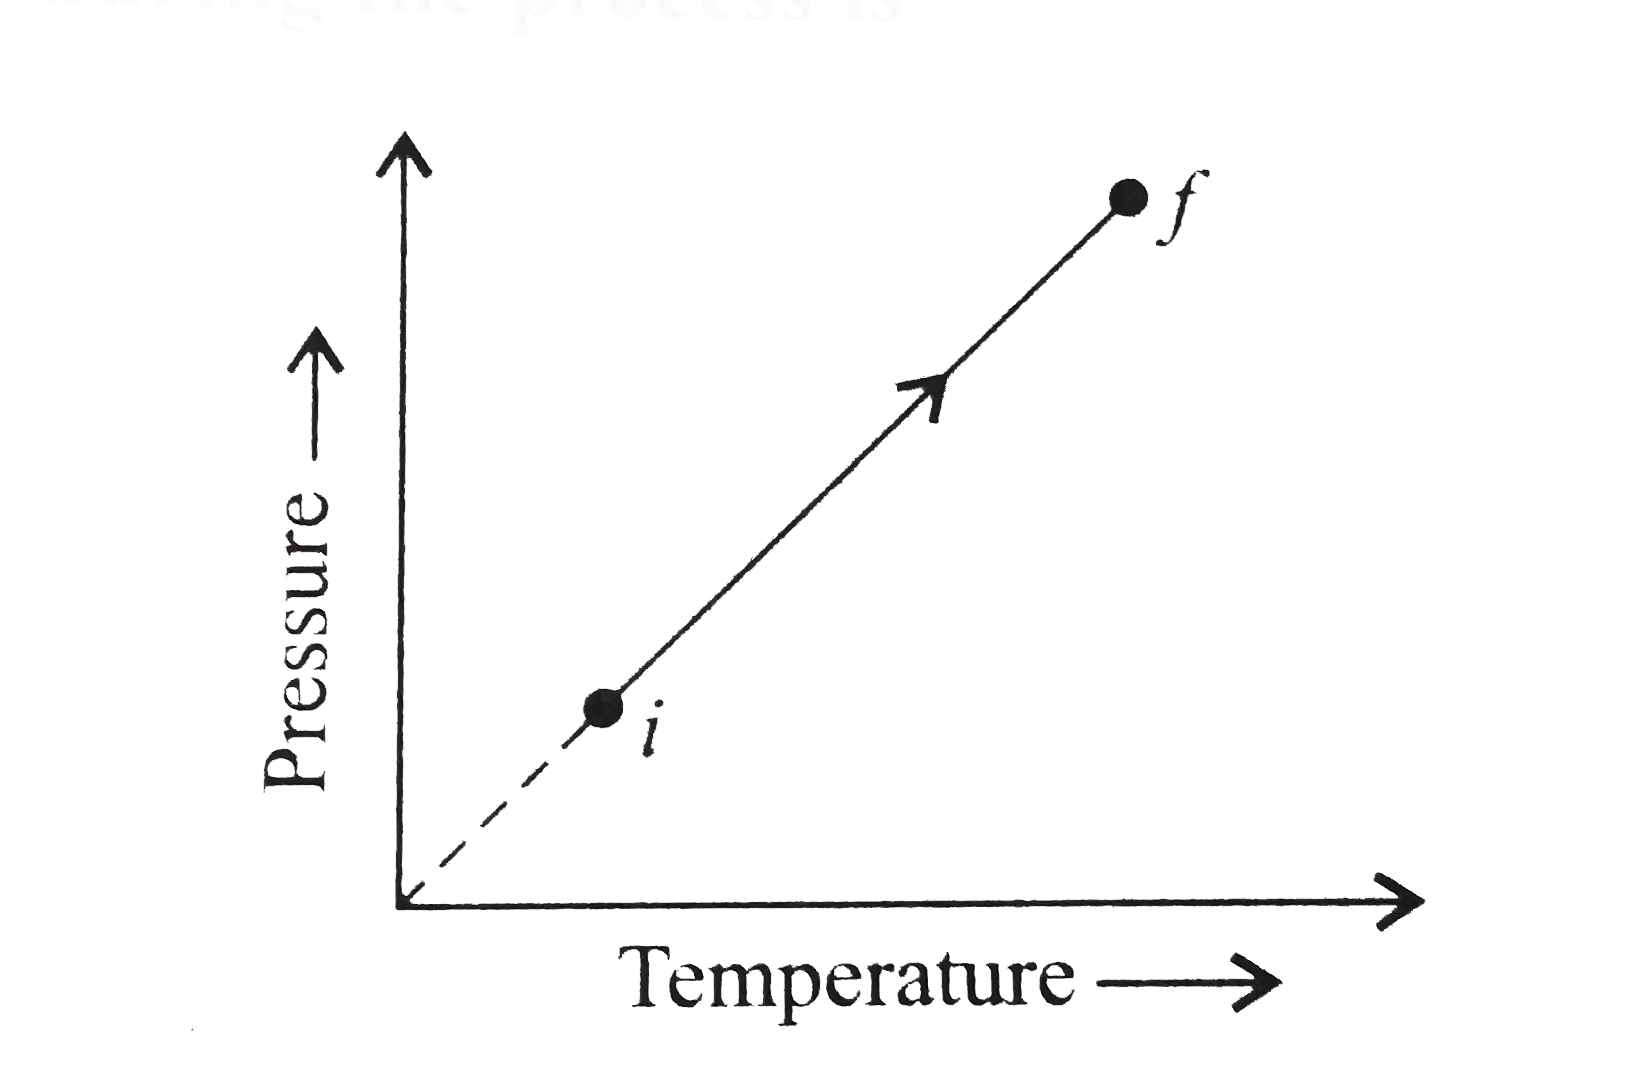
View SolutionA thermodynamic system consists of a cylinder-piston attangement with ideal gas in it. It goes from the state `i` to the state `f` as shwon in the figure. The work done by gas during the process is
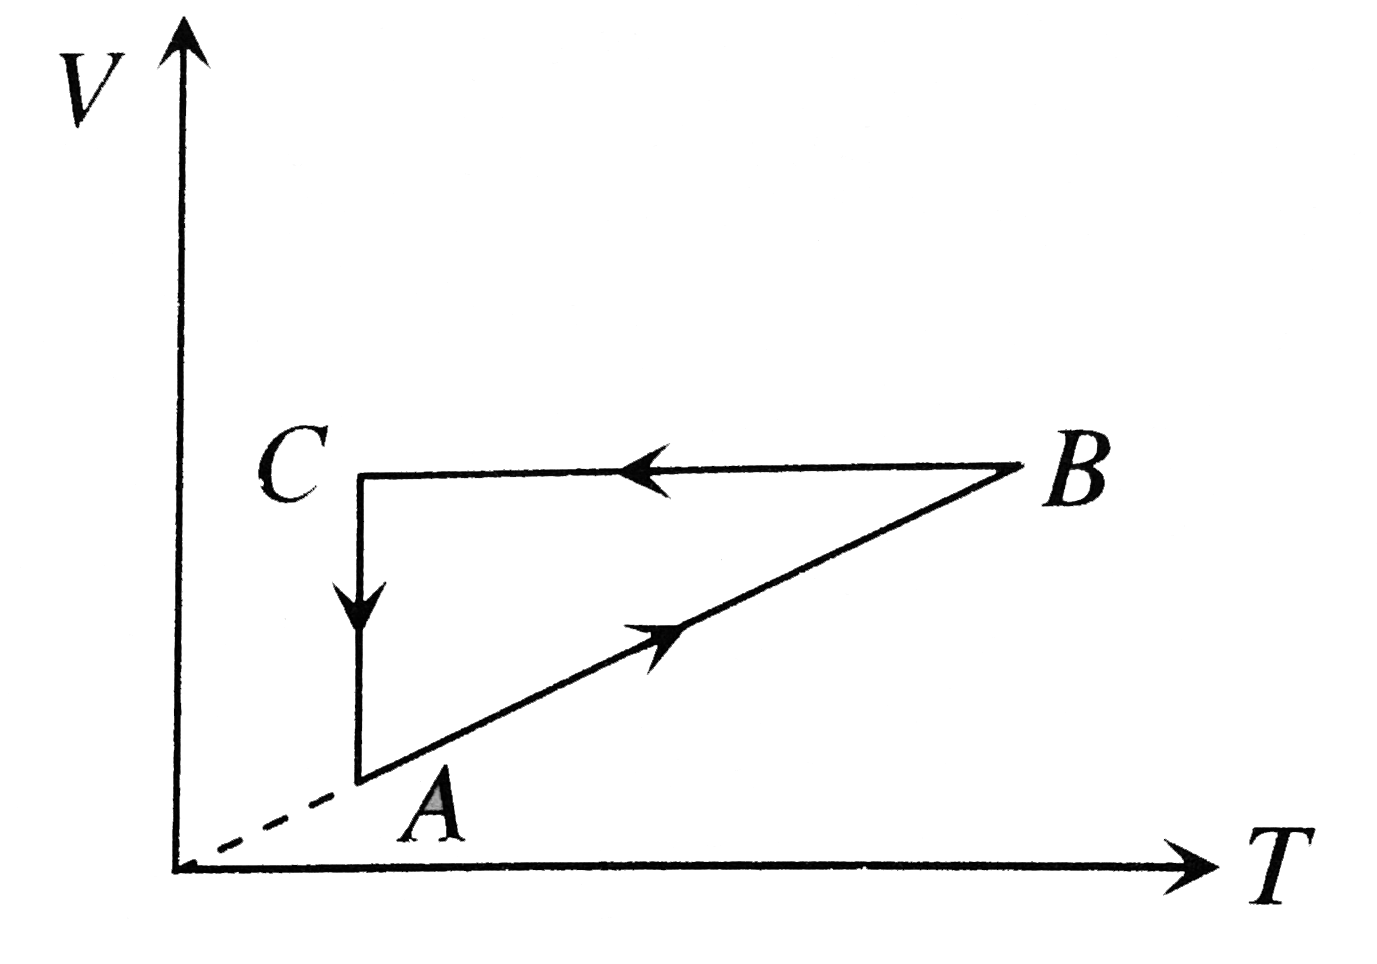
View SolutionA cyclic process `ABCA` is shown in the `V-T` diagram process on the `P-V`
View SolutionThe following are the `P-V` diagram for cyclic process for a gas. In which of these processes, heat is not obsorbed by the gas?
View SolutionThe graph betwene `P` and `V` at constant temperature should look like
View SolutionIn `P-V` diagram shown below,
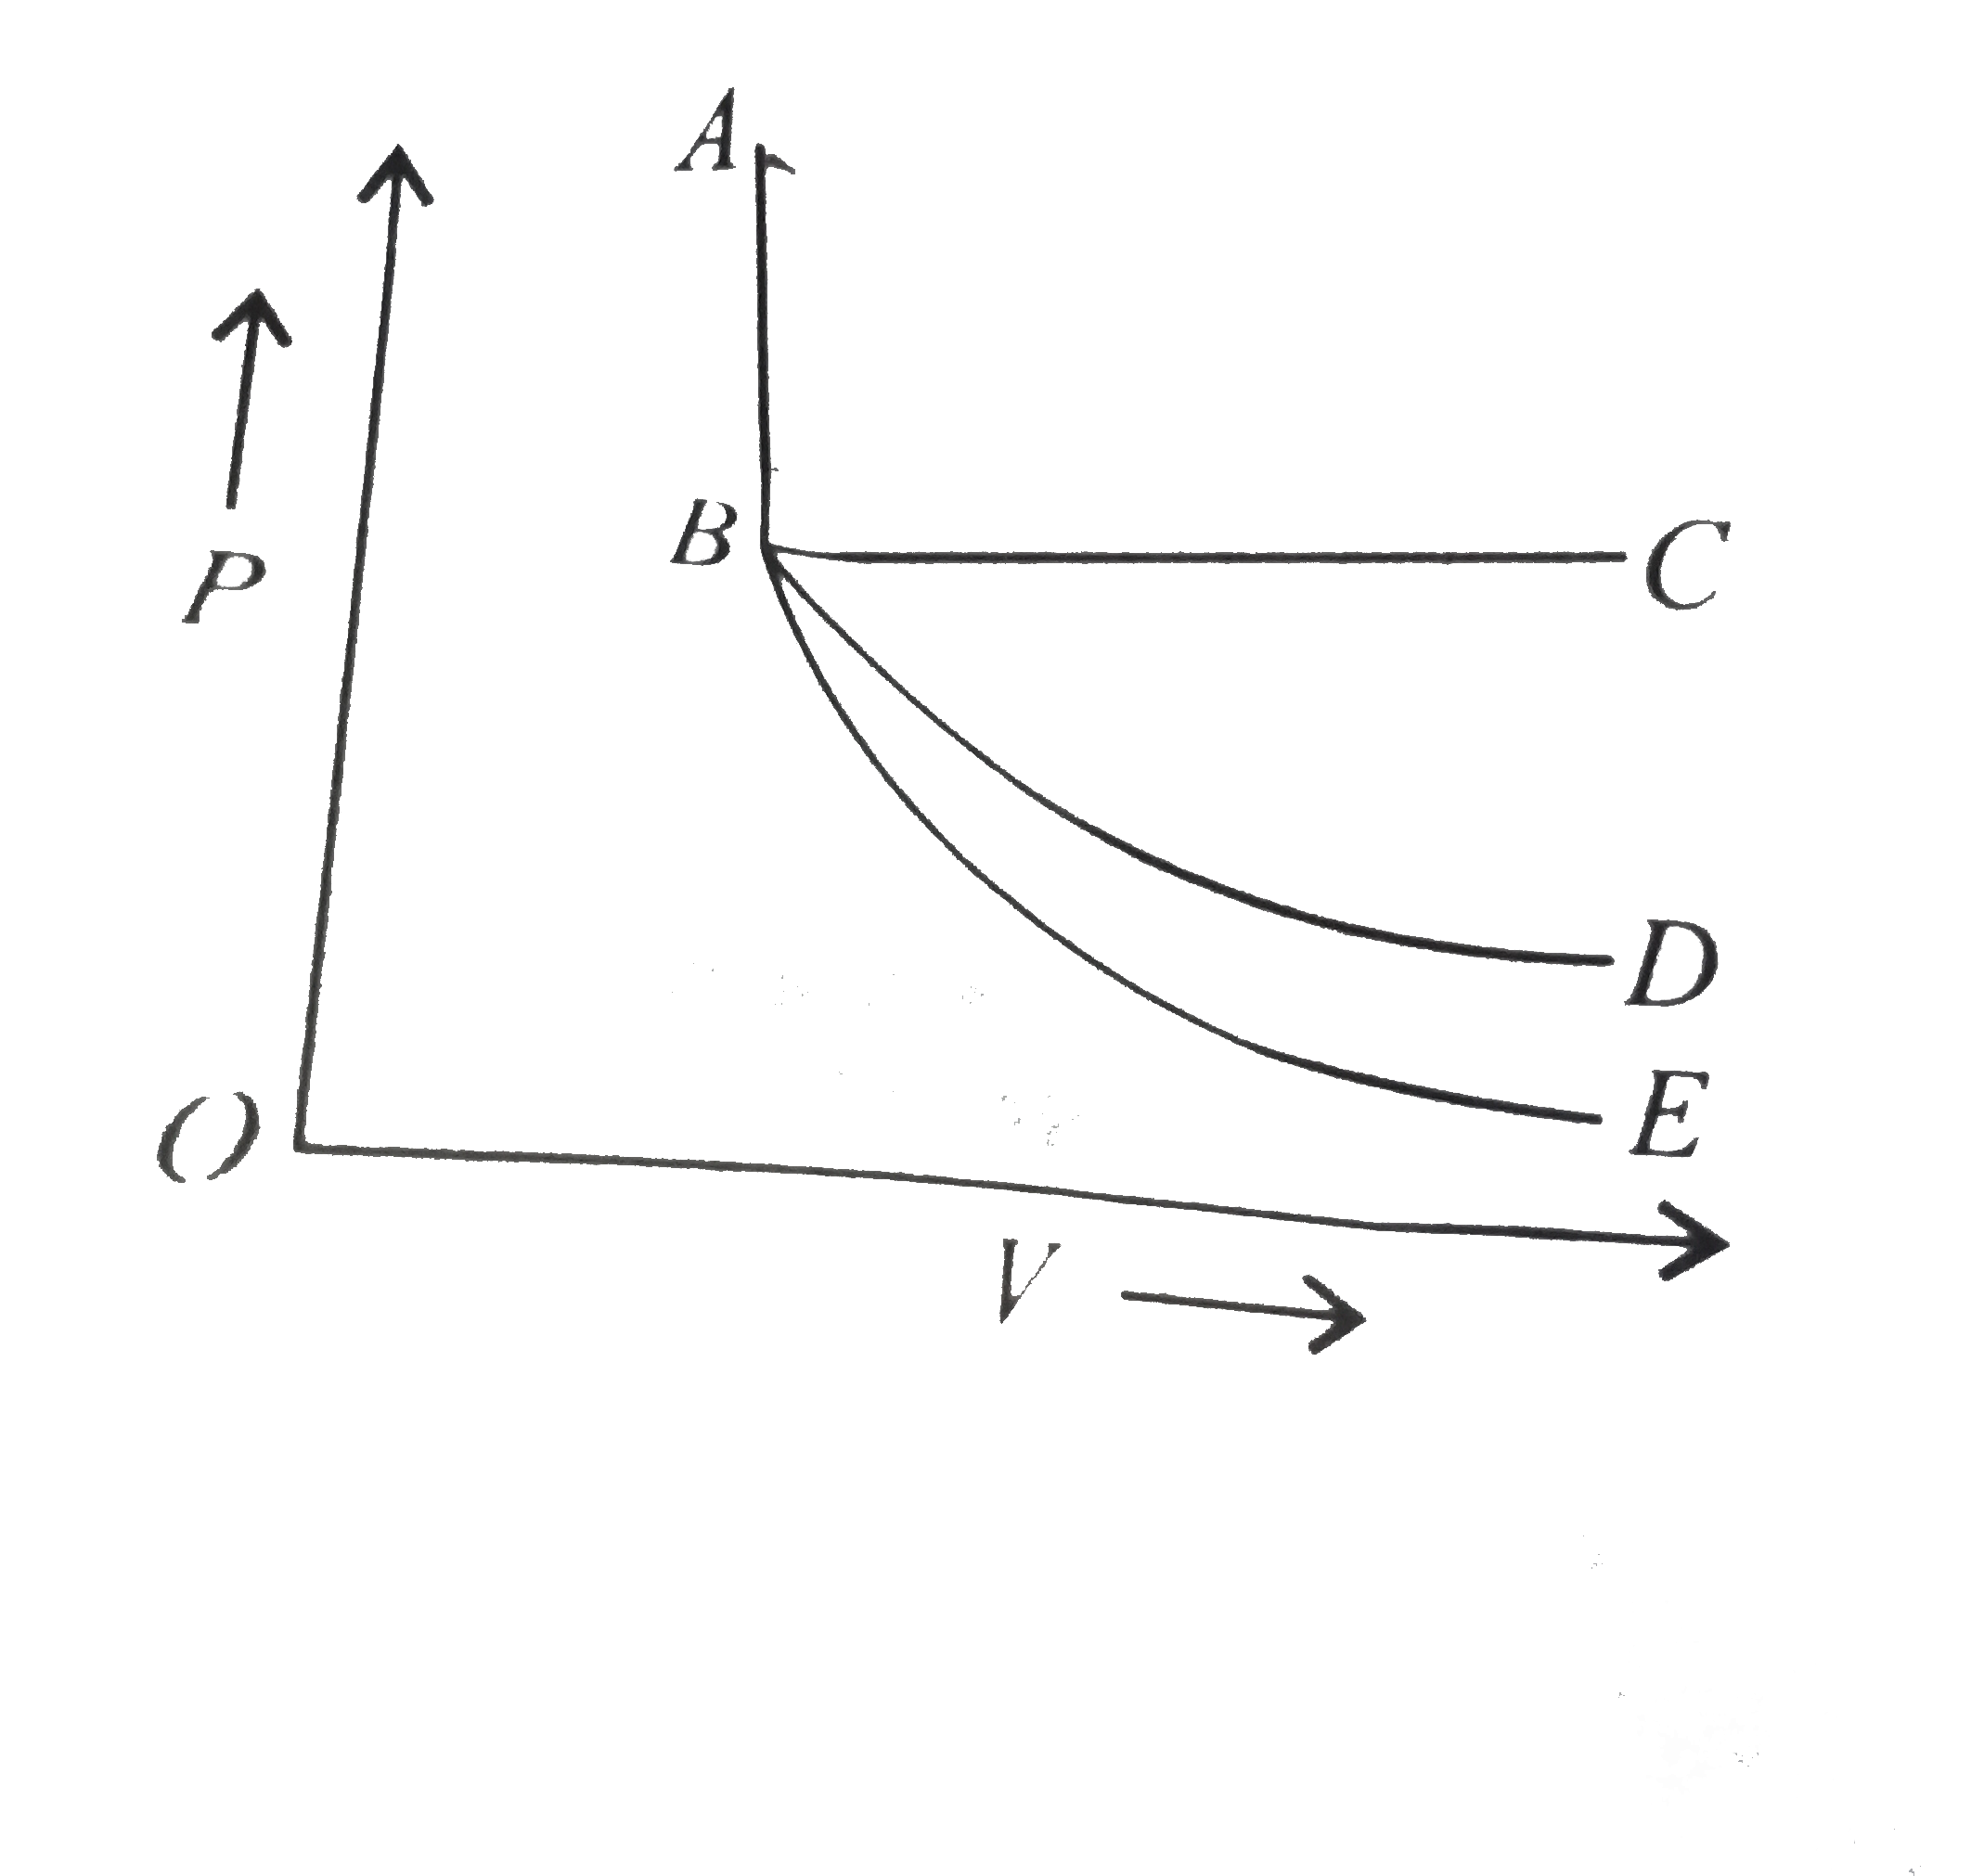
View SolutionThe P - V graph of an ideal gas cycle is shown here as below. The adiabatic process is described by
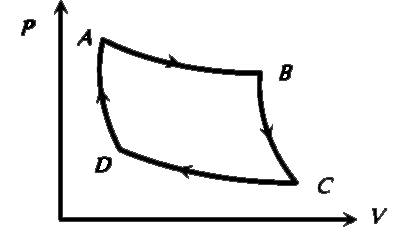
View SolutionAn ideal gas is taken around the cycle `ABCA` shown in `P - V` diagram. The net work done by the gas during the cycle is equal to
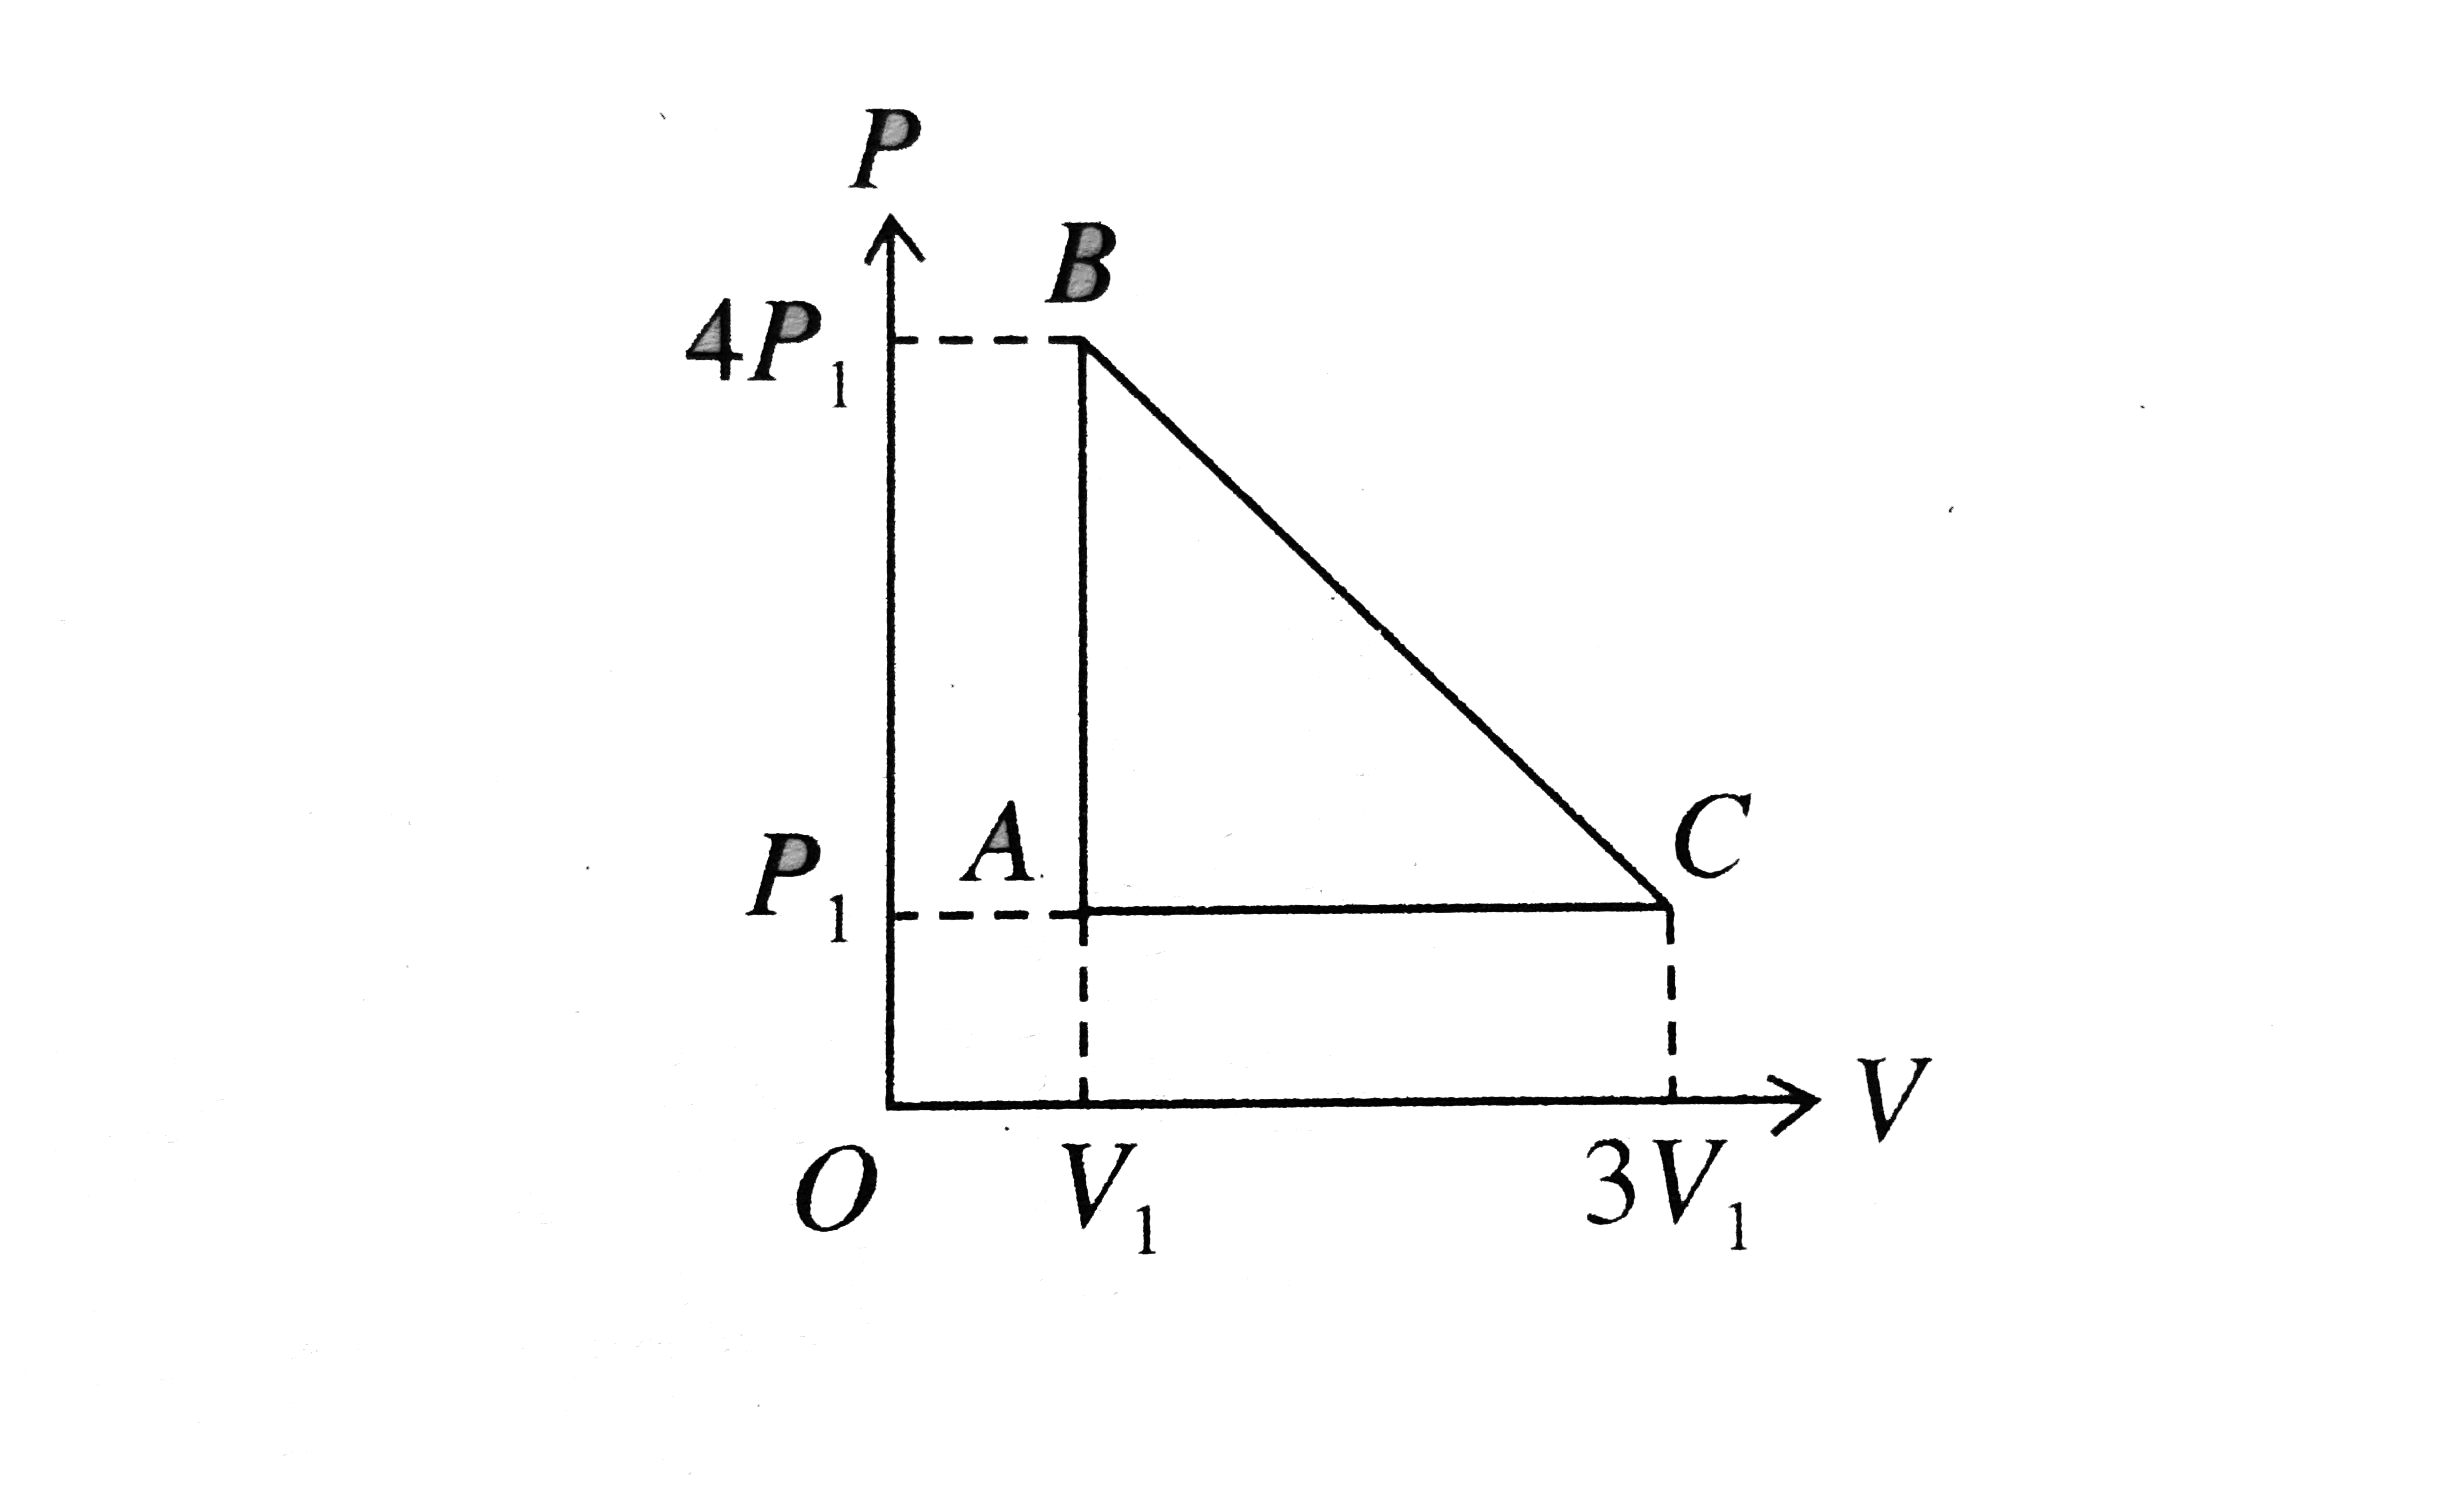
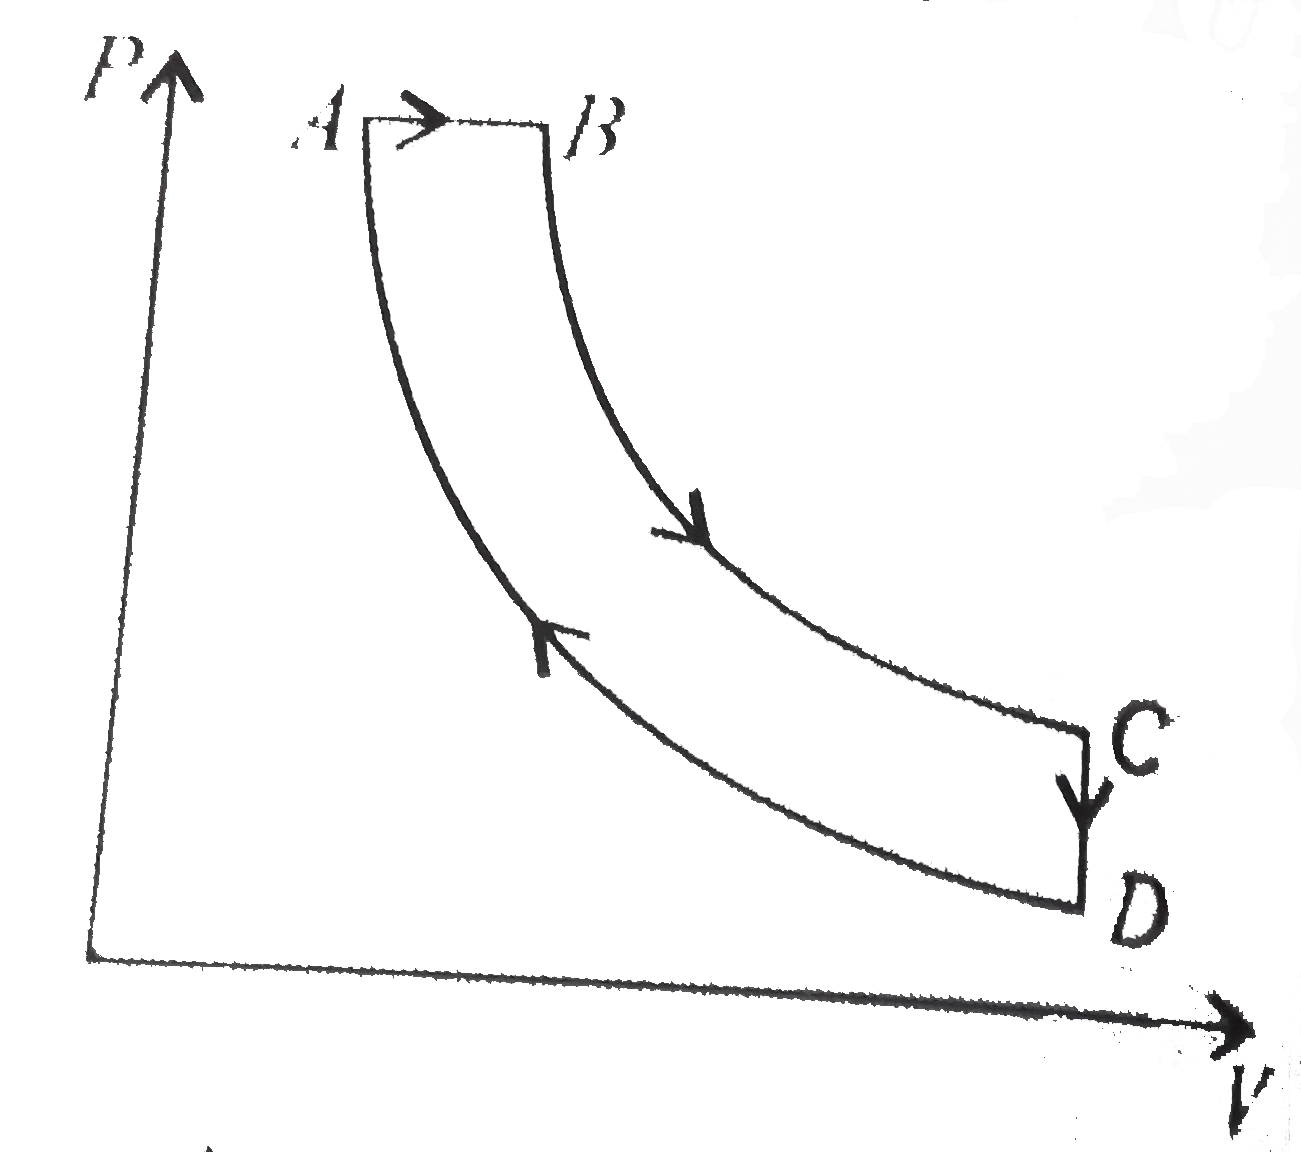
View SolutionAn ideal monoatomic gas is taken round the cycle ABCDA as shown in the P-V diagram. The work done during the cycle is
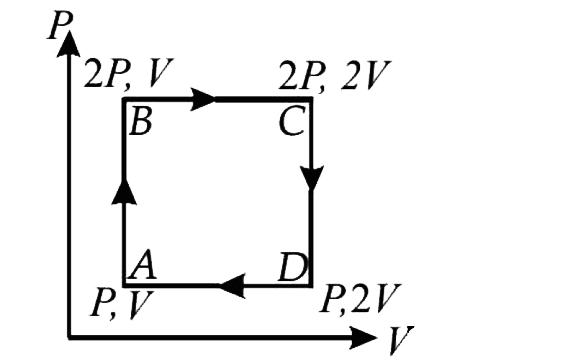
View SolutionFour curves `A,B,C` and `D` are drawn in figure for a given amount of gas. The curve which represents adiabatic and isothermal changes, respectively, is
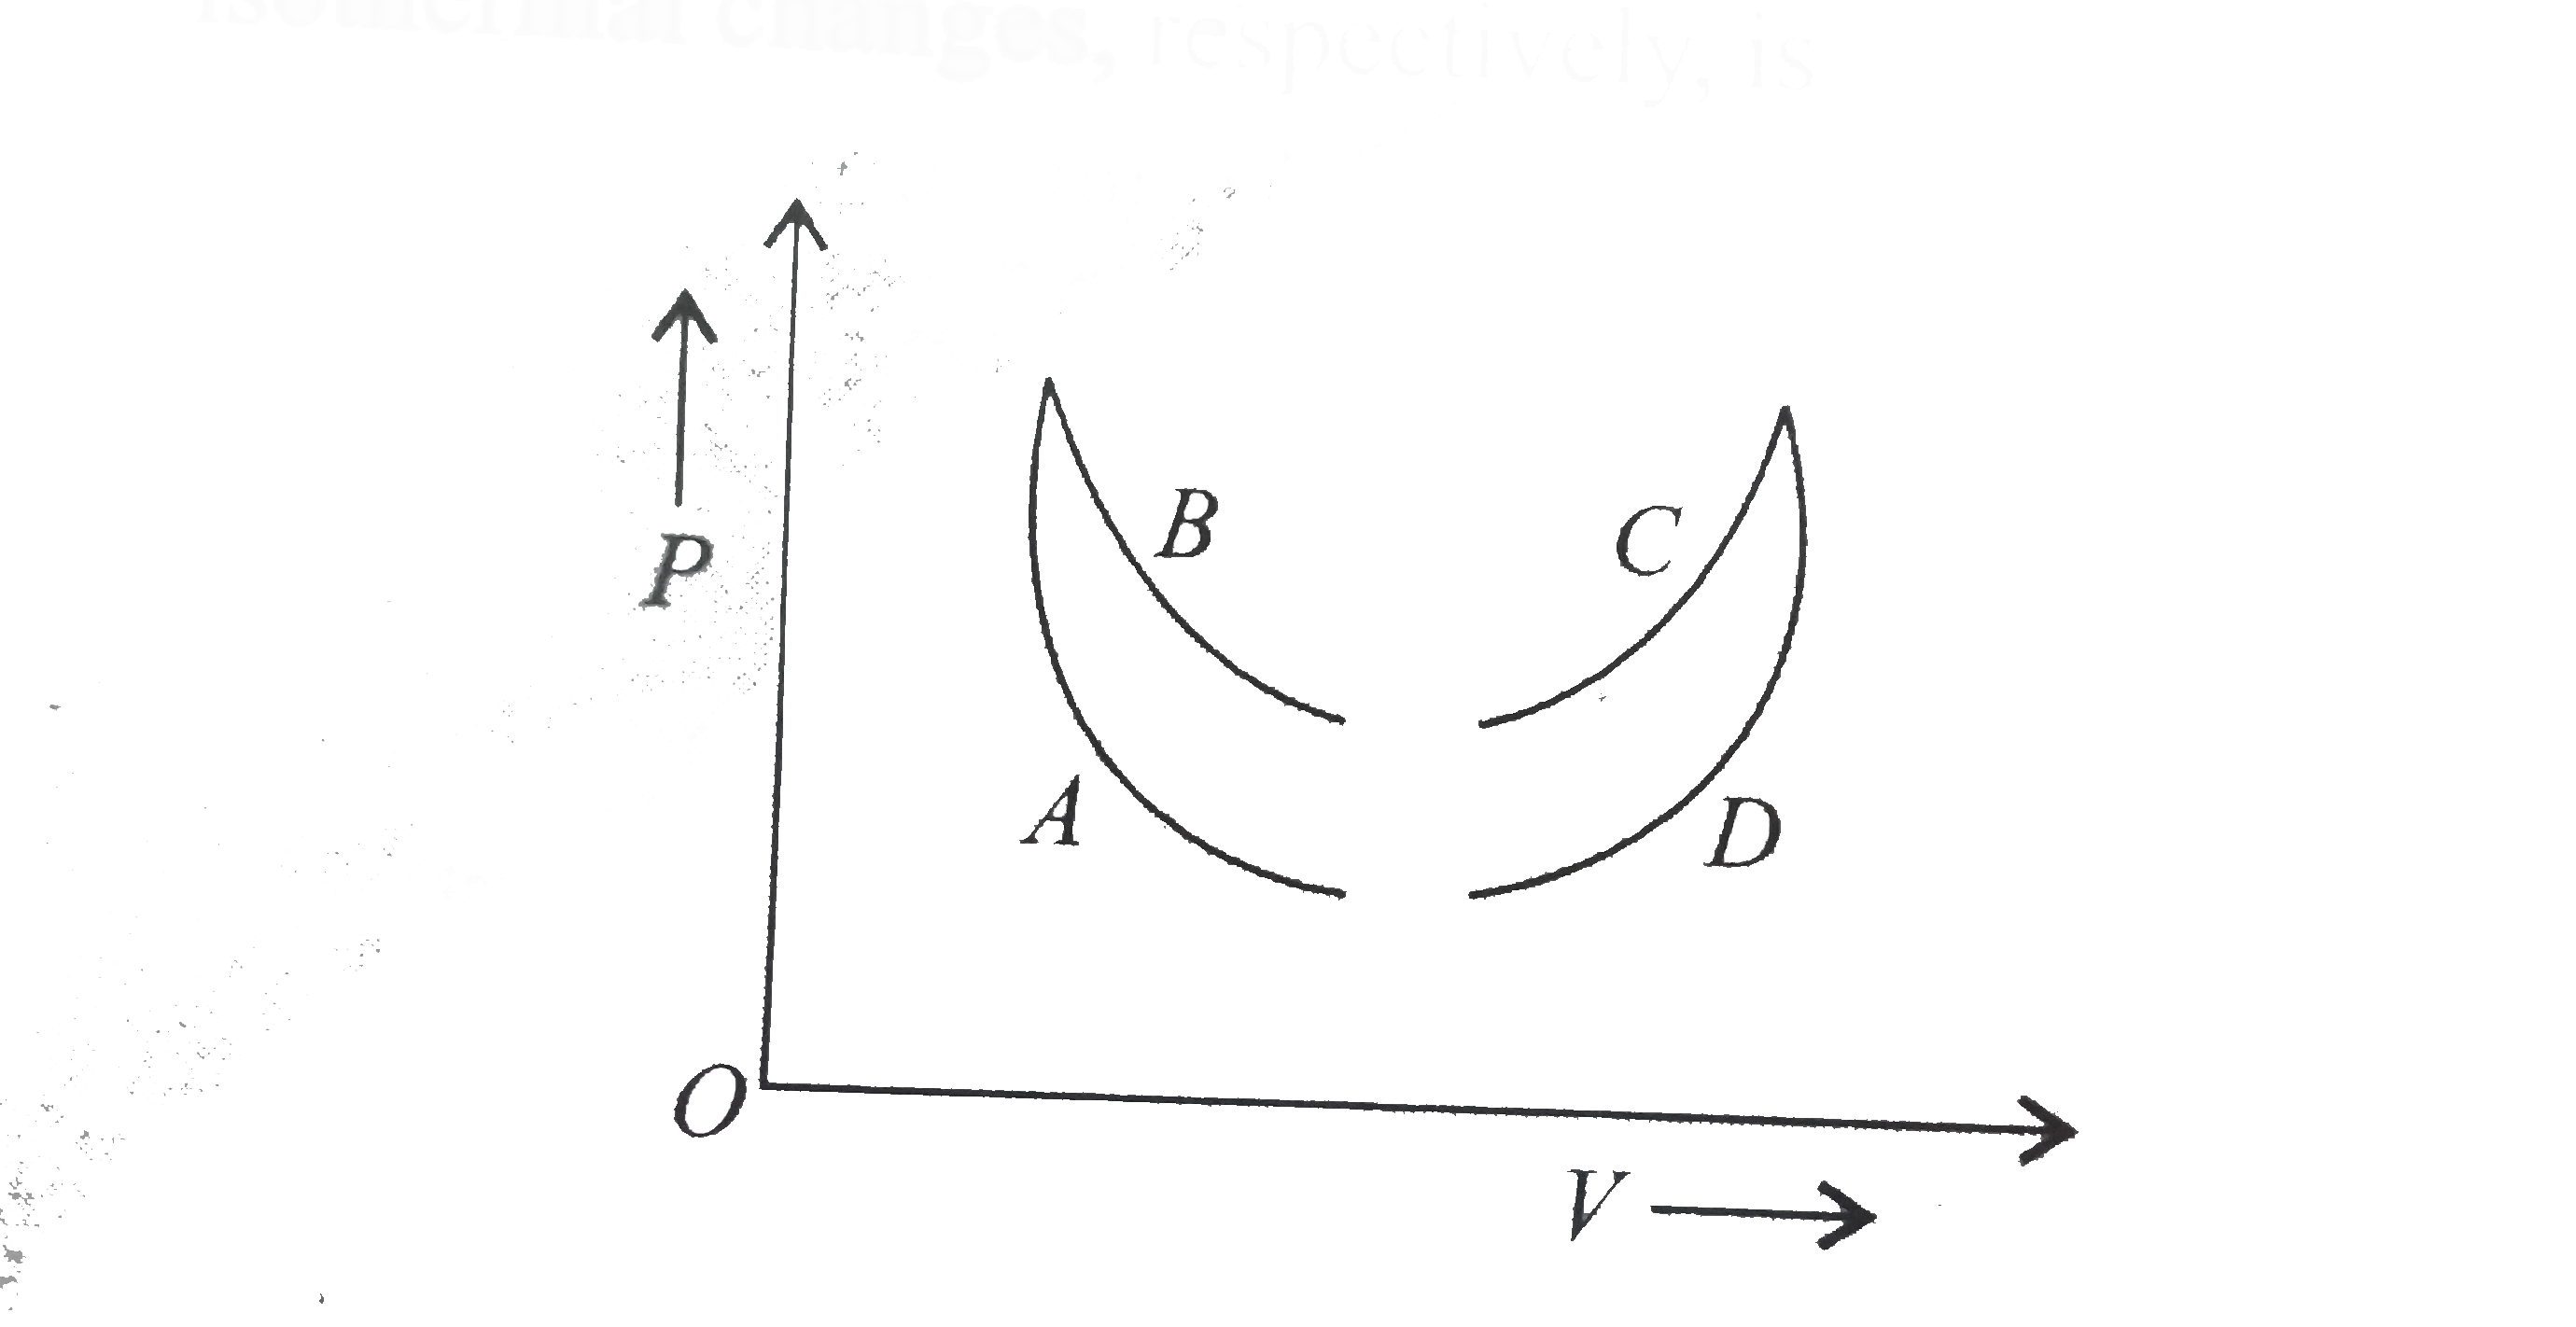
View SolutionA given mass of gas expands from state `A` to state `B` by three paths `1,2`, and `3` as shown in the figure below. If `w_(1),w_(2)` and `w_(3)`, respectively, be the work done by the gas along three paths, then
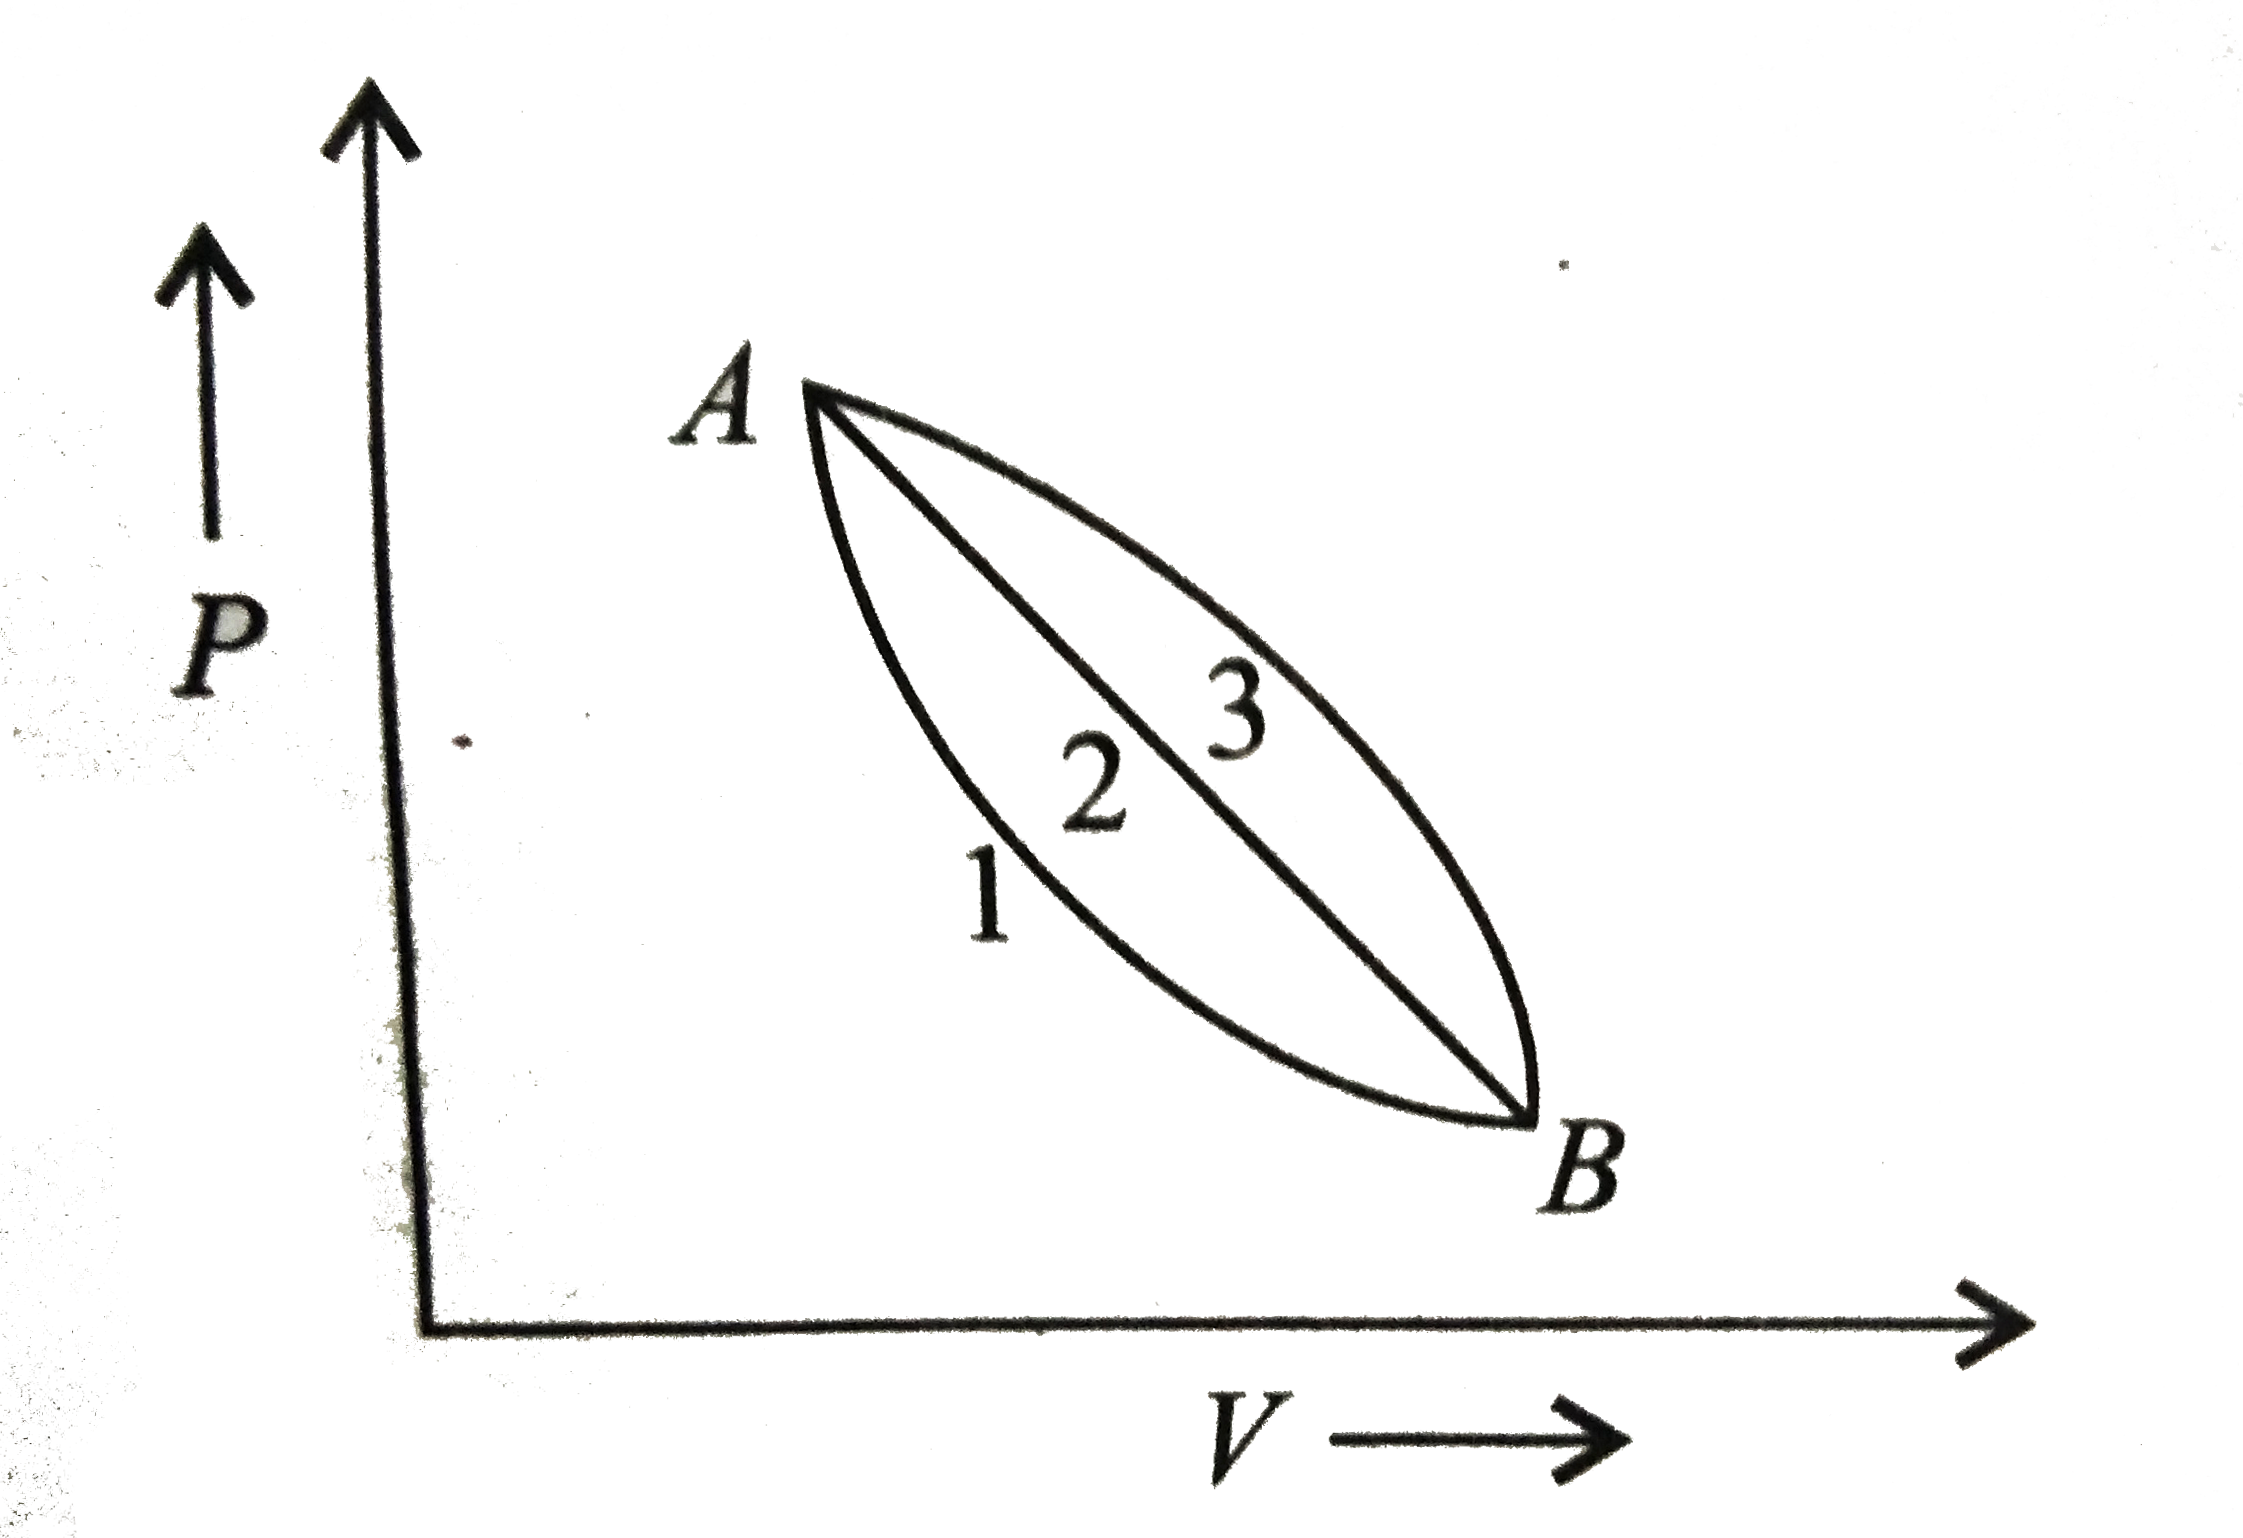
View SolutionA thermodynamic process is shown in Fig. The pressures and volumes corresponding to some points in the figure are
`P_(A) = 3 xx 10^(4) Pa` `V_(A) = 2 xx 10^(-3) m^(3)`
`P_(B) = 8 xx 10^(4) Pa` `V_(D) = 5 xx 10^(-3) m^(3)`
In the process `AB` `600 J` of heat is added to the system. The change in internal energy of the system in the process `AB` would be
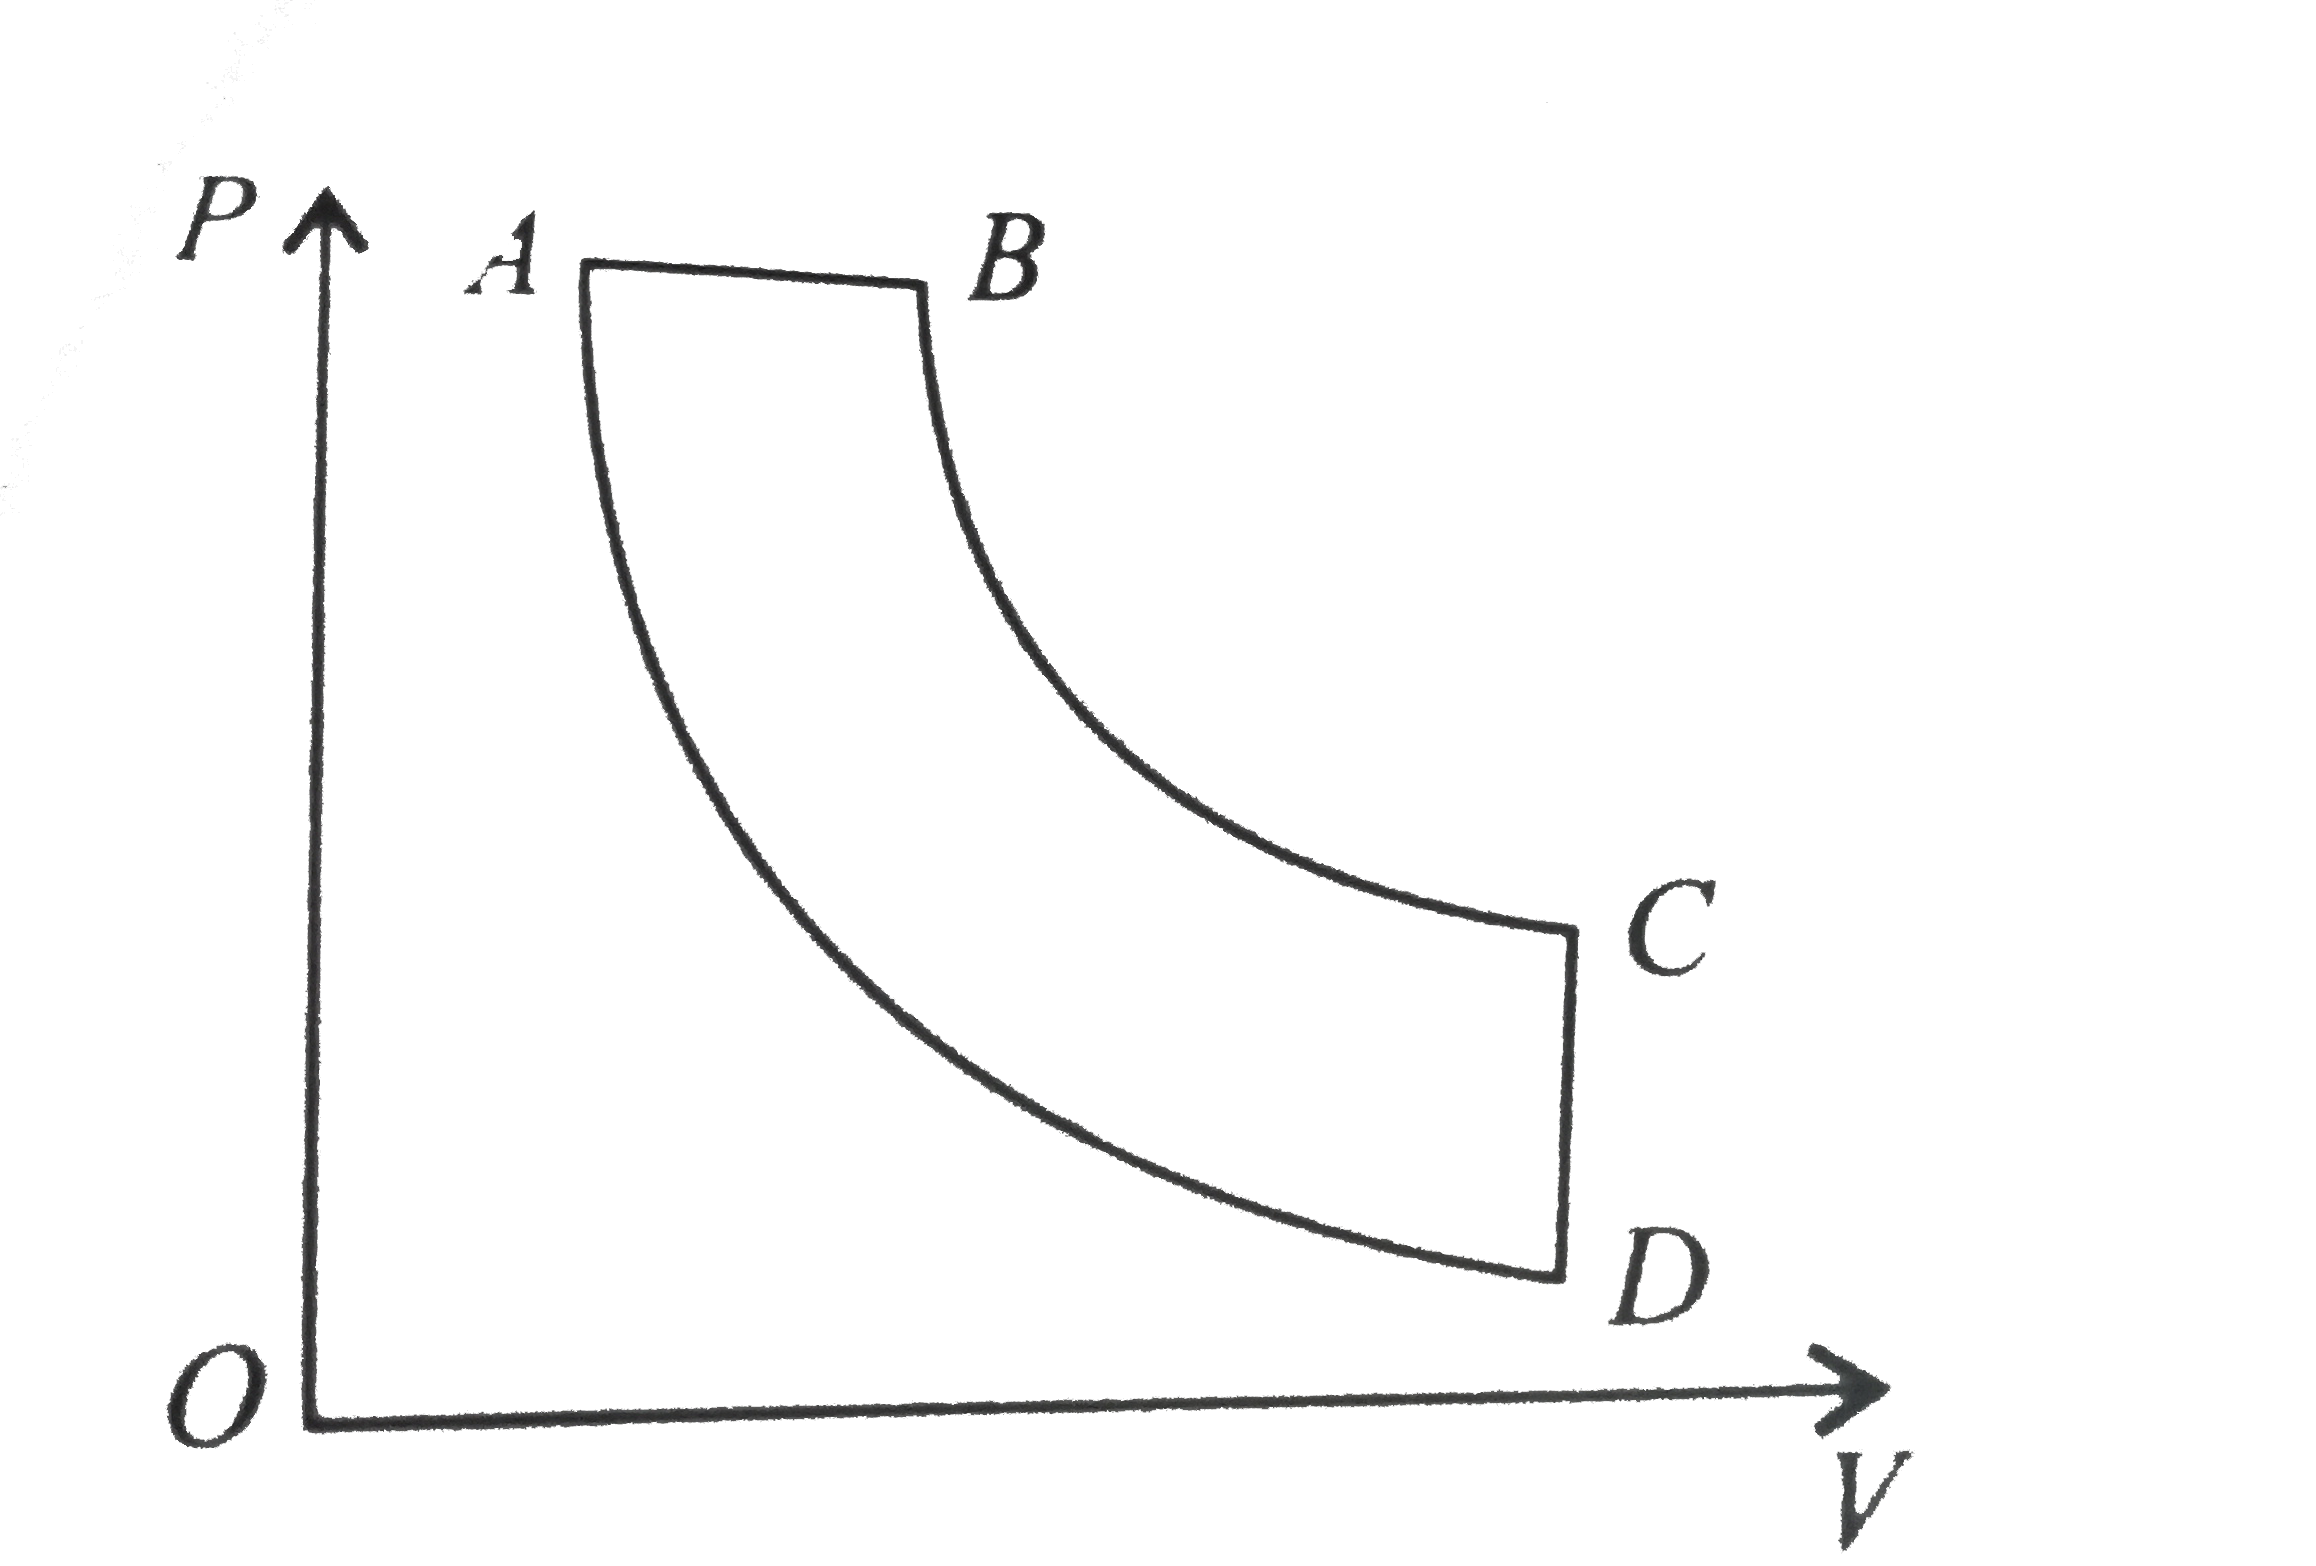
View SolutionIn the pressure-volume diagram given below, the isochoric, isothermal, isobaric, and isoentropic parts, respectively, are:
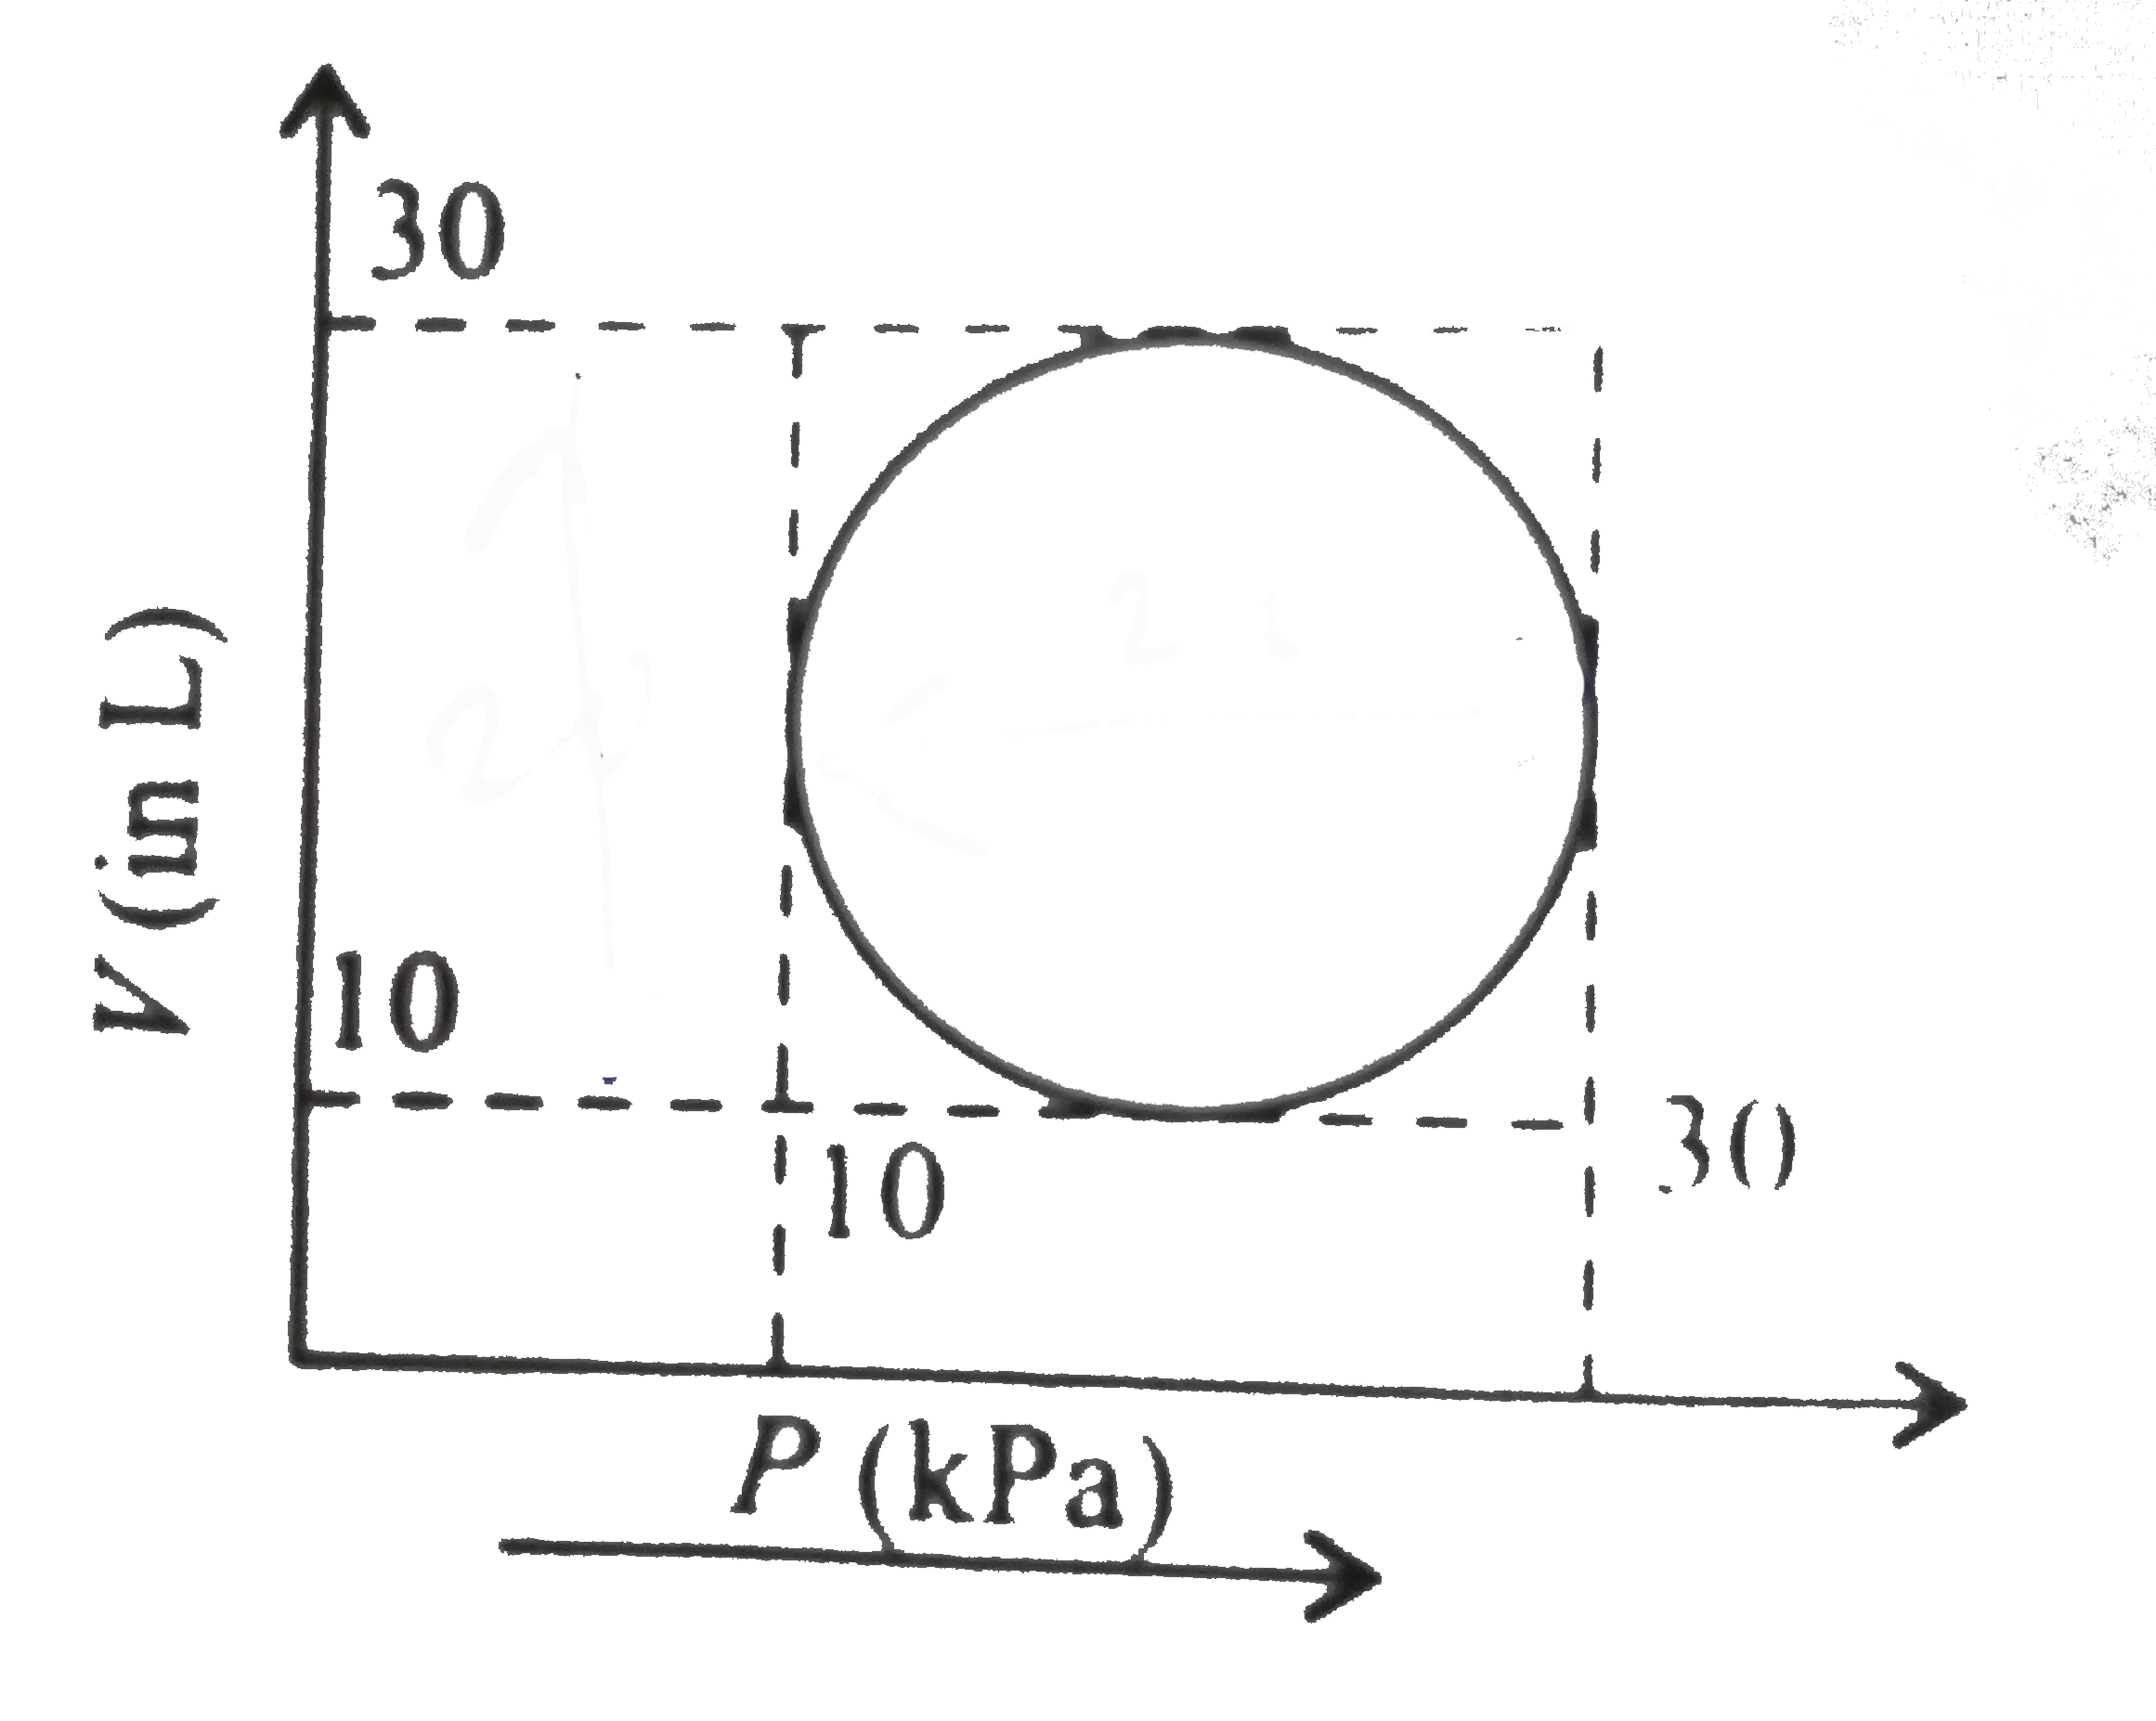
View SolutionHeat energy absorbed by a system in going through a cyclic process shown in figure is
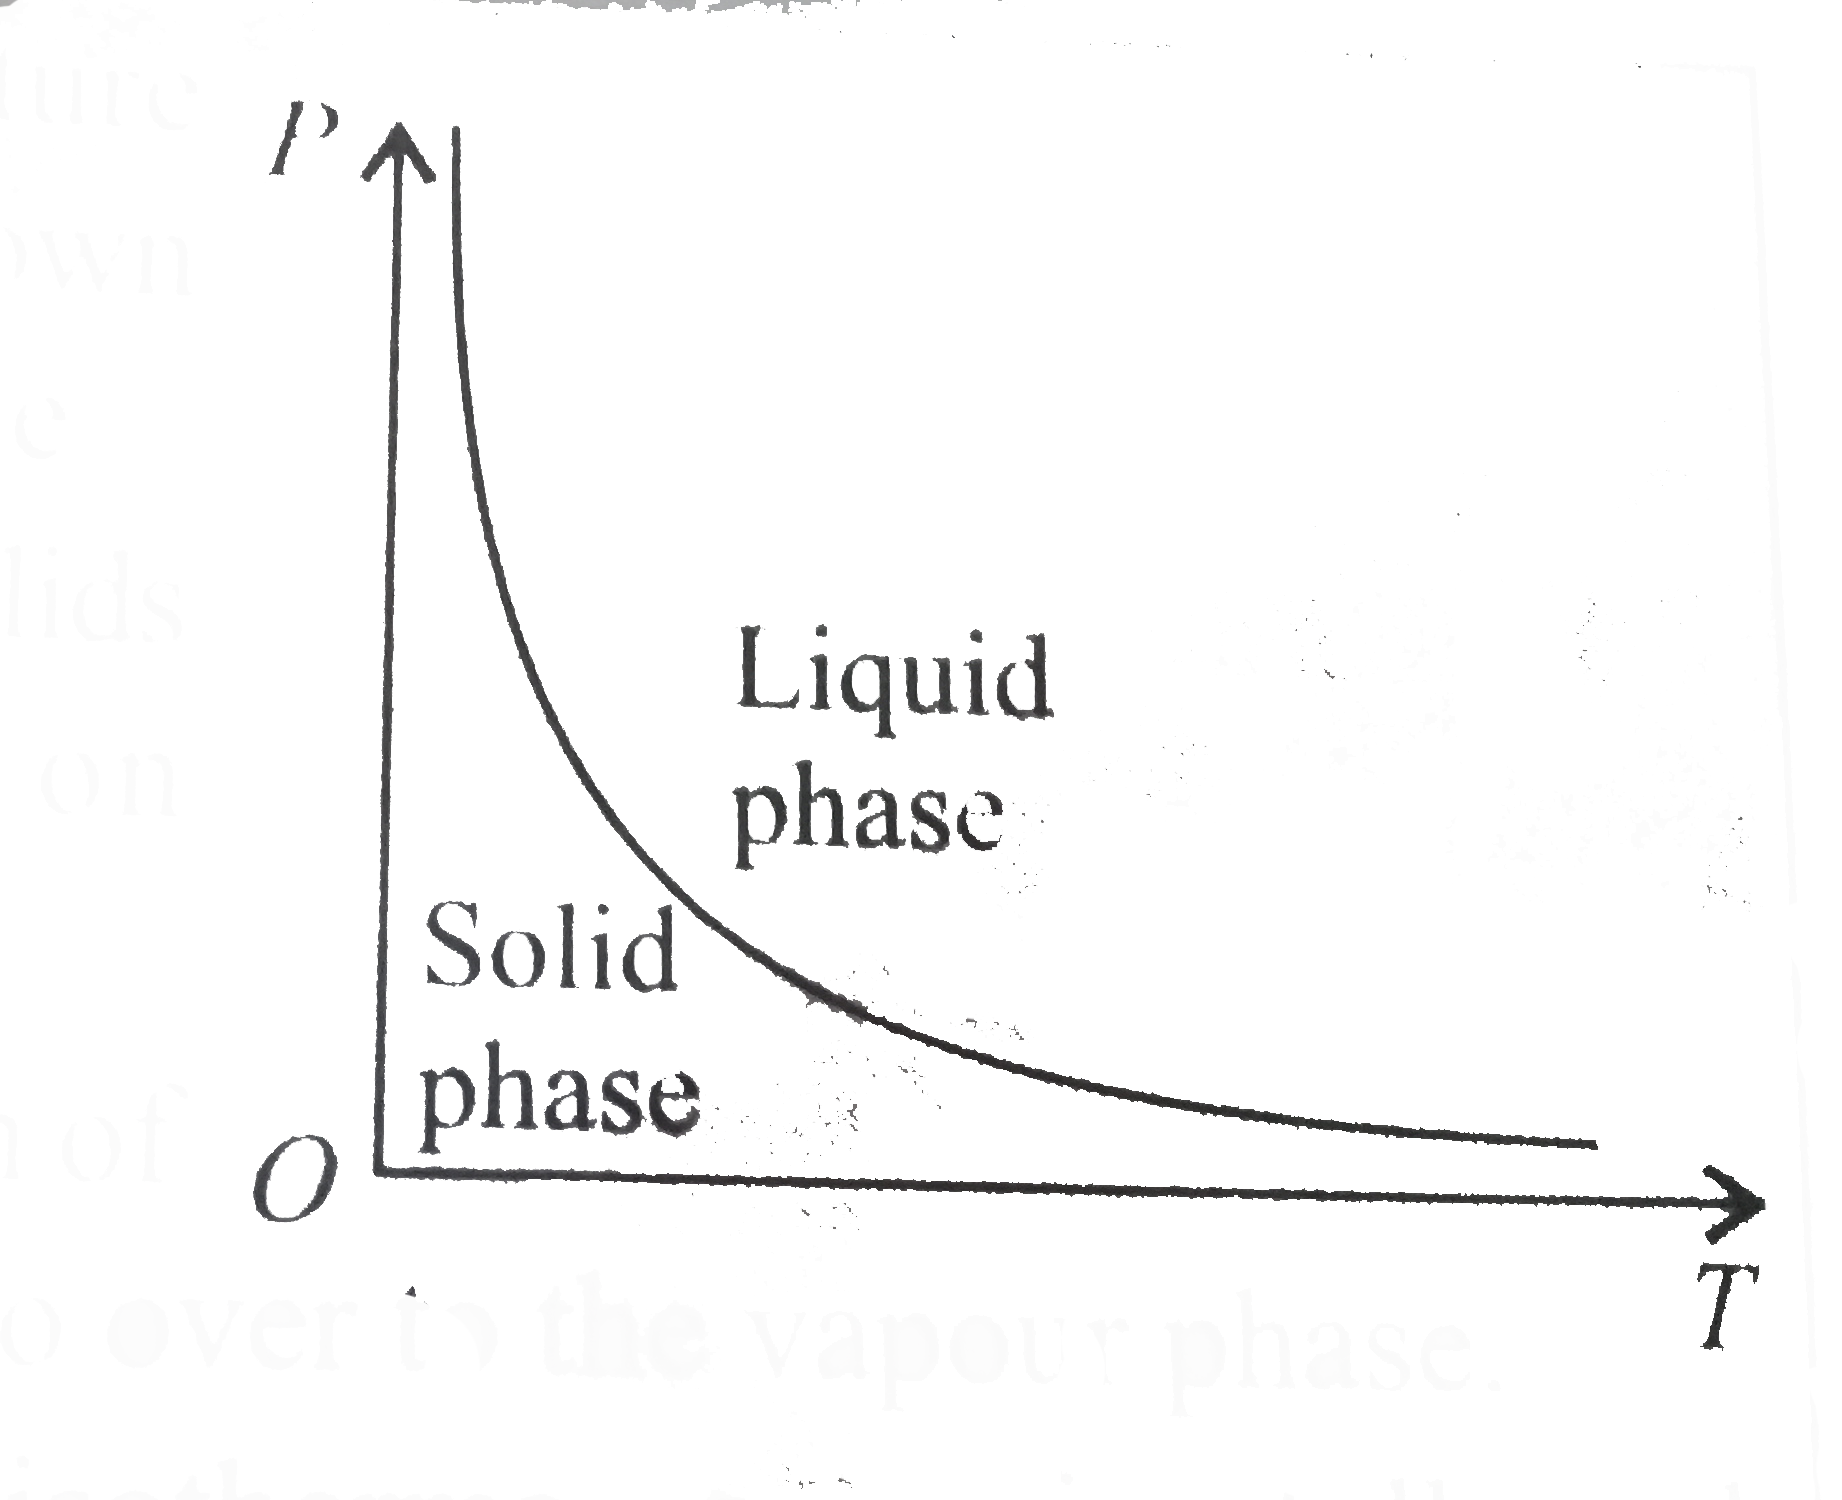
View SolutionThe pressure -temperature `(P-T)` phase diagram shown below corresponds to the
a. Curve of fusion of solids that expand on solidification.
b. Curve of sublimation of solides that directly go over to the vapour phase.
View SolutionGraph for specific heat at constant volume for a monoatomic gas
View SolutionA cyclic process `ABCD` is shown in the `P-V` diagram. Which of the following curves represents the same process?
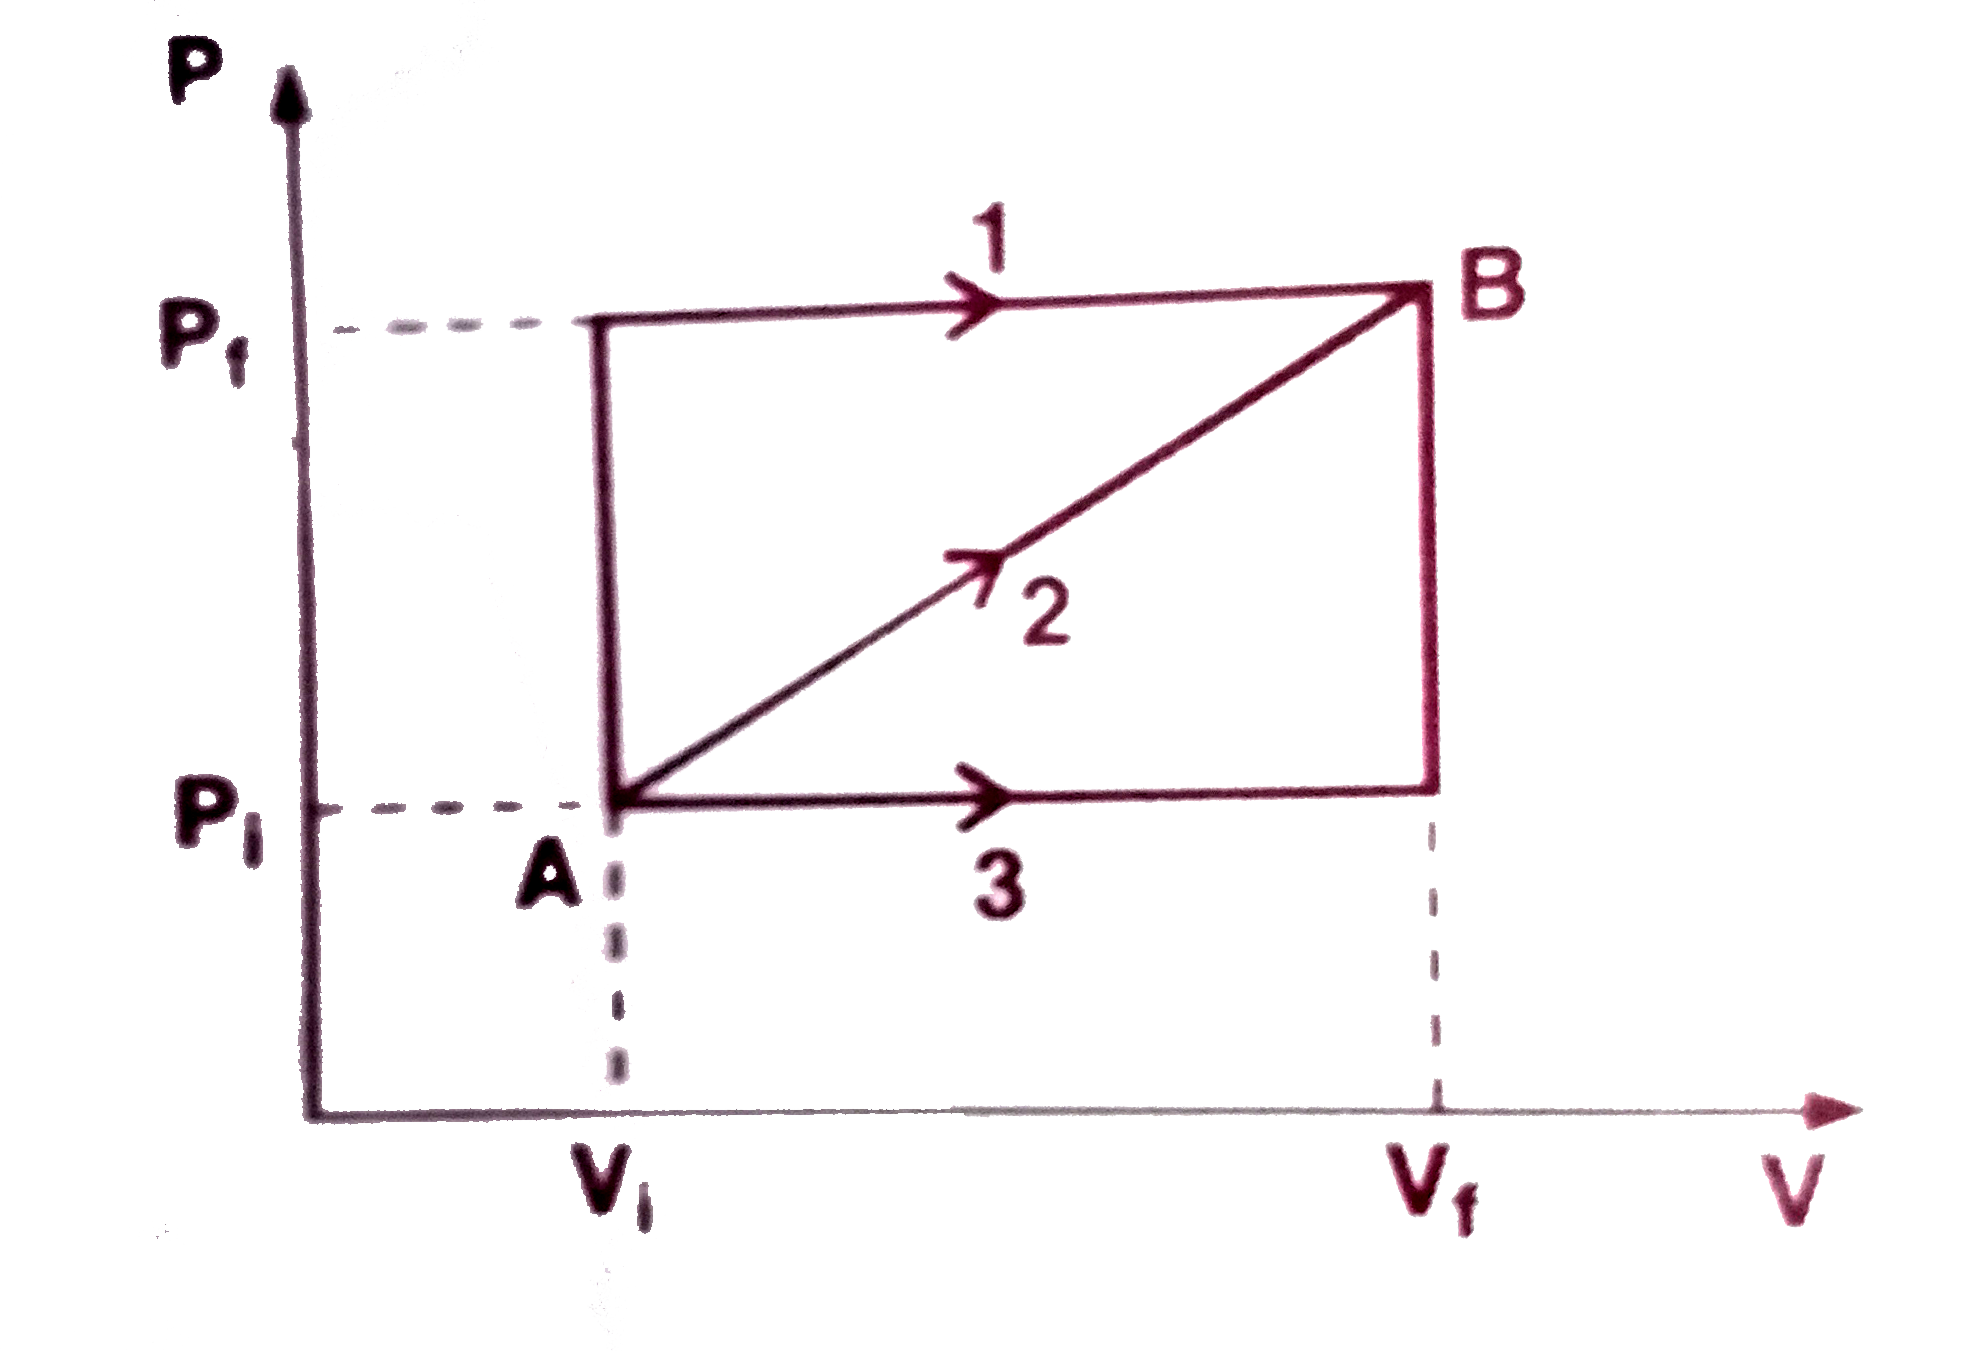
View SolutionA system is taken from state A to B through three different paths 1,2 and 3. The work done is maximum is :
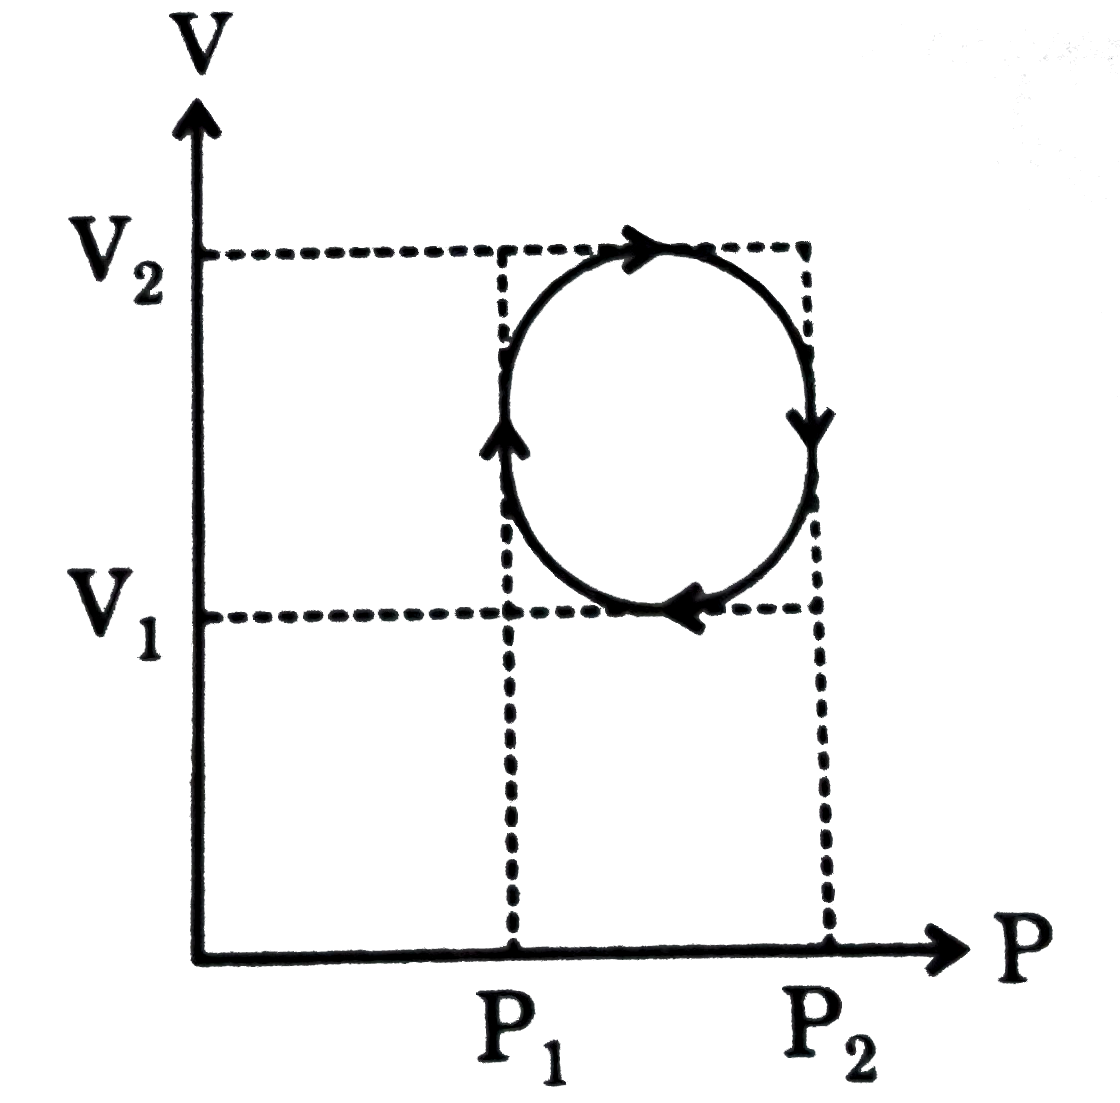
View SolutionIn the cyclic process shown in P-V diagram the magnitude of work done is :
View Solution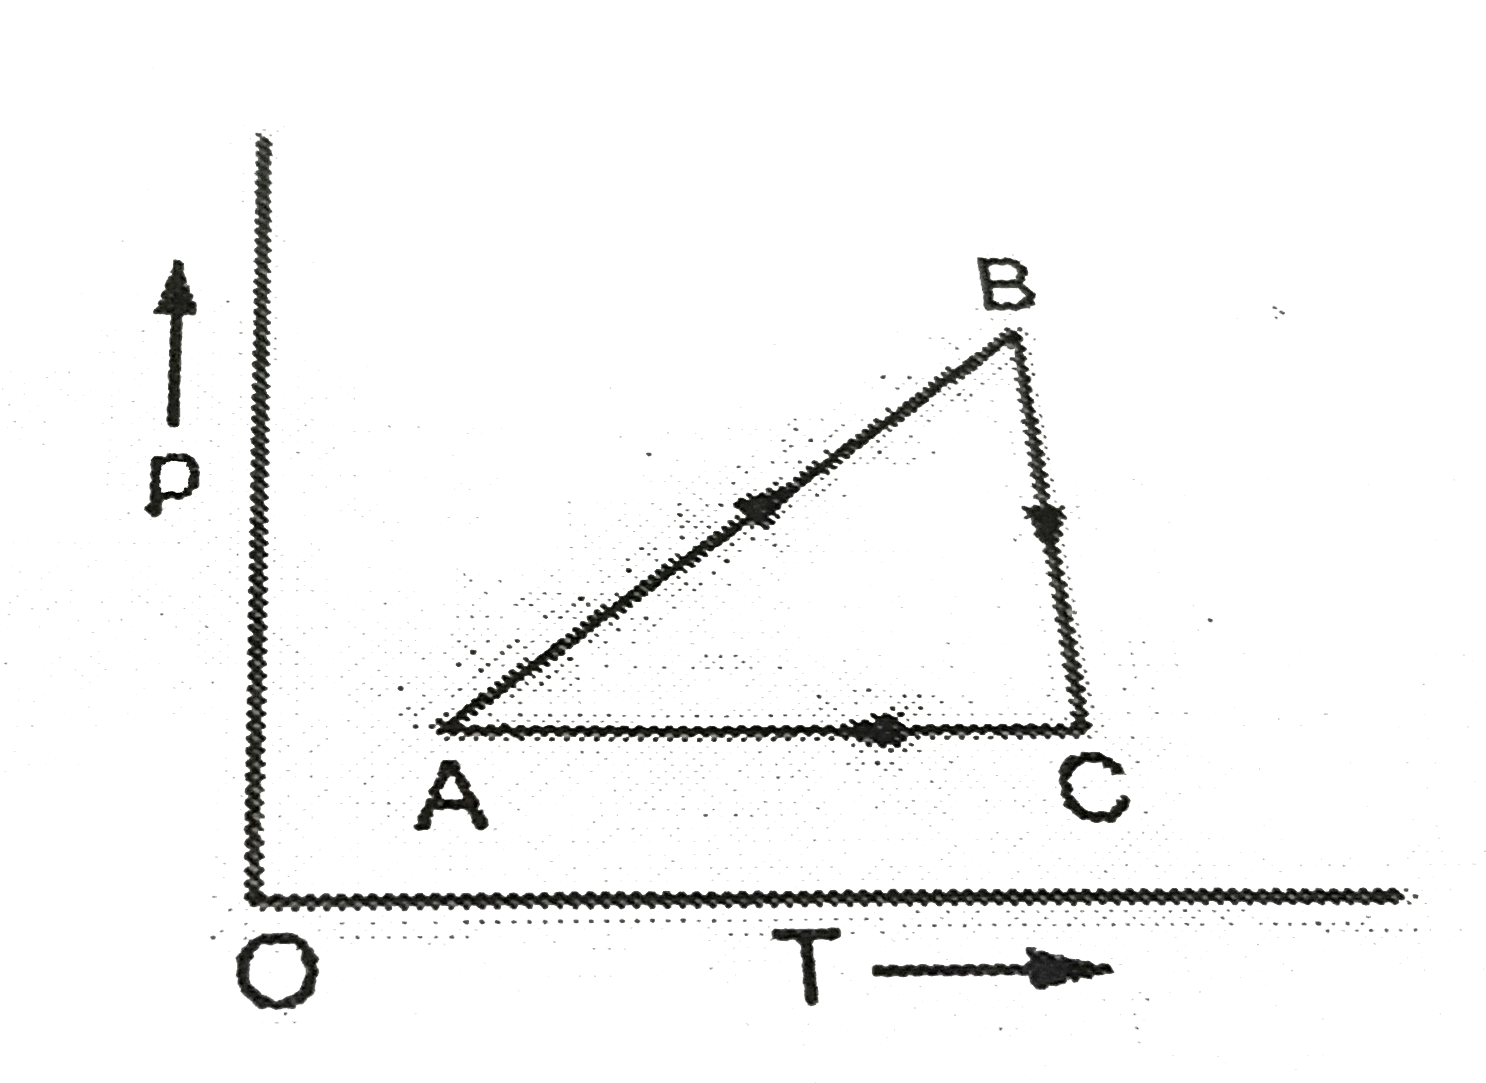
A cyclic process is shown in the p-T diagram. Which of the curves show the same process on a V-T diagram?
View Solution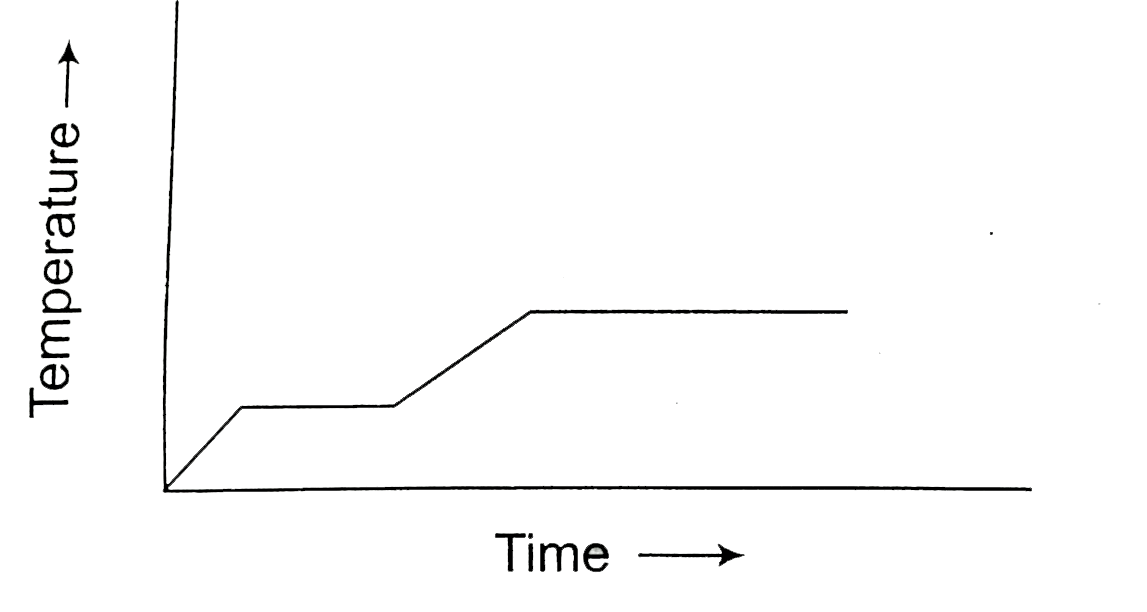
Heat is supplied to a certain homogeneous sample of matter, at a uniform rate. Its temperature is plotted against time, as shown Which of the following conclusions can be drawn?
(i) Its specific heat capacity is greater in the solid state than the liquid state.
(ii) Its specific heat capacity is greater in the liquid state than in the solid state.
(iii) Its latent heat of vaporization is greater than its latent heat of fusion.
(iv) Its latent heat of vaporization is smaller than its latent heat of fusion
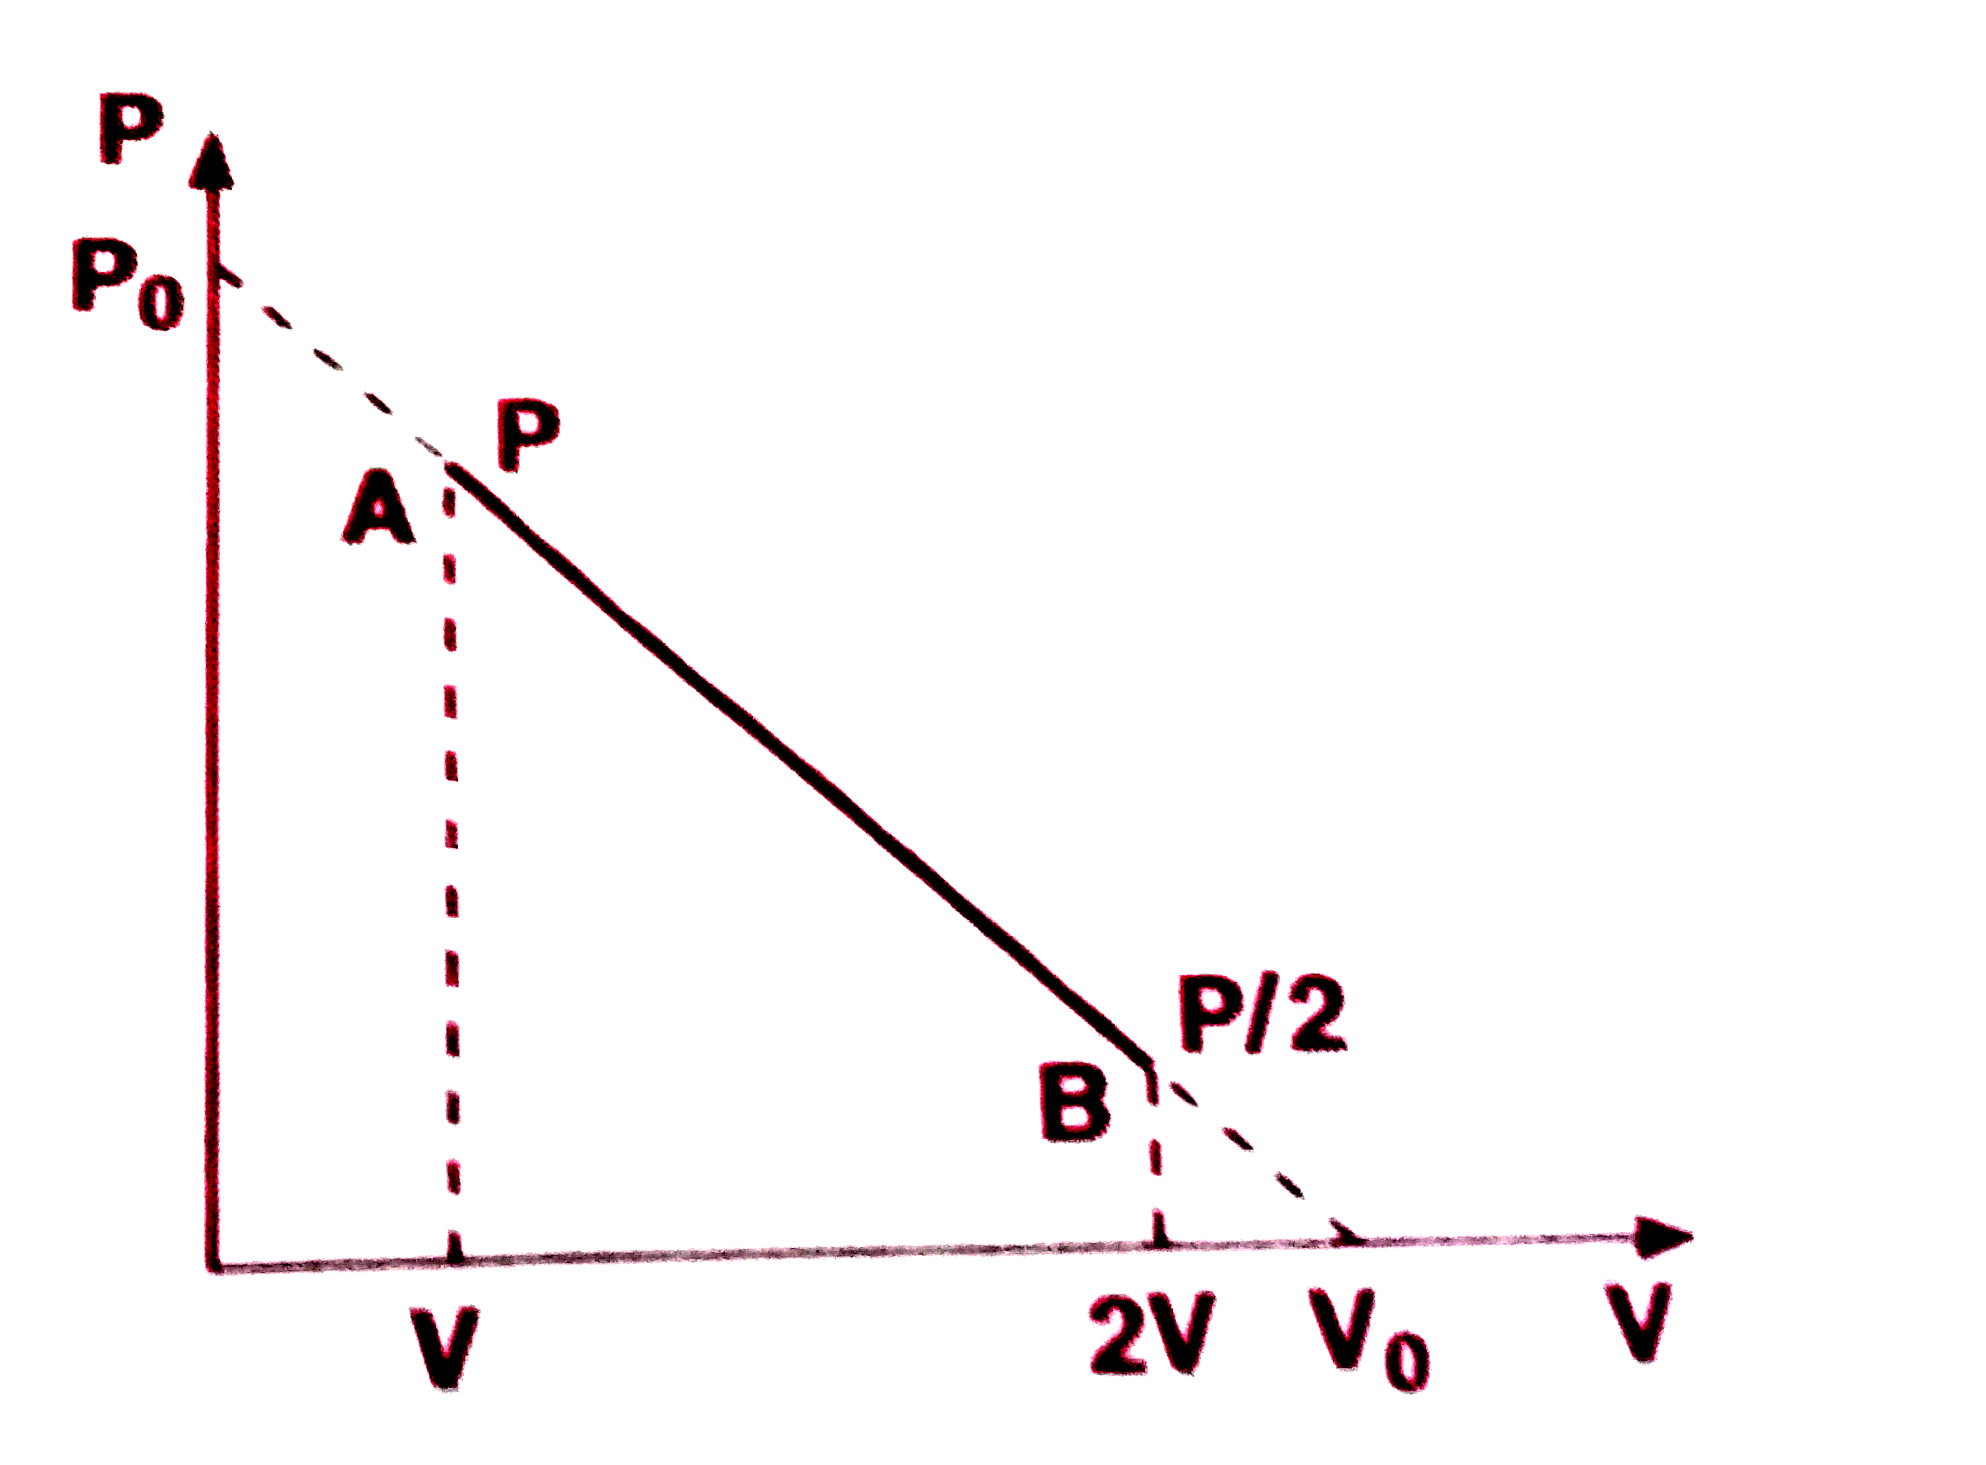
View SolutionAn ideal gas is taken from the state A (pressure P, volume V) to the state B (pressure P/2, volume 2V) along a straight line path in the P-V diagram. Select the wrong statement from the following:
View SolutionThe radioactive nucleus of an element X decays to a stable nucleus of element Y.A graph of the rate of romation of Y against time would look like:
View SolutionIn photoelectric effect the slope of straight line graph between stopping potential `(V_(0))` and freqency of incident light (v) gives:
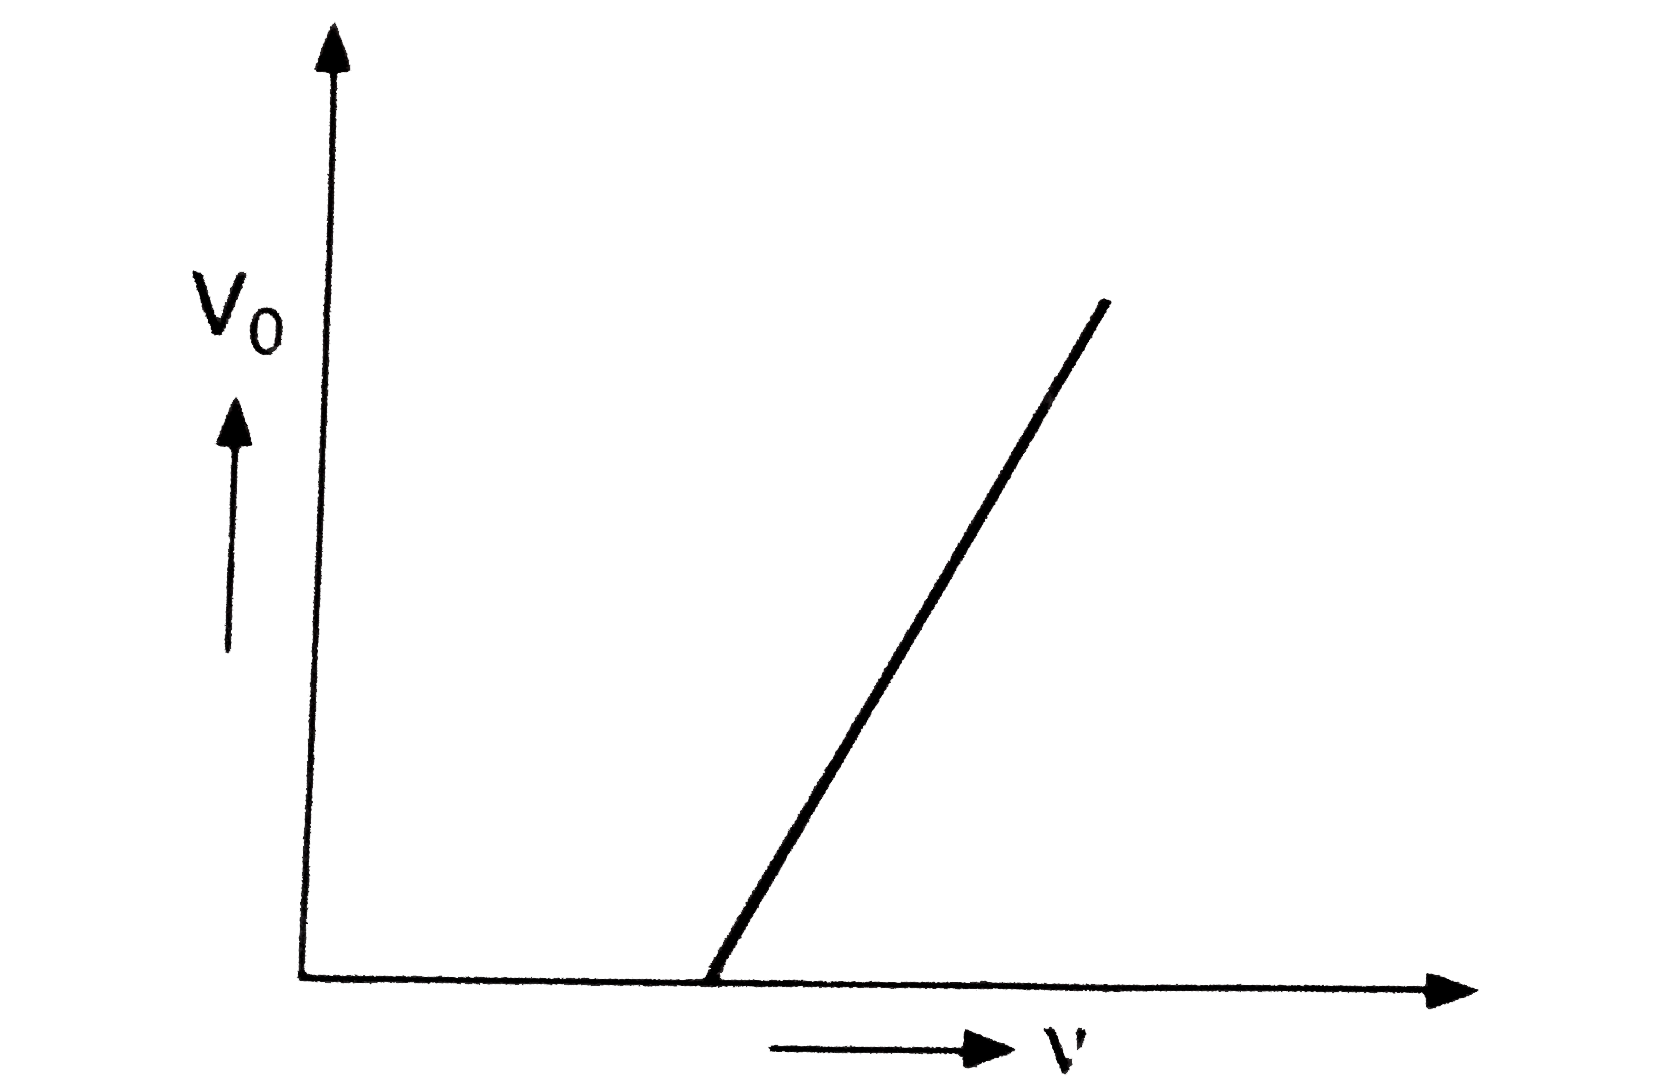
View SolutionThe stopping potential as a function of the frequency of the incident radiation is plotted for two different photoelectric surfaces `A` and `B` . The graphs show that work function of `A` is

View SolutionWhich of the following is the graph between the frequency (v) of the incident radiations and the stopping potential ?
View SolutionWhich of the following figure represents the variation of particle momentum and the associated de - Broglie wavelength ?
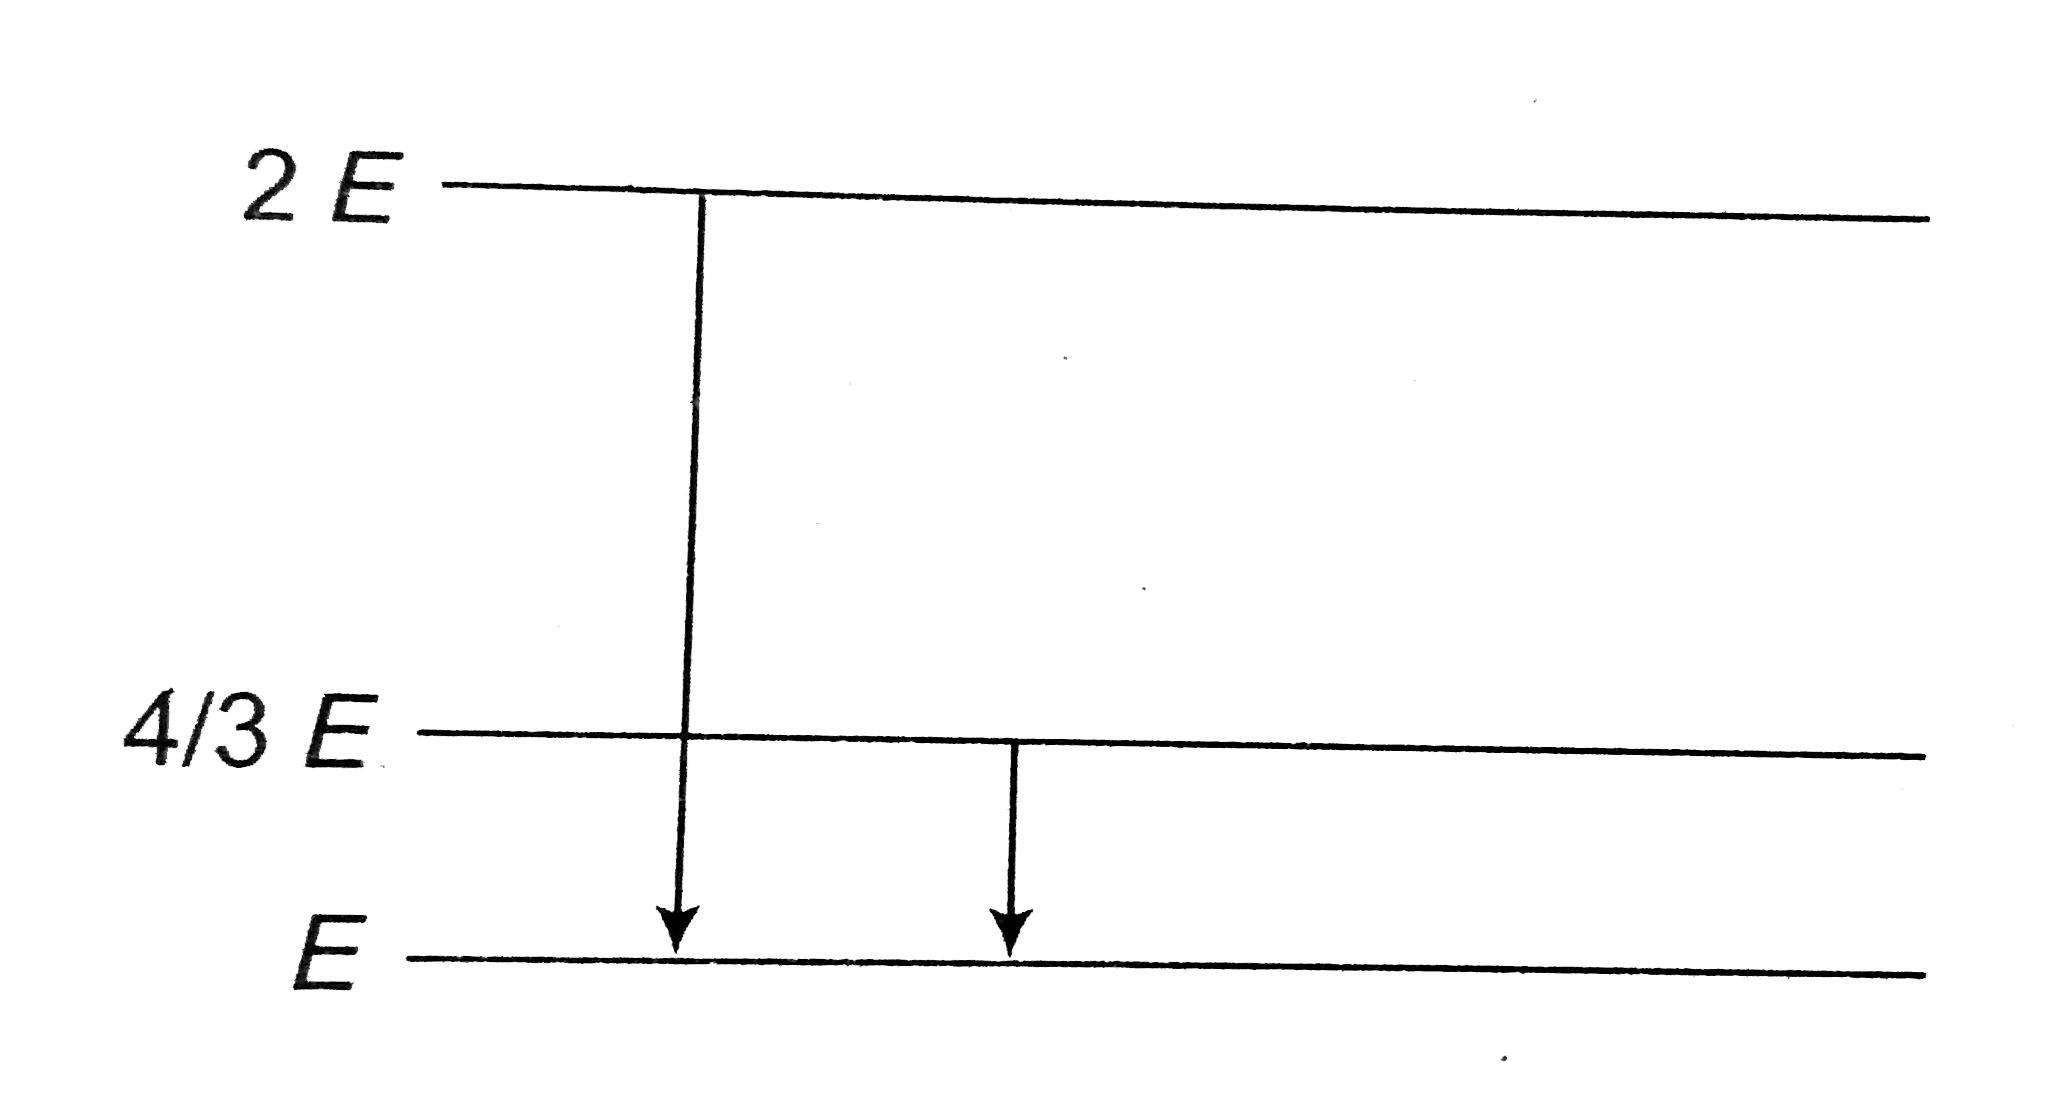
View SolutionThe follwing diagram indicates the energy levels of a certain atom when the system moves from `2E` level to `E`, a photon of wavelength `lambda` is emitted. The wavelength of photon produced during its transition from `(4E)/(3)` level to `E` is
View SolutionThe maximu kinetic energy `(E_(k))` of the photoelectron varies with frequency (v) of the incident light as shown by the curve:
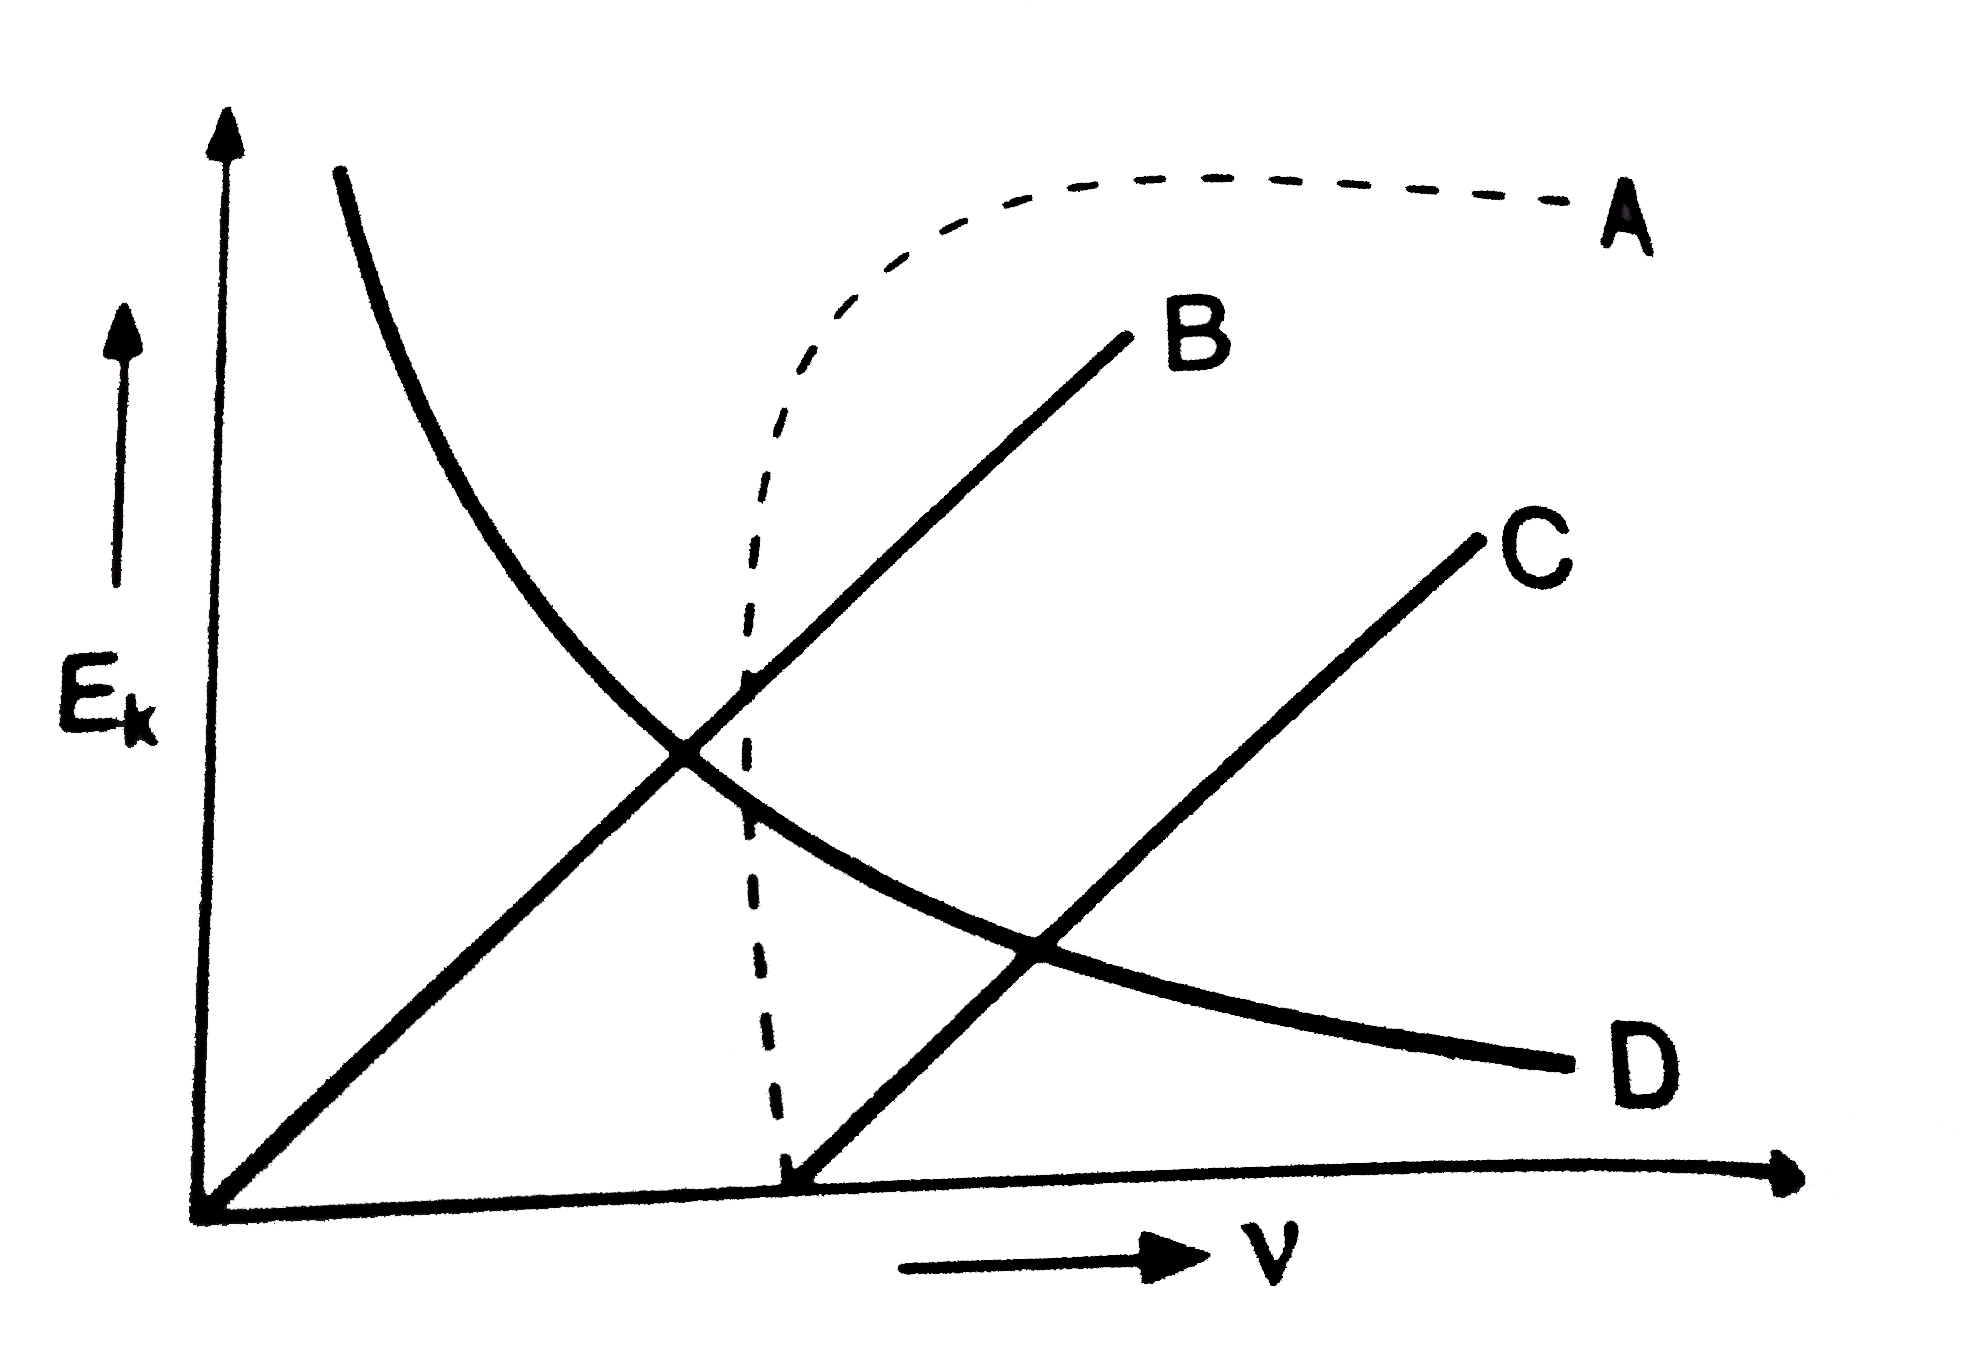
View SolutionThe following graphs illustrate:
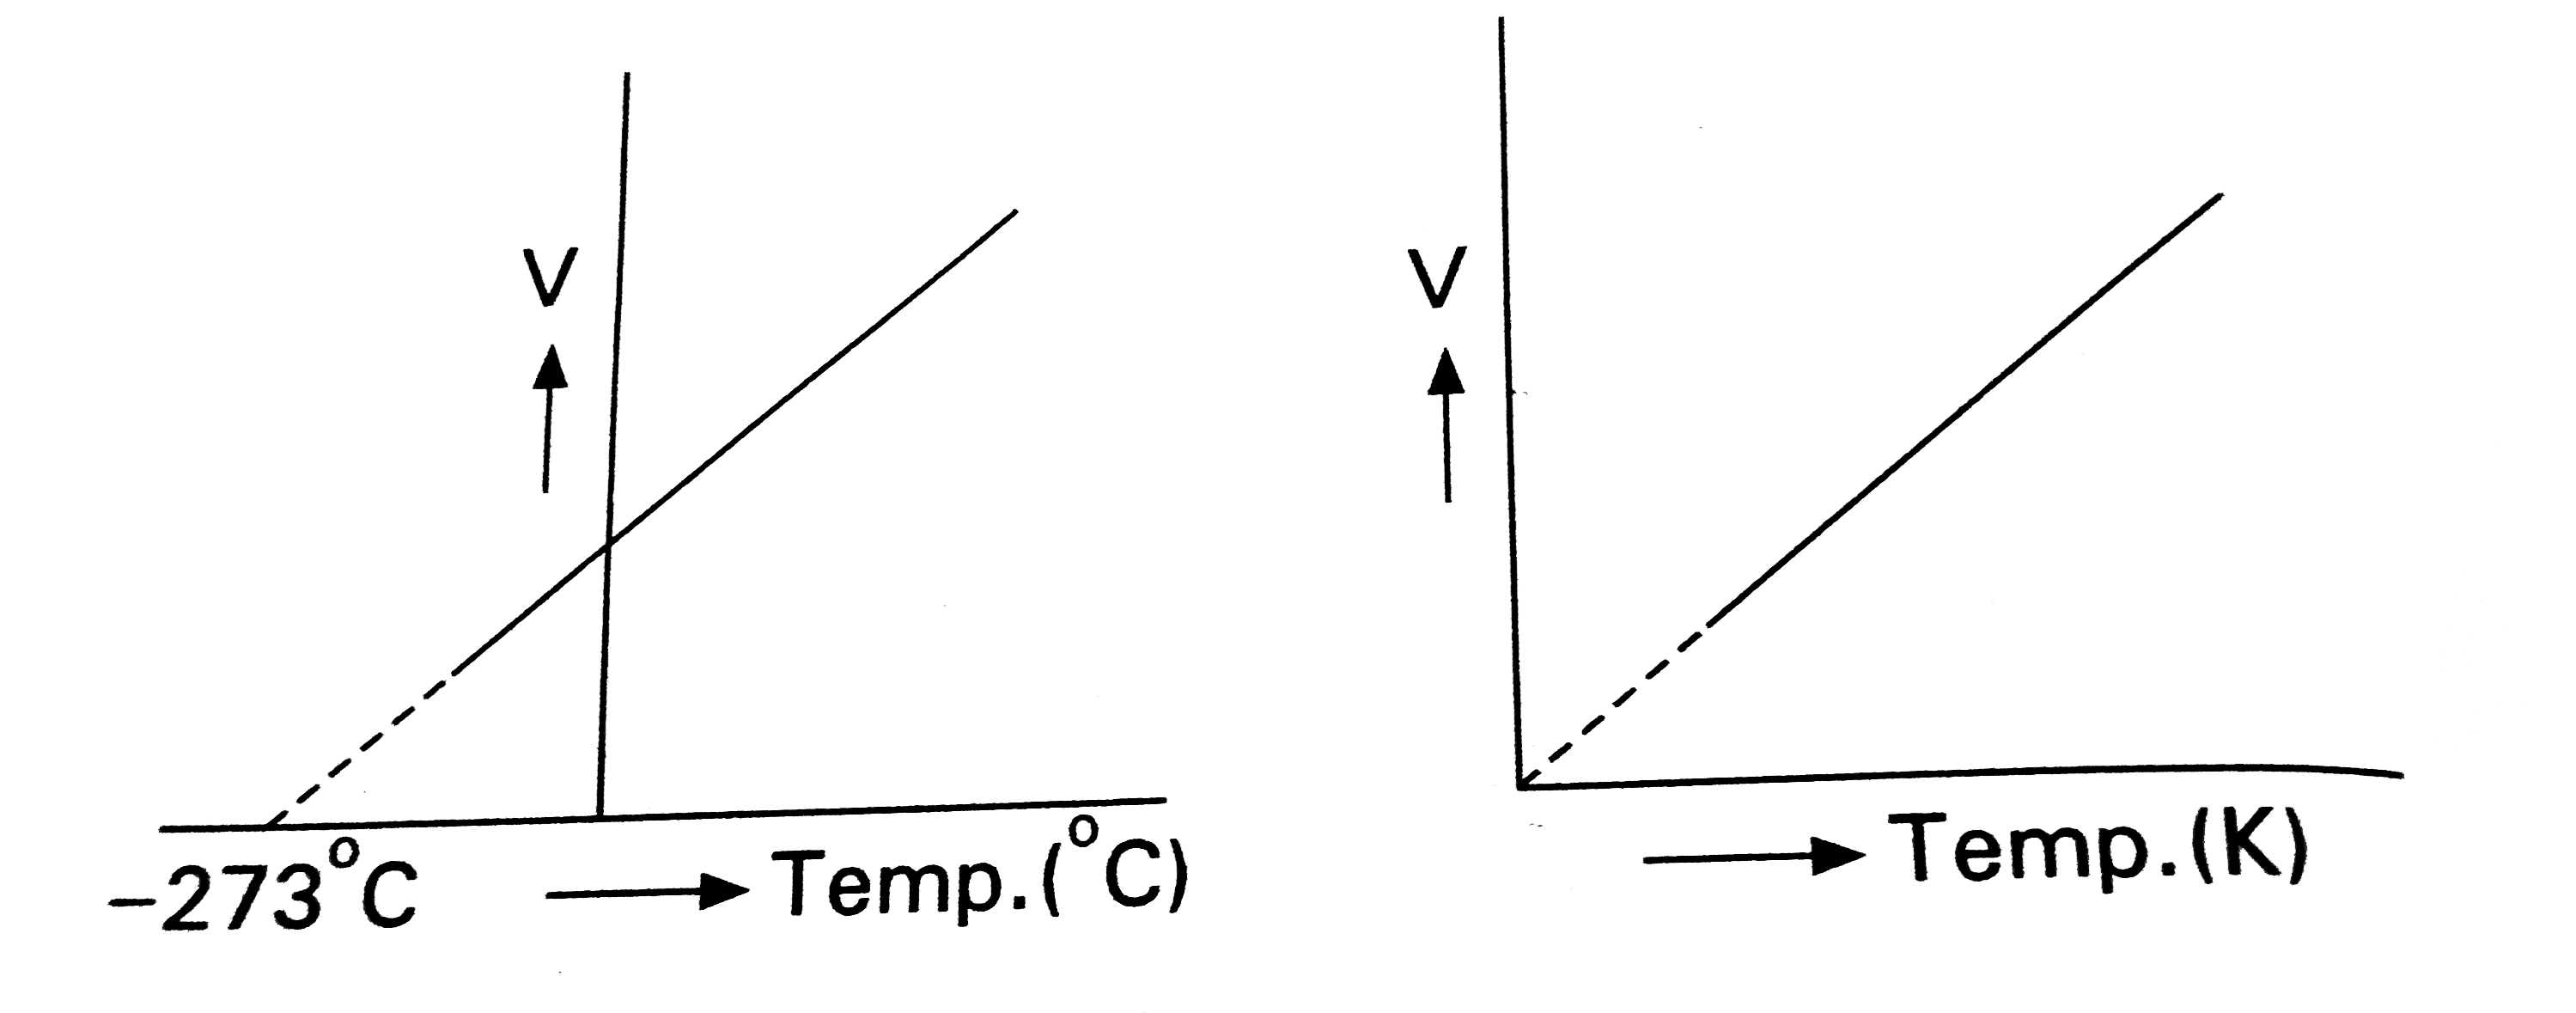
View SolutionIn the following graph:
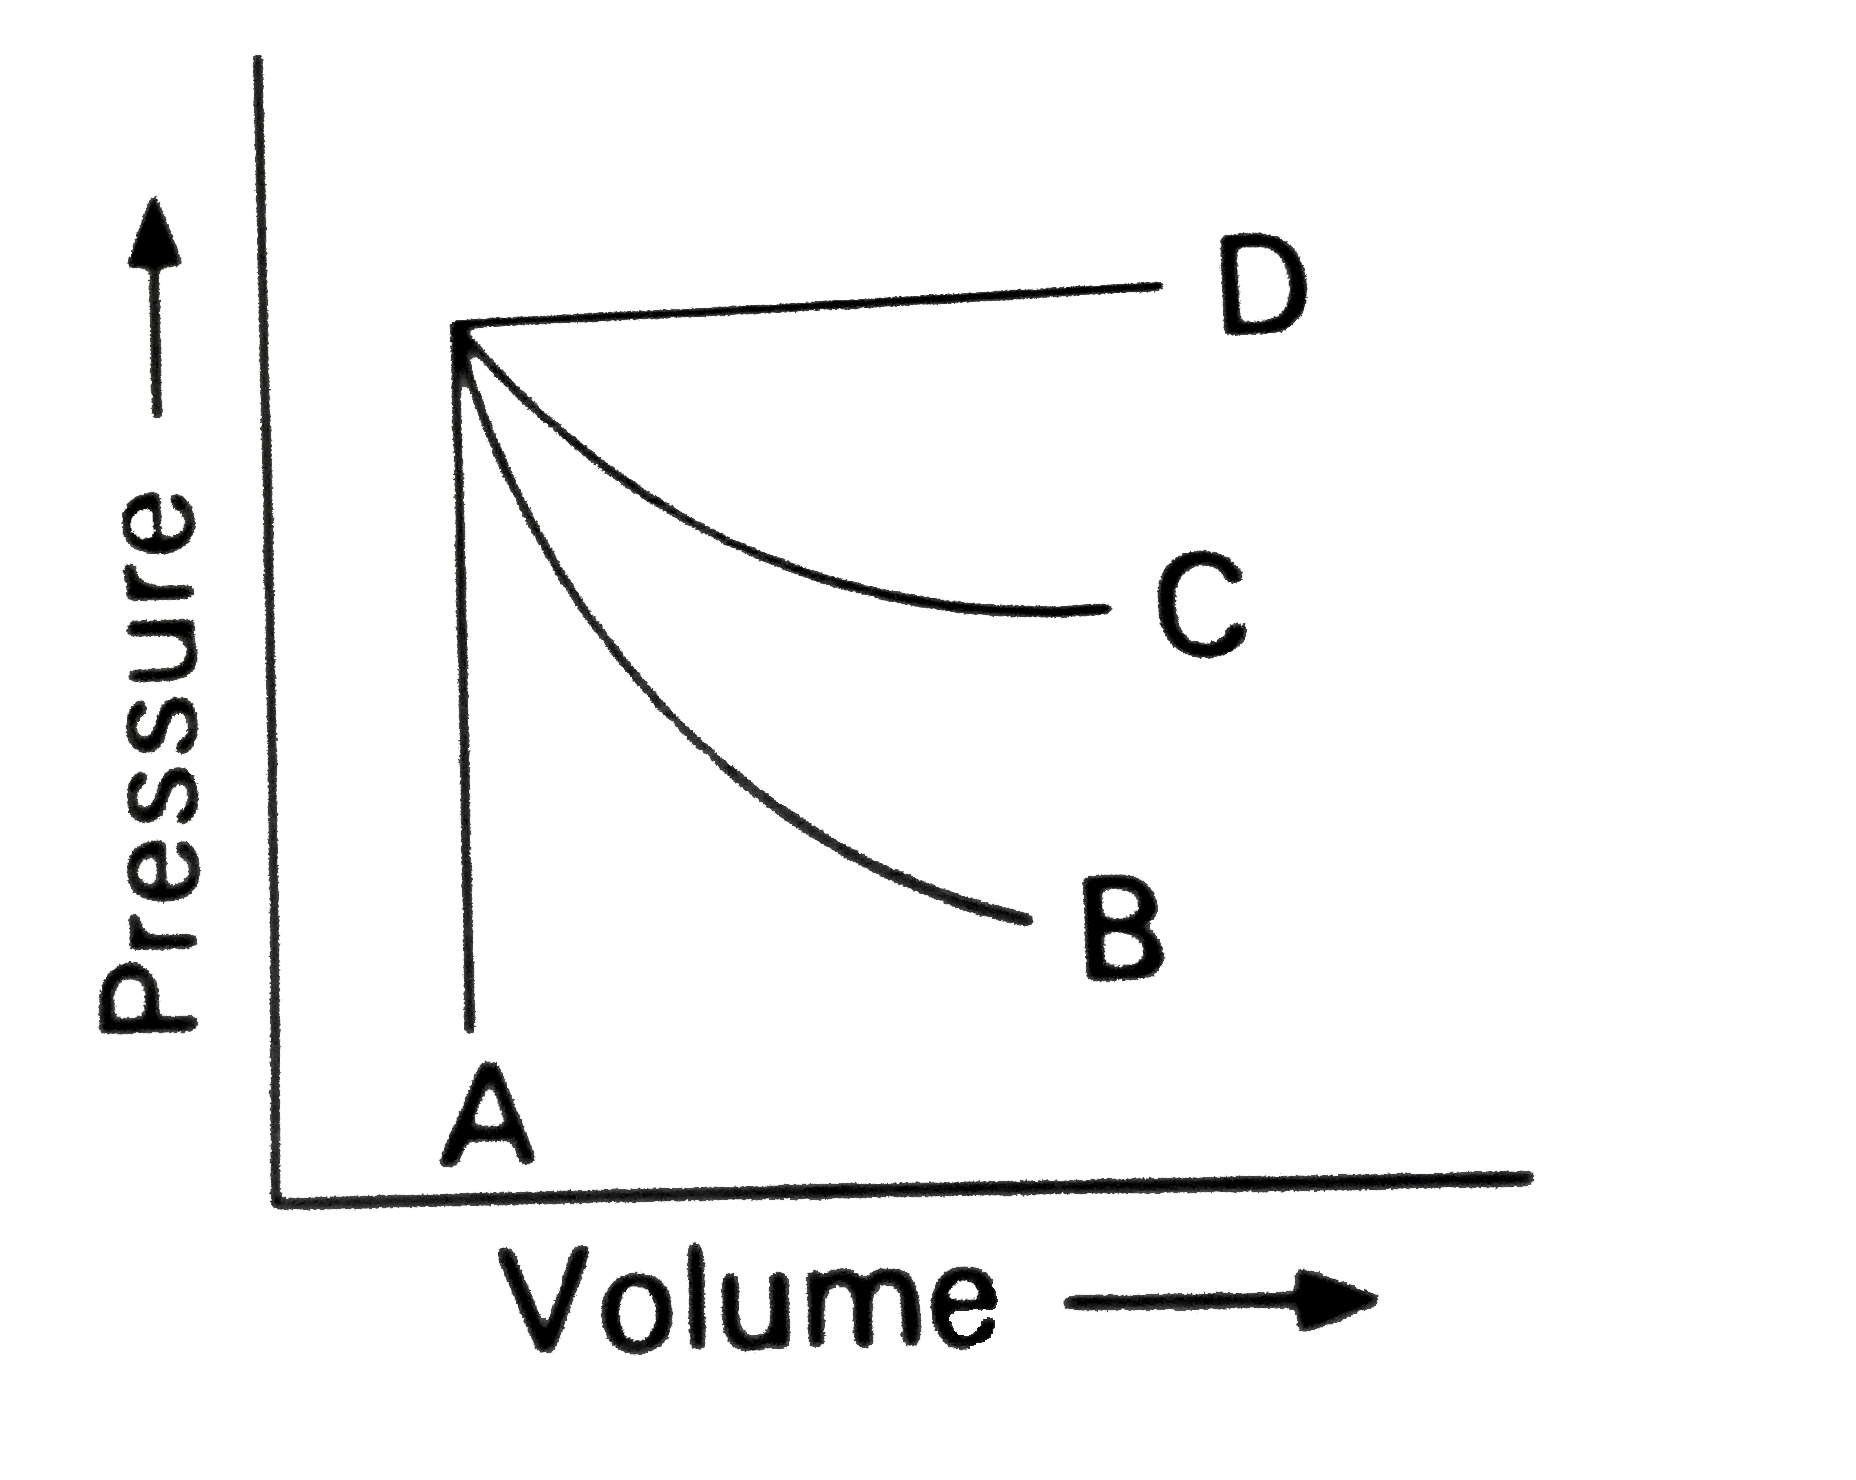
View SolutionThe variation of `^^_(m)` of acetic acid with concentration is correctly represented by
View SolutionDistribution of molecules with velocity is represented by the curve
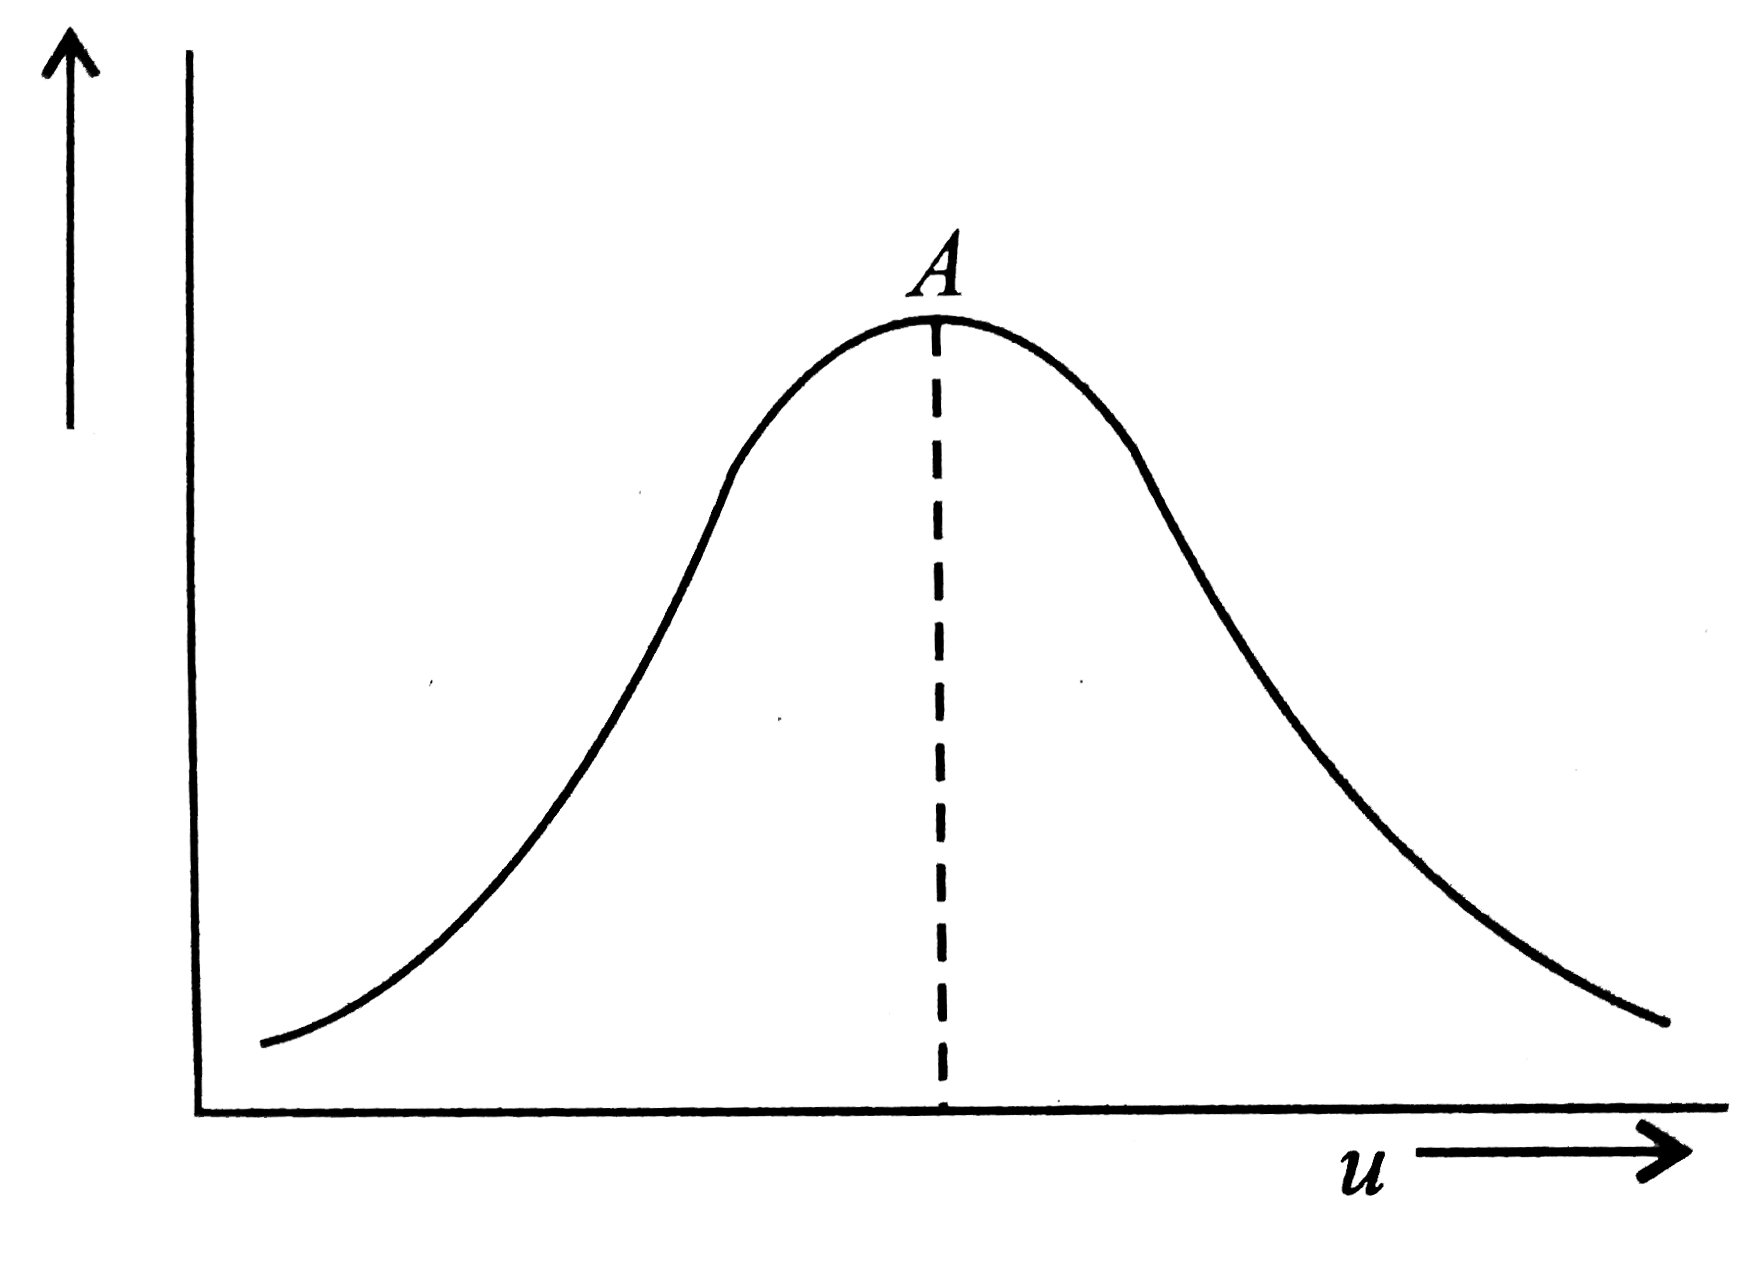
Velocity corresponding to point `A` is
View Solution`CH_(3)COOH` is neutralized by NaOH. Conductometric titration curve will be of the type:
View SolutionIf for a given substance, melting point is `T_(B)` and freezing point is `T_(A)` then correct variation of entropy is by graph between entropy change and temperature is
View SolutionWhich of the following represents zero order reaction ?
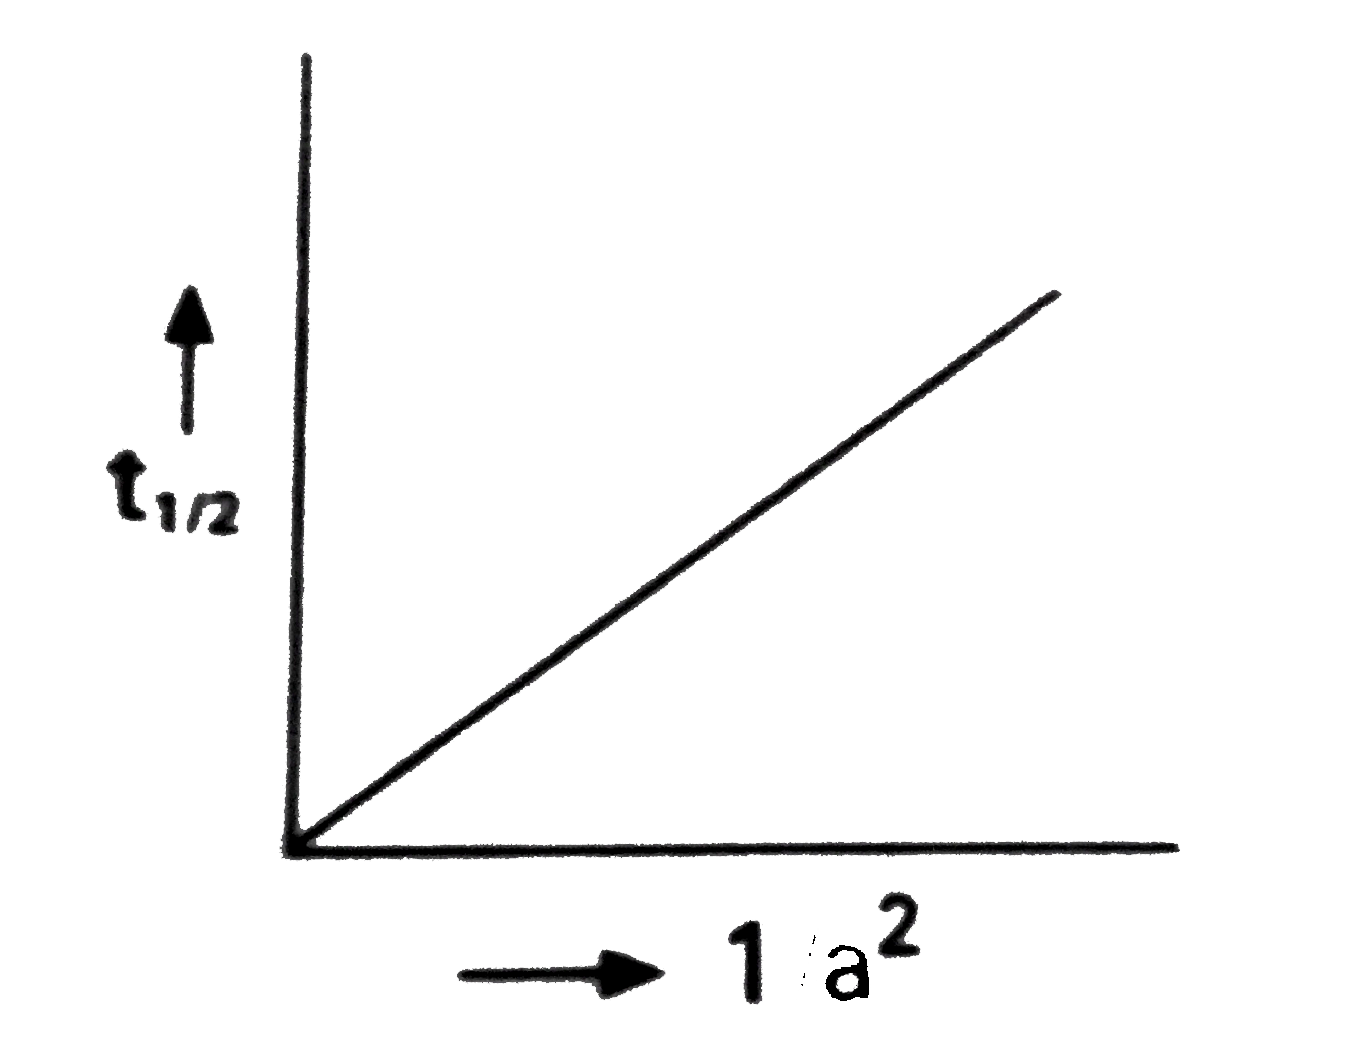
View SolutionThis graph represents:
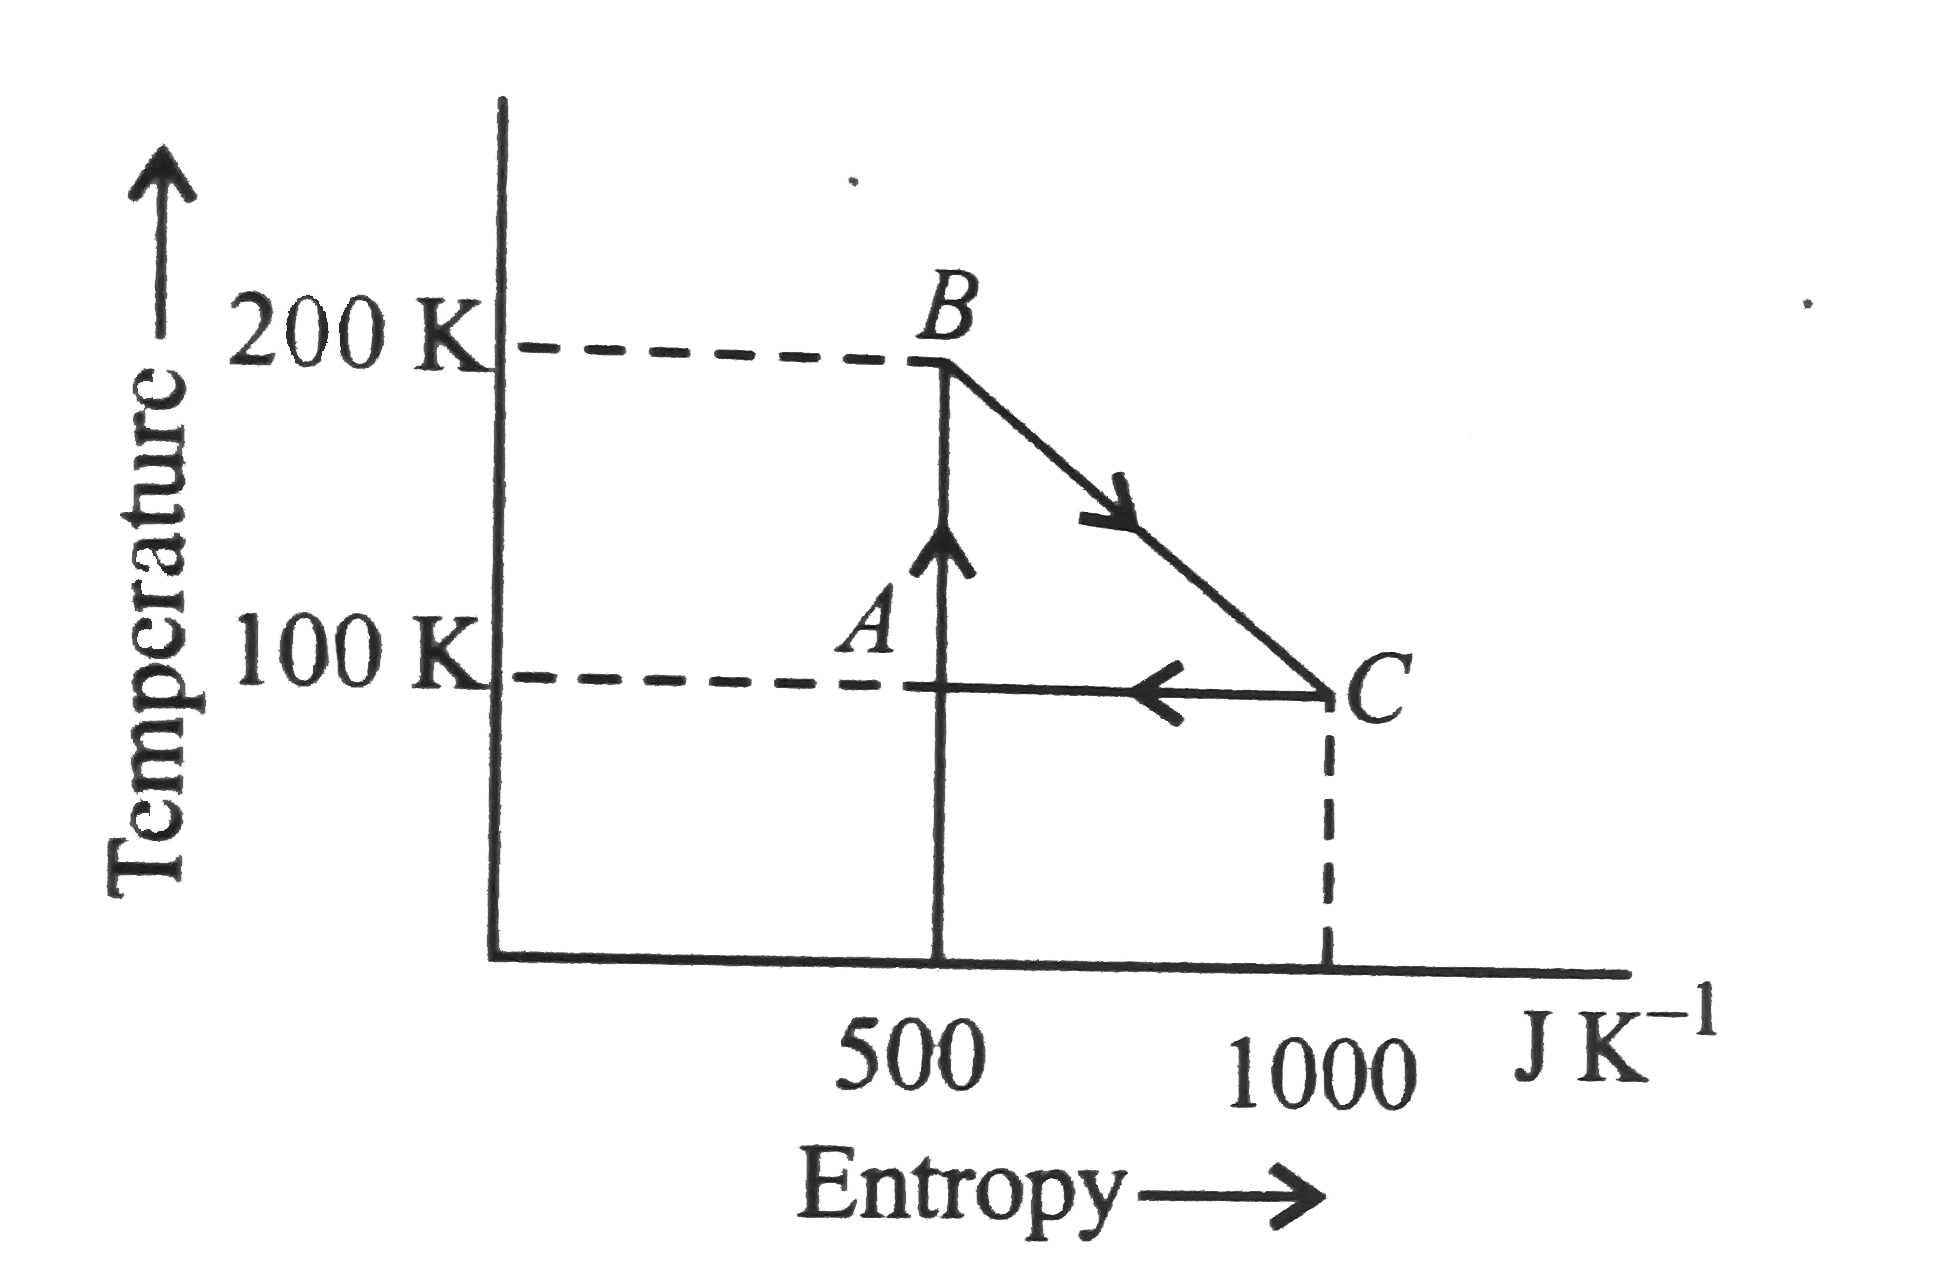
View SolutionThe efficiency of the reversible cycle shown in the given figure is
View SolutionWhich of the following curves represents the chemical adsorption ?
View SolutionEnergy of electron varies with atomic number as the following curve/line:
View SolutionA radioactive sample consists of two distinct species having equal number of atoms initially. The mean life of one species is `tau` and that of the other is `5 tau`. The decay products in both cases are stable. A plot is made of the total number of radioactive nuclei as a function of time. Which of the following figure best represents the form of this plot?
(a), (b), (c), (d)

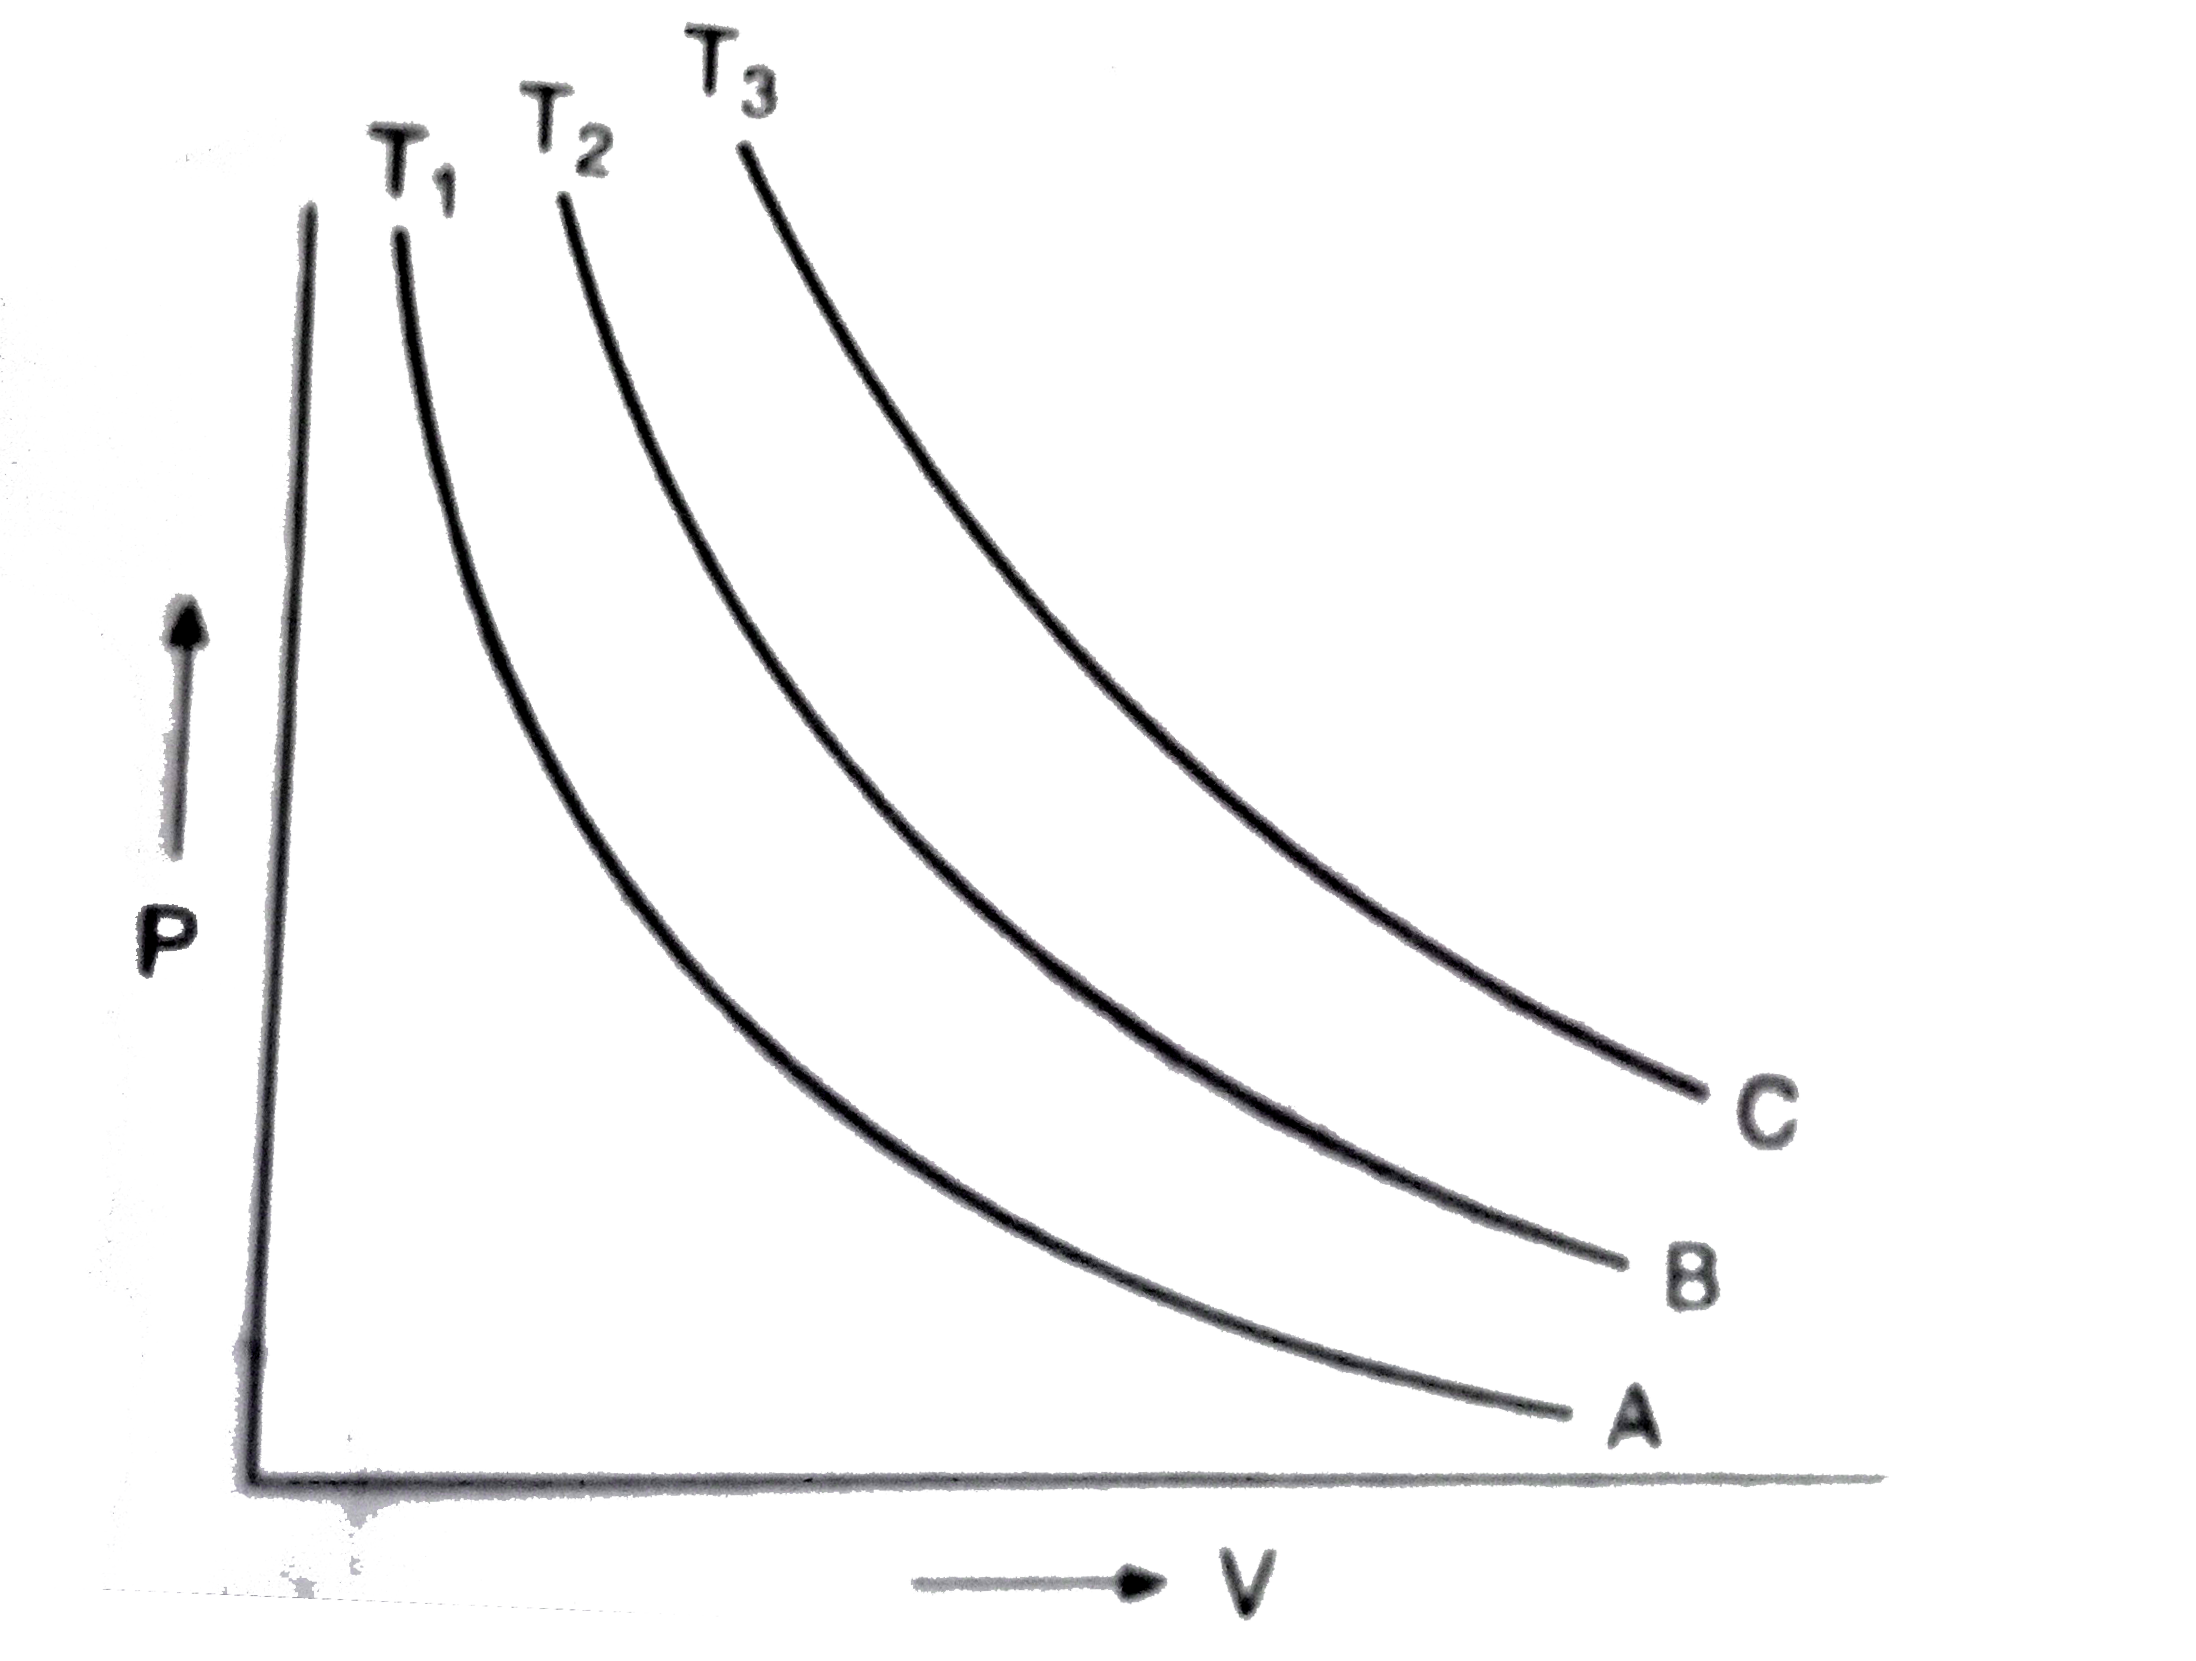
View SolutionIn following isothermal graphs A, B and C at temperatures `T_(1), T_(2)` and `T_(3)`, the correct order of temperatures will be :
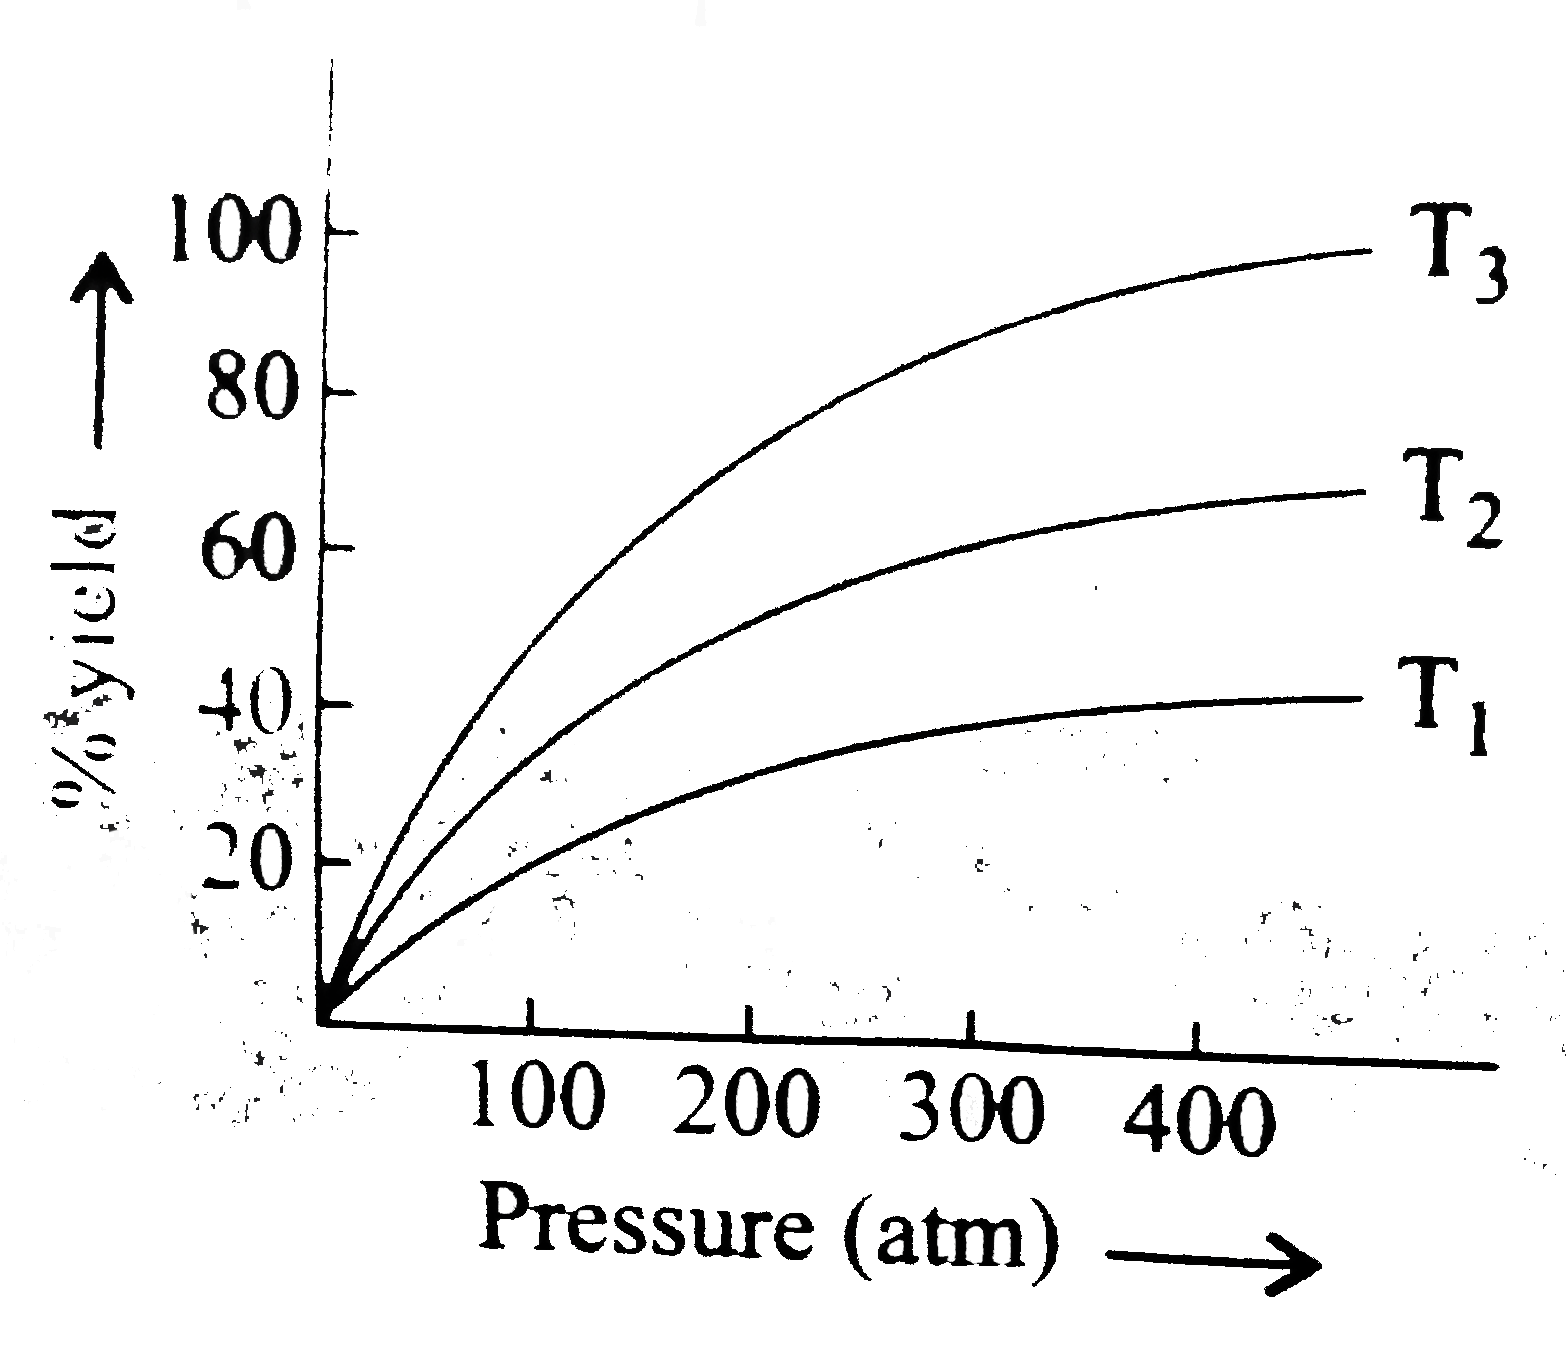
View Solution`N_(2)(g)+3H_(2)(g) hArr 2NH_(3)(g), DeltaH^(ɵ)=-22.4 kJ`
The pressure inside the chamber is `100` atm and temperature at `300 K`
The preparation of ammonia by Haber's process is an exothermic reaction. If the preparation follows the following temperature-pressure relationship for its `%` yield. Then for temperature `T_(1), T_(2)` and `T_(3)` the correct option is:
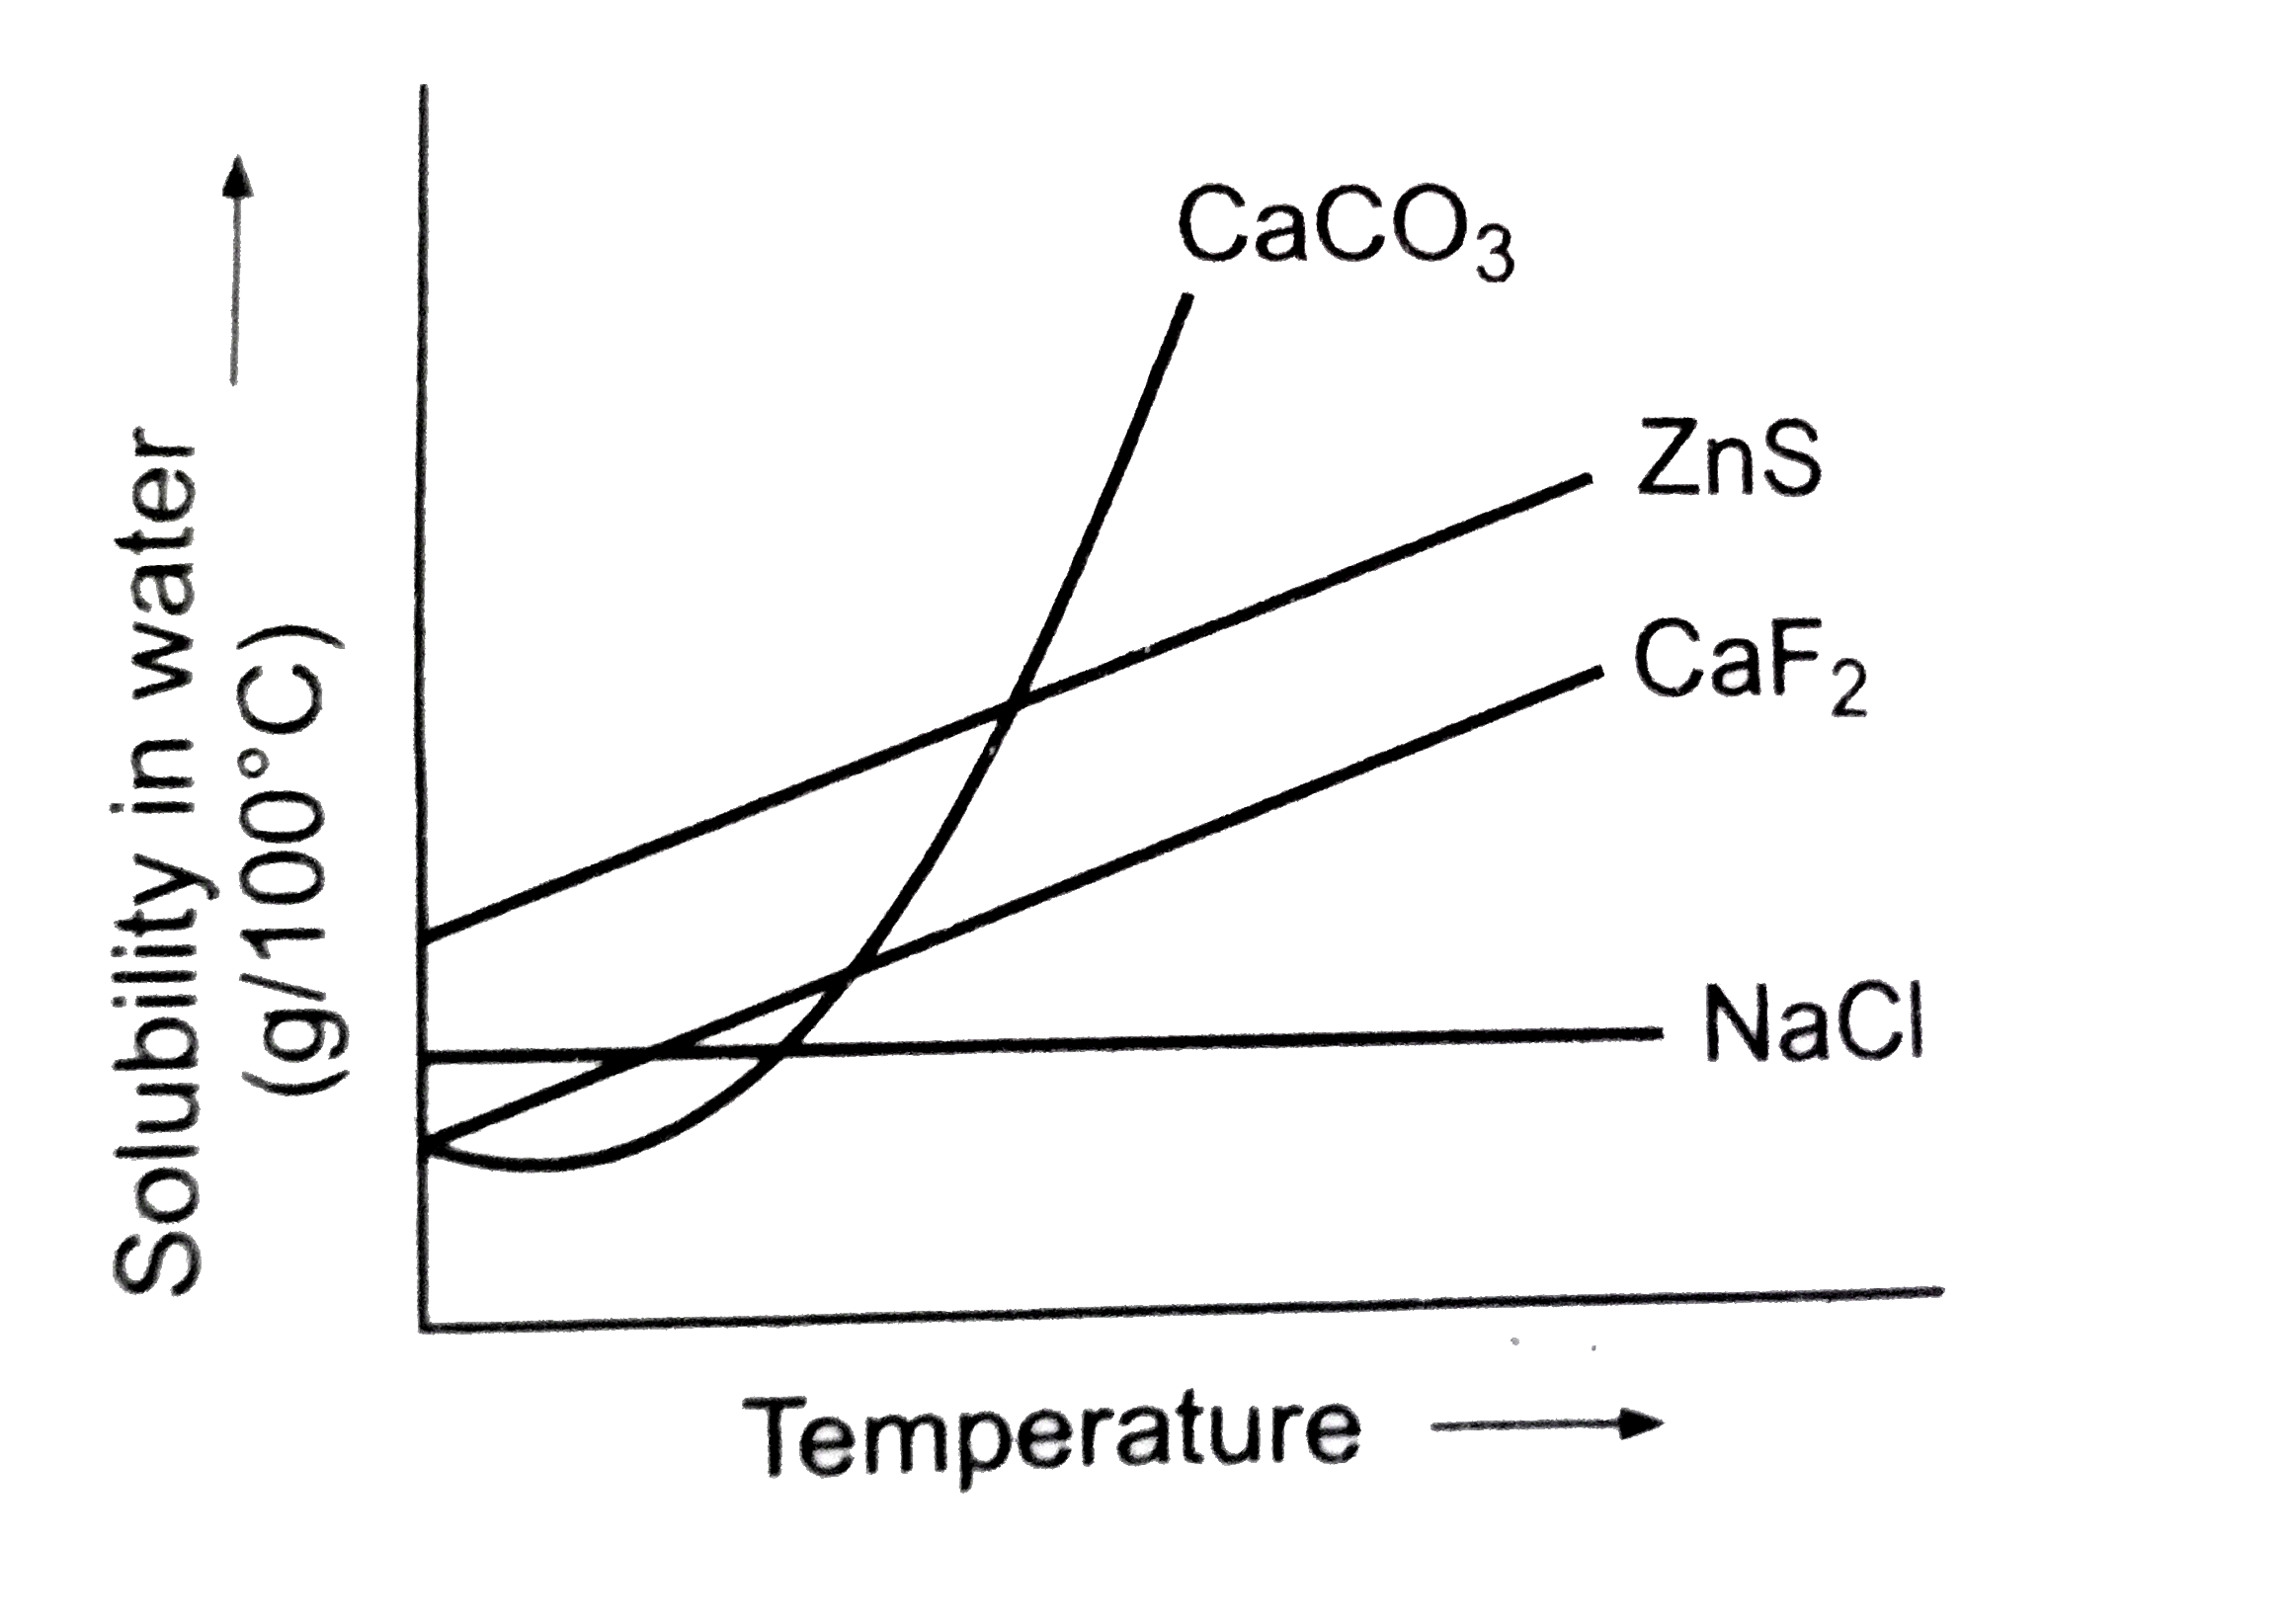
View SolutionFrom the given graph, predict the compound which would be most easily purified by recrystallisation from aqueous solution:
View SolutionWhich of the following curves represents the Henry's law ?
View Solution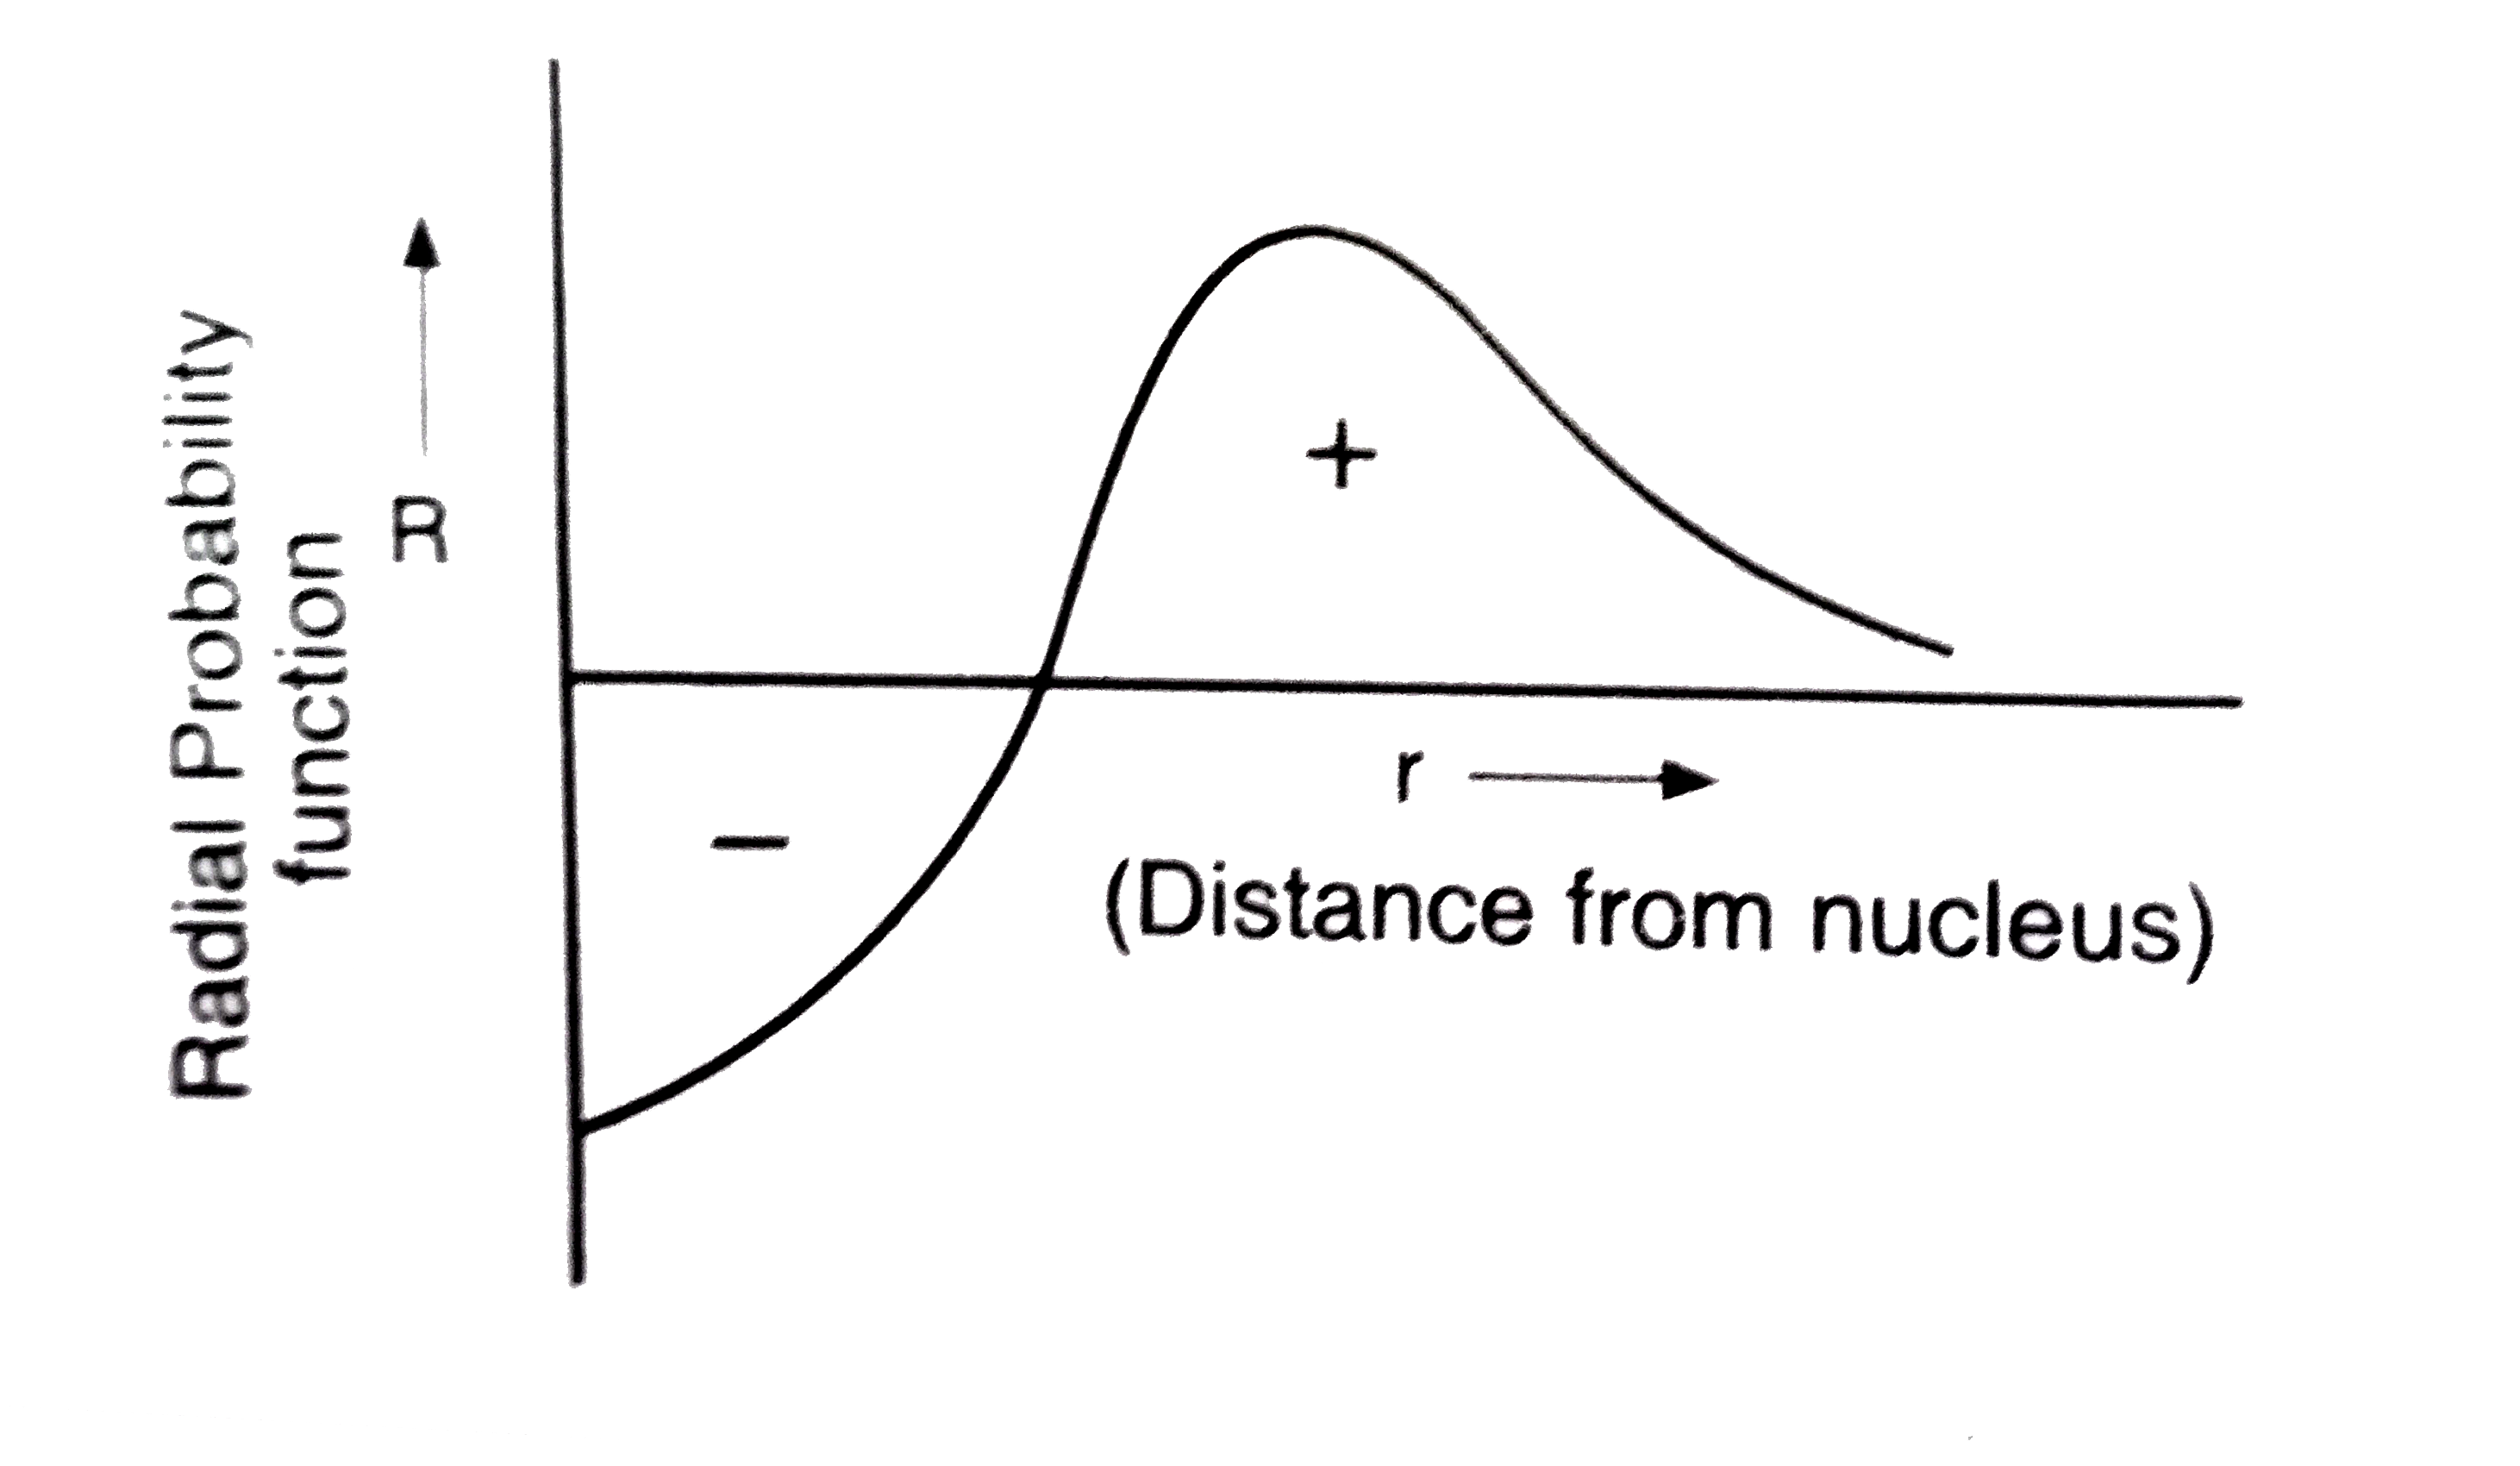
Number of nodes in above plot is :
View SolutionWhich of the following is not correct for the velocity of electron?
View SolutionA small amount of solution containing a radioactive nucleide `A""^(x)` was administrated into the blood of a patient. The activity of the nucliede id `2xx10""^(3)`dps. Its half life is 15 hours. After 5 hours a sample of the blood drawn out from the patient. It,s activity was 16 dpm per mL.
In the following graph, binding energy per nucleon is plotted against mass number (a). three elements `A_(1),A_(2)and A_(3)` are located in the graph. Select the false statement about the graph.
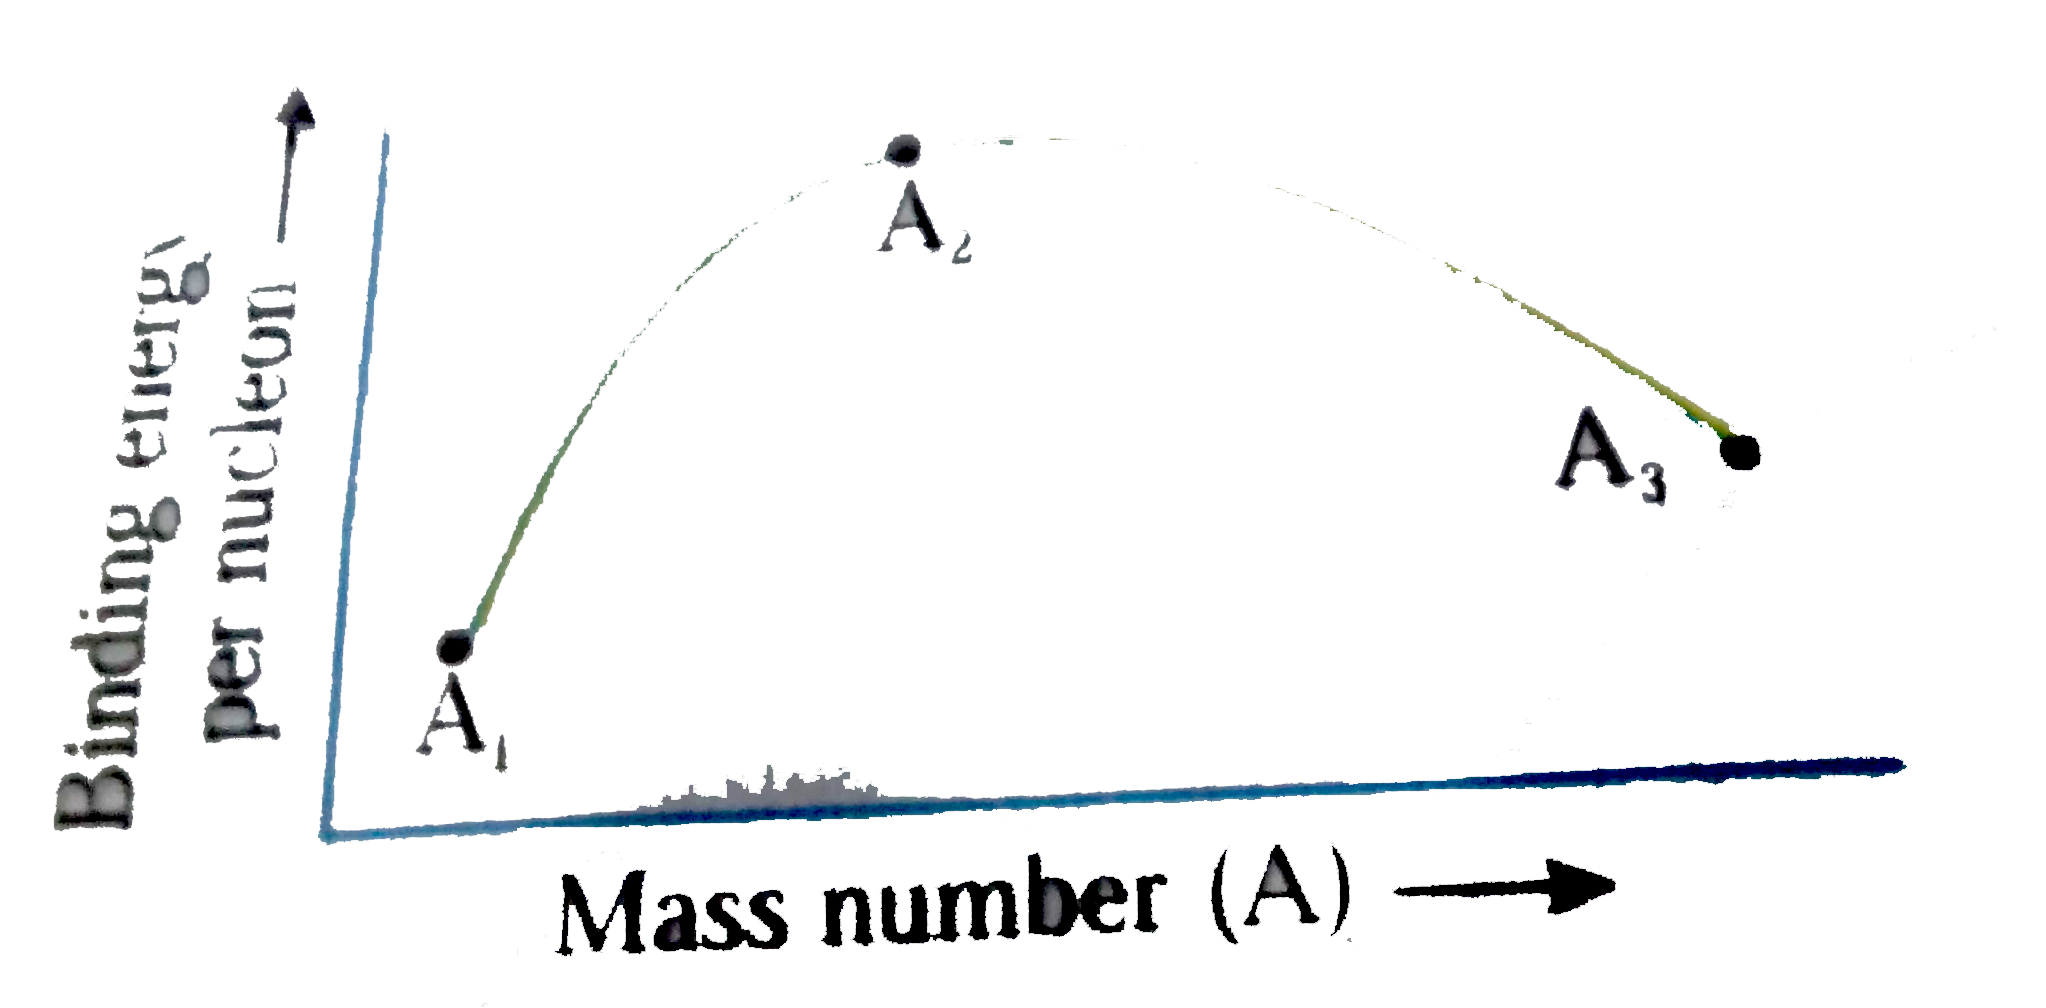 a)elment `A""_(2)` is more stable
b)element `A""_(3)` is less stable than `A""_(2)`
c)element `A""_(1)` is more stable than both `A""_(2)` and `A""_(3)`
d)`A""_(2)` is metallic element
View SolutionMolar solubility of helium, nitrogen and oxygen are plotted against partial pressure of the gas at constant temperature.
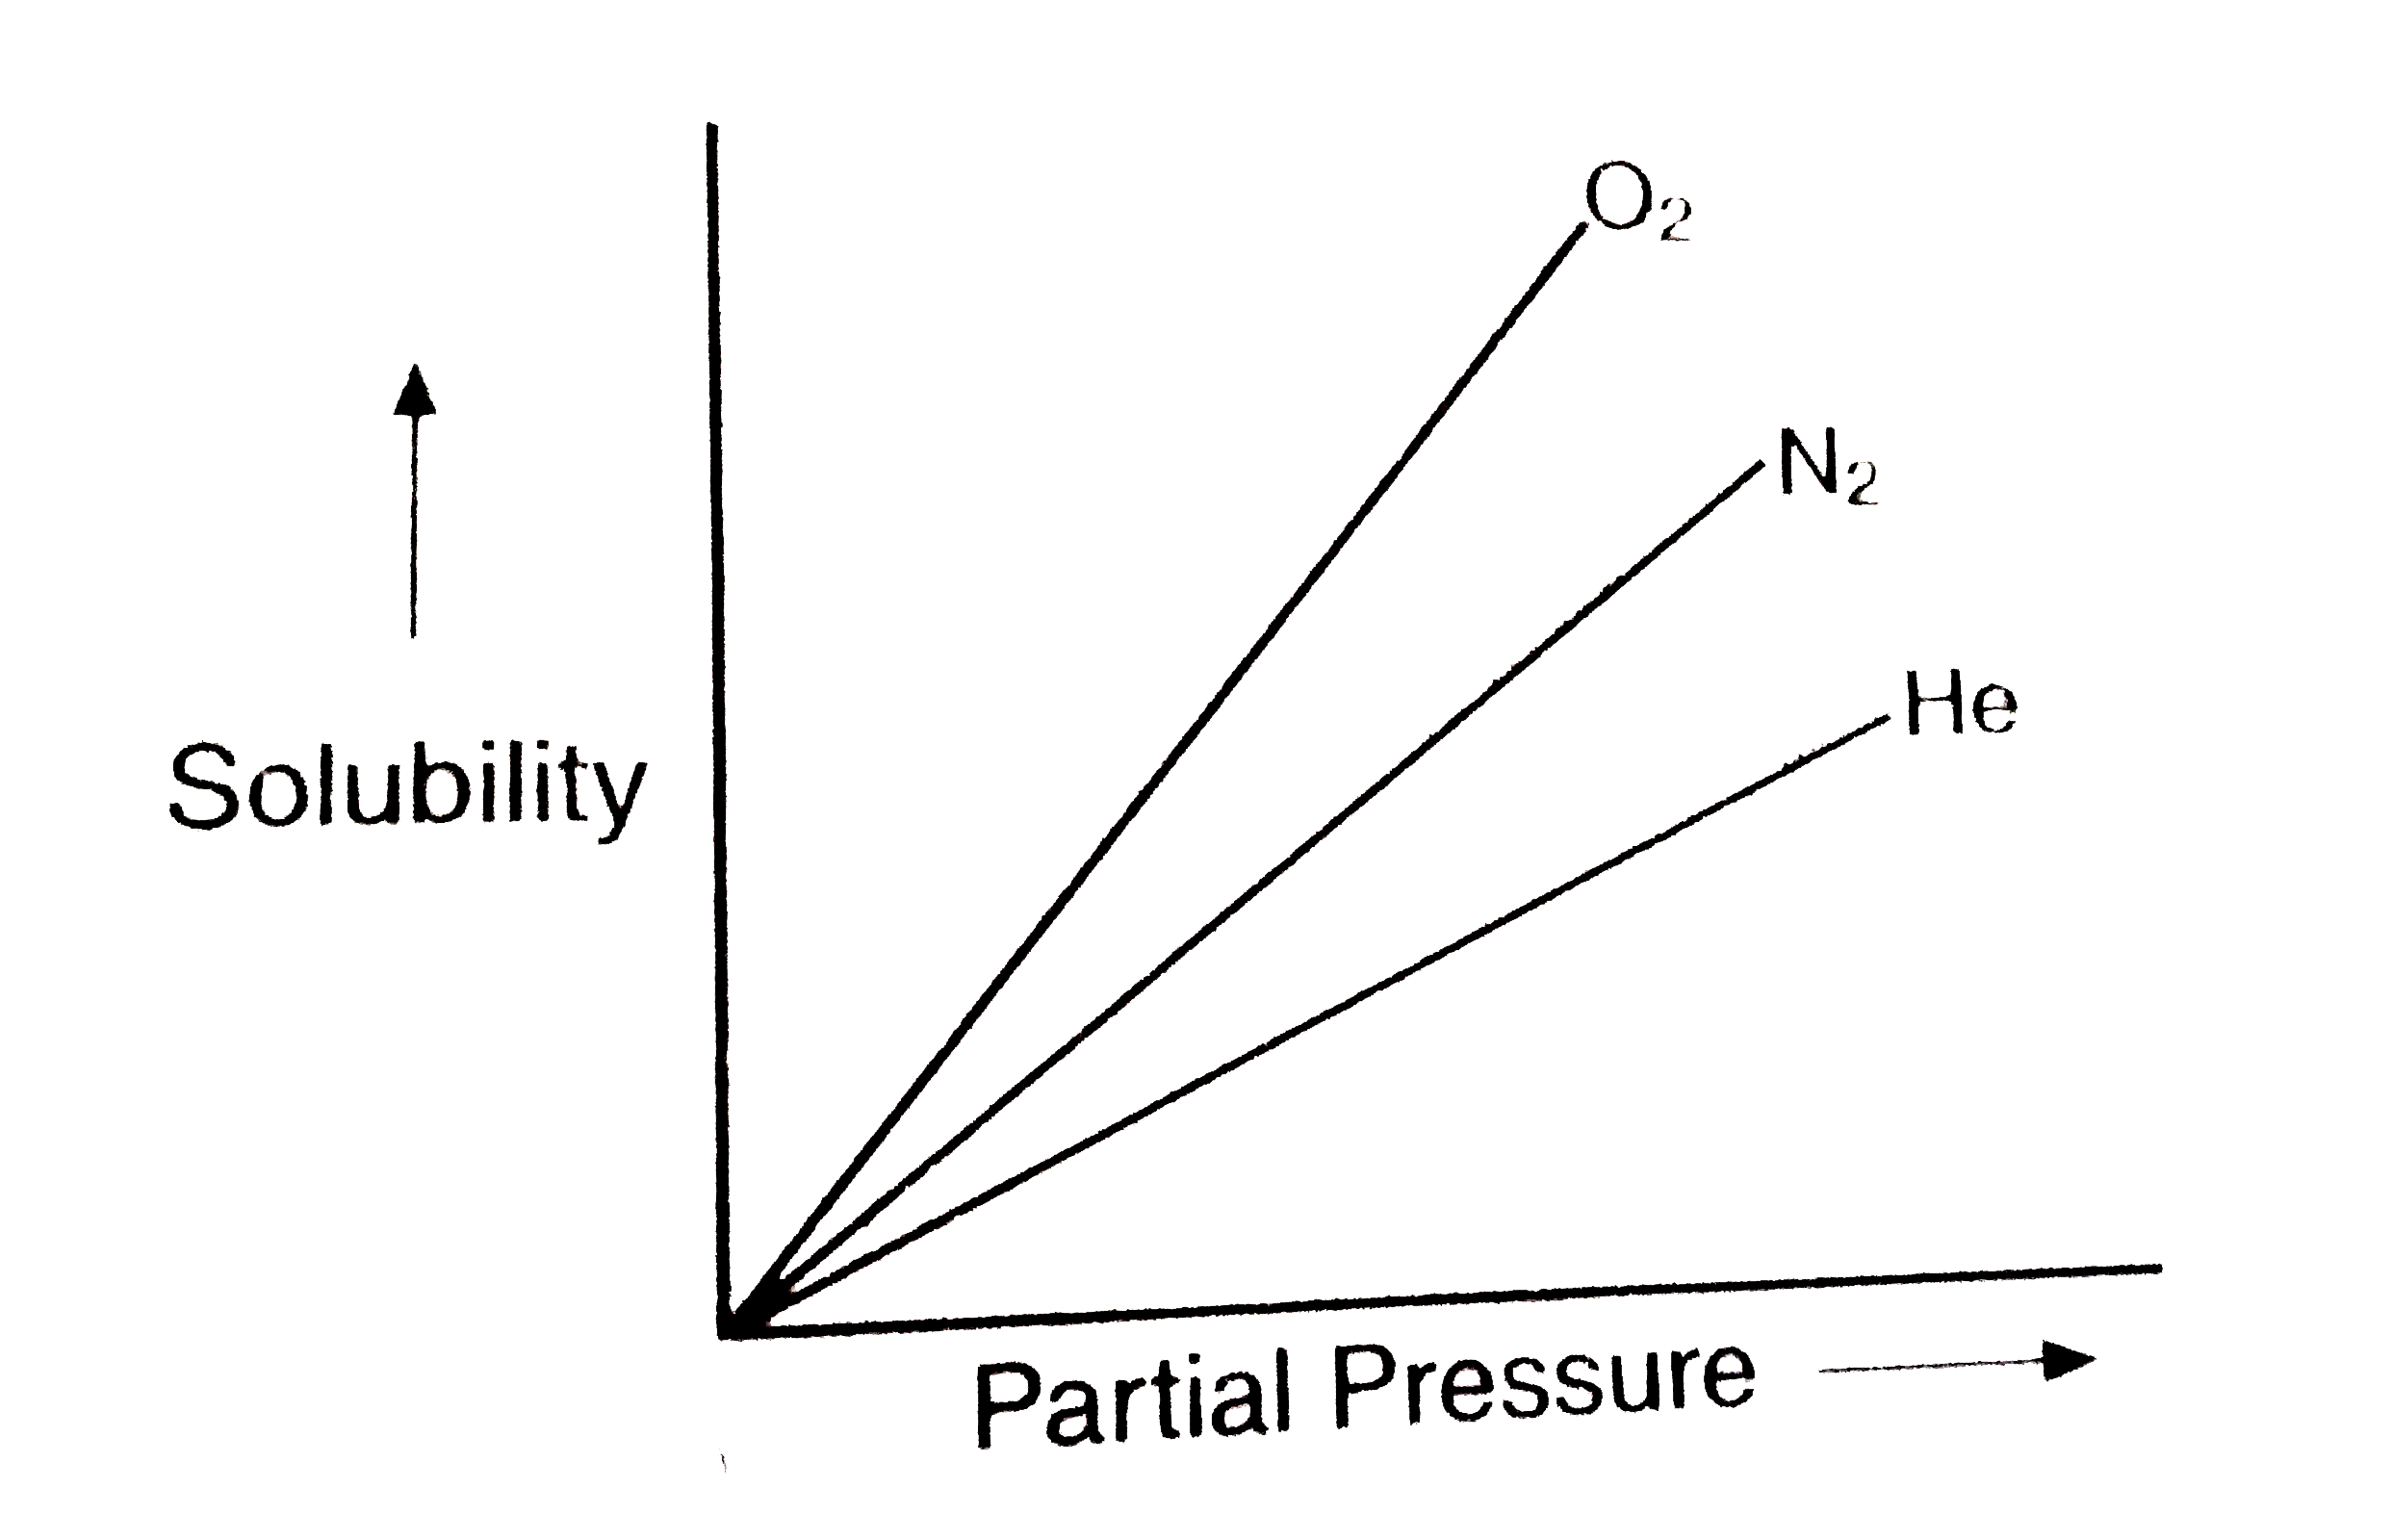
Henry's law constant for these gases will lie in following sequences?
View SolutionSolubility of oxygen gas in water follows Henry's law. When the solubility is plotted against partial pressure at a definite temperature we get following plot.
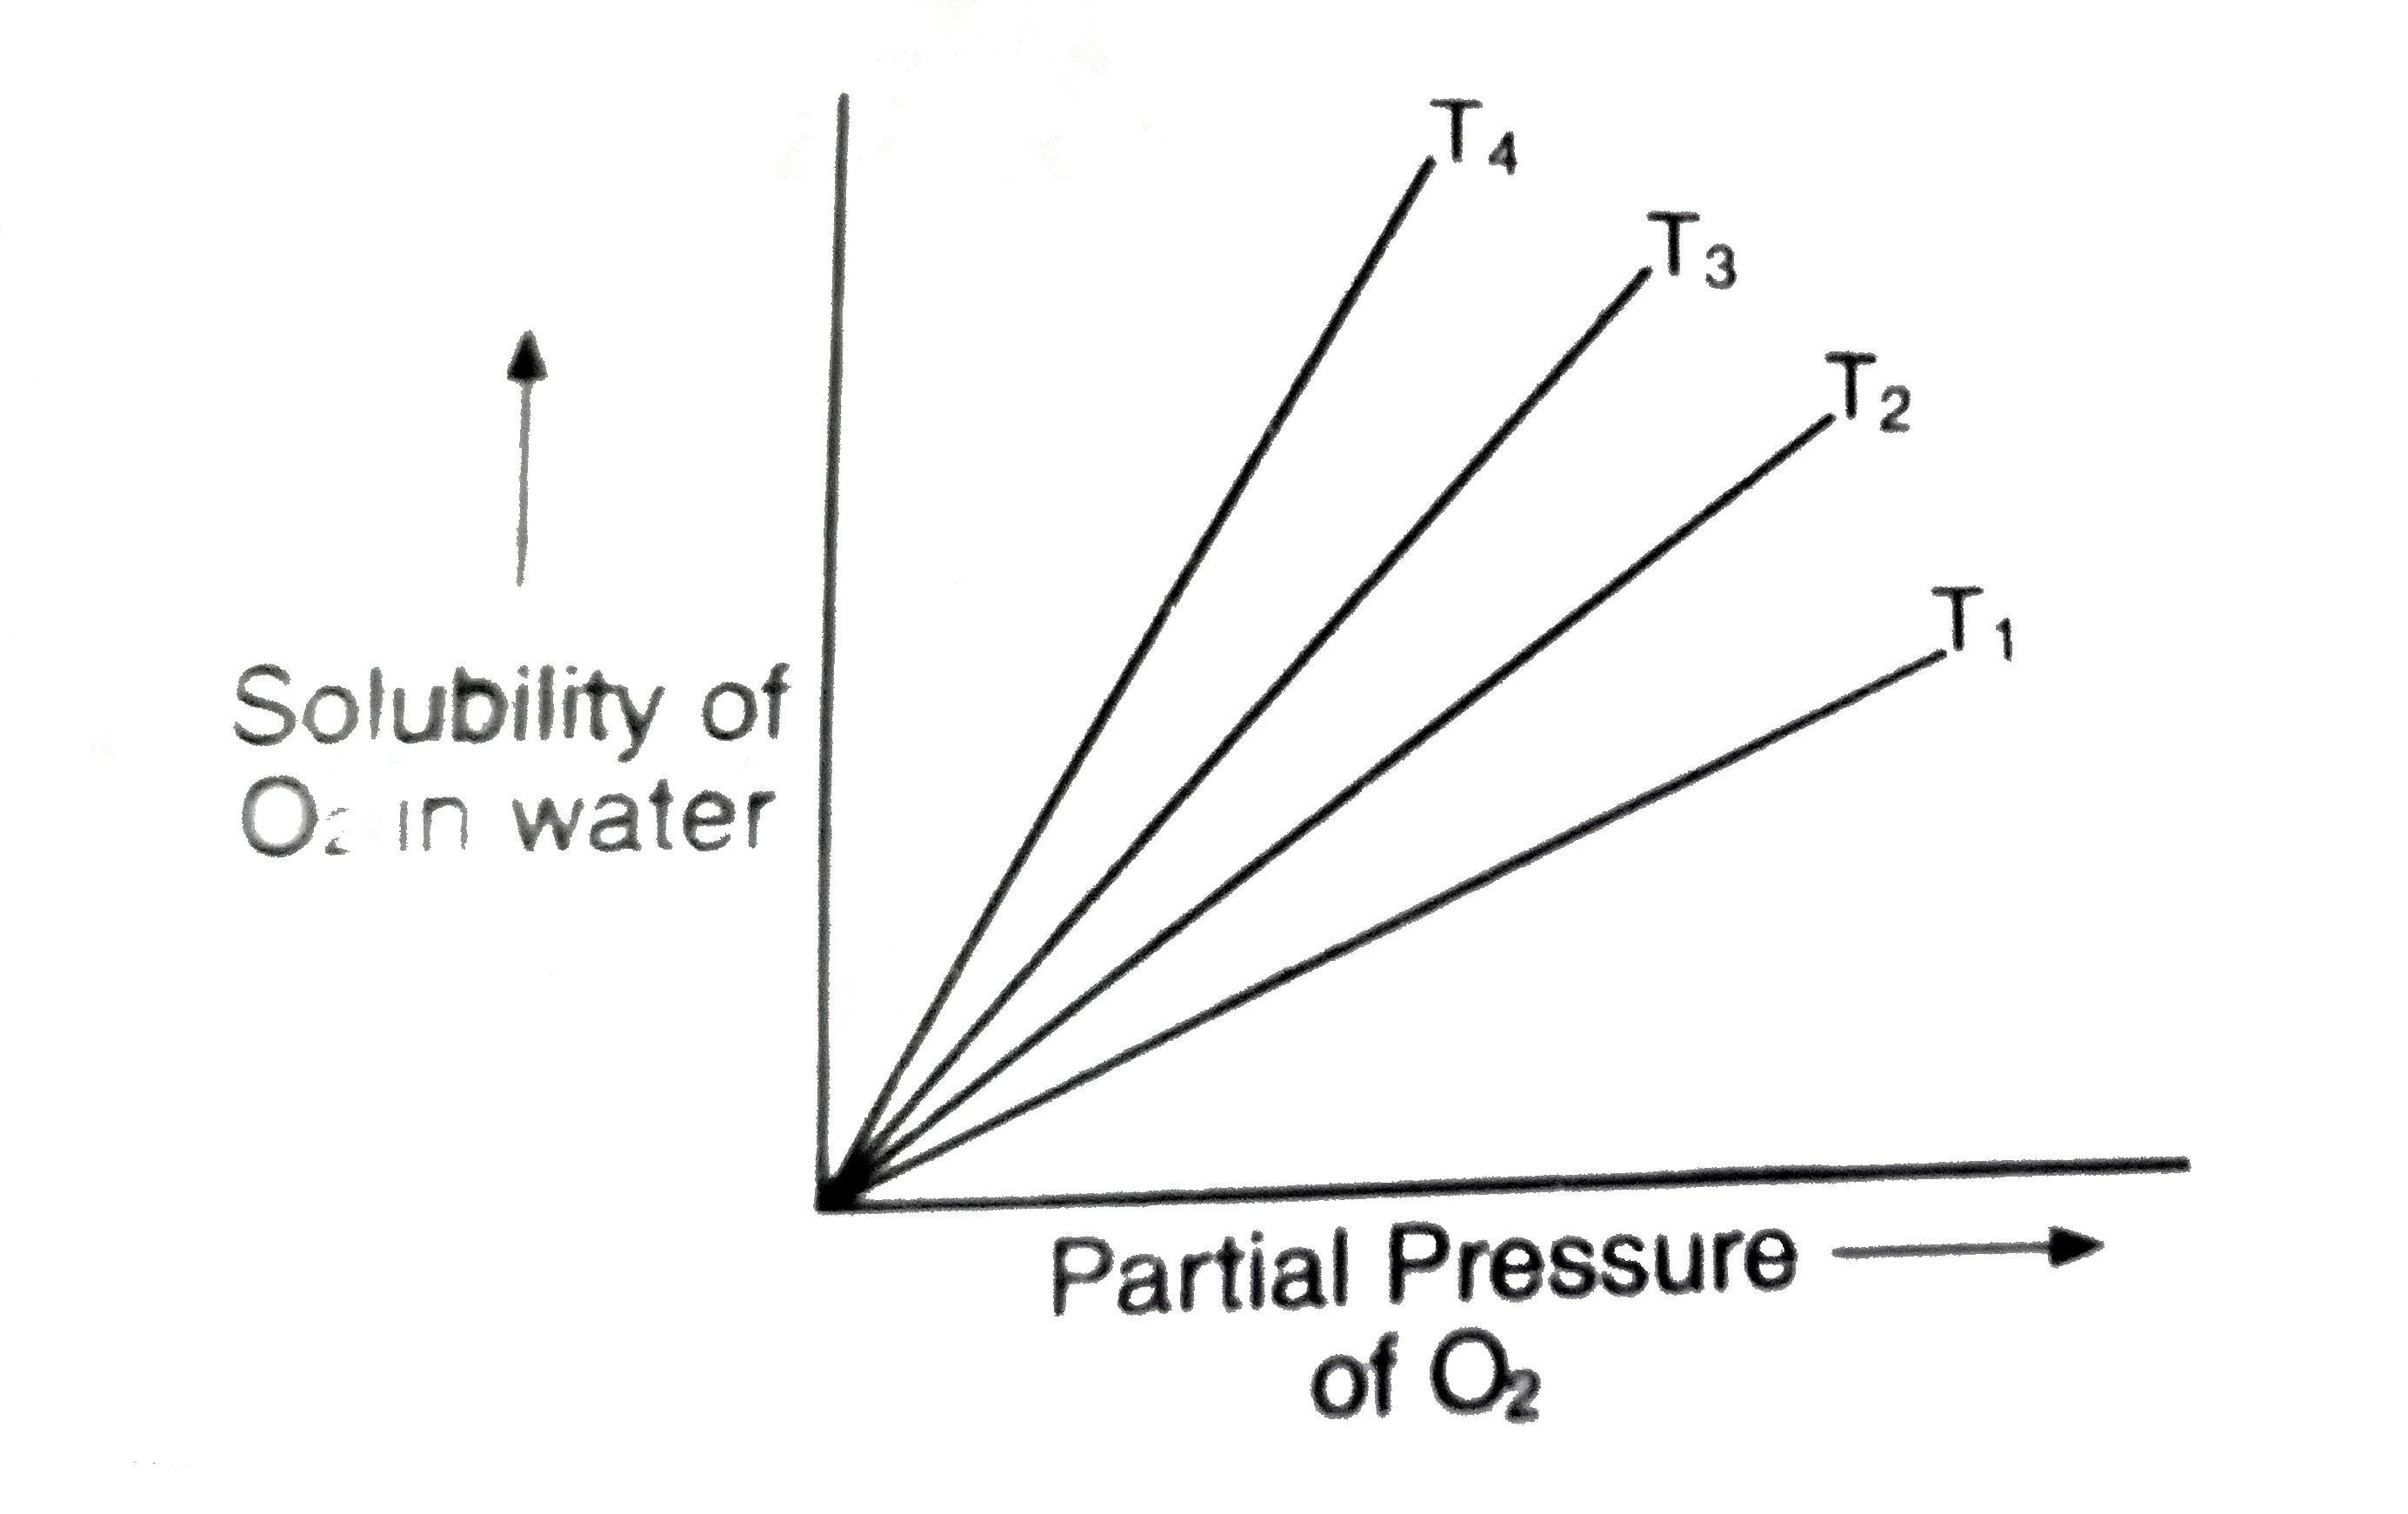
Which of the following sequences of temperatures is correct ?
View Solution
SET-VI: Problems on graphical aptitude questions and complete solutions for chapter MISCELLANEOUS (TOPICS OF GENERAL INTEREST) of G.R. BATHLA & SONS CHEMISTRY (HINGLISH) of Class 11