Which of the following figure represents the variation of particle momentum and the associated de - Broglie wavelength ?
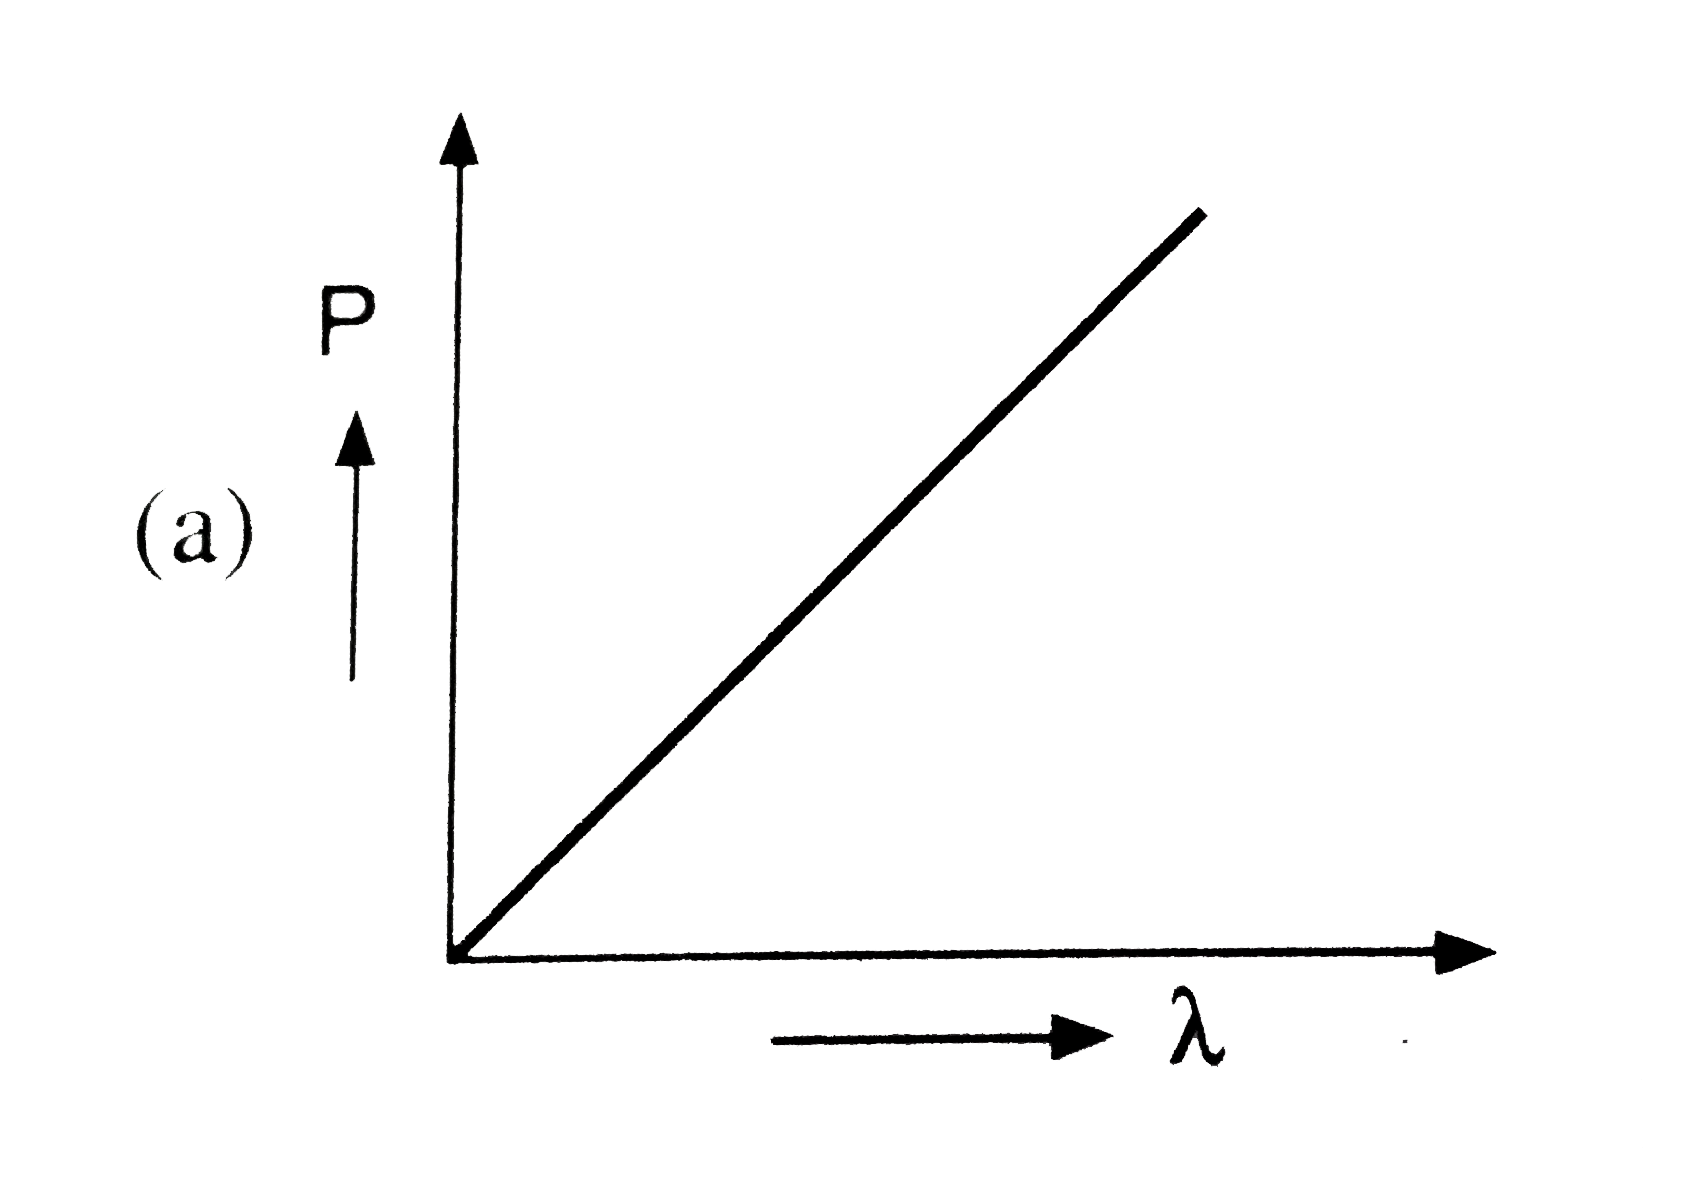
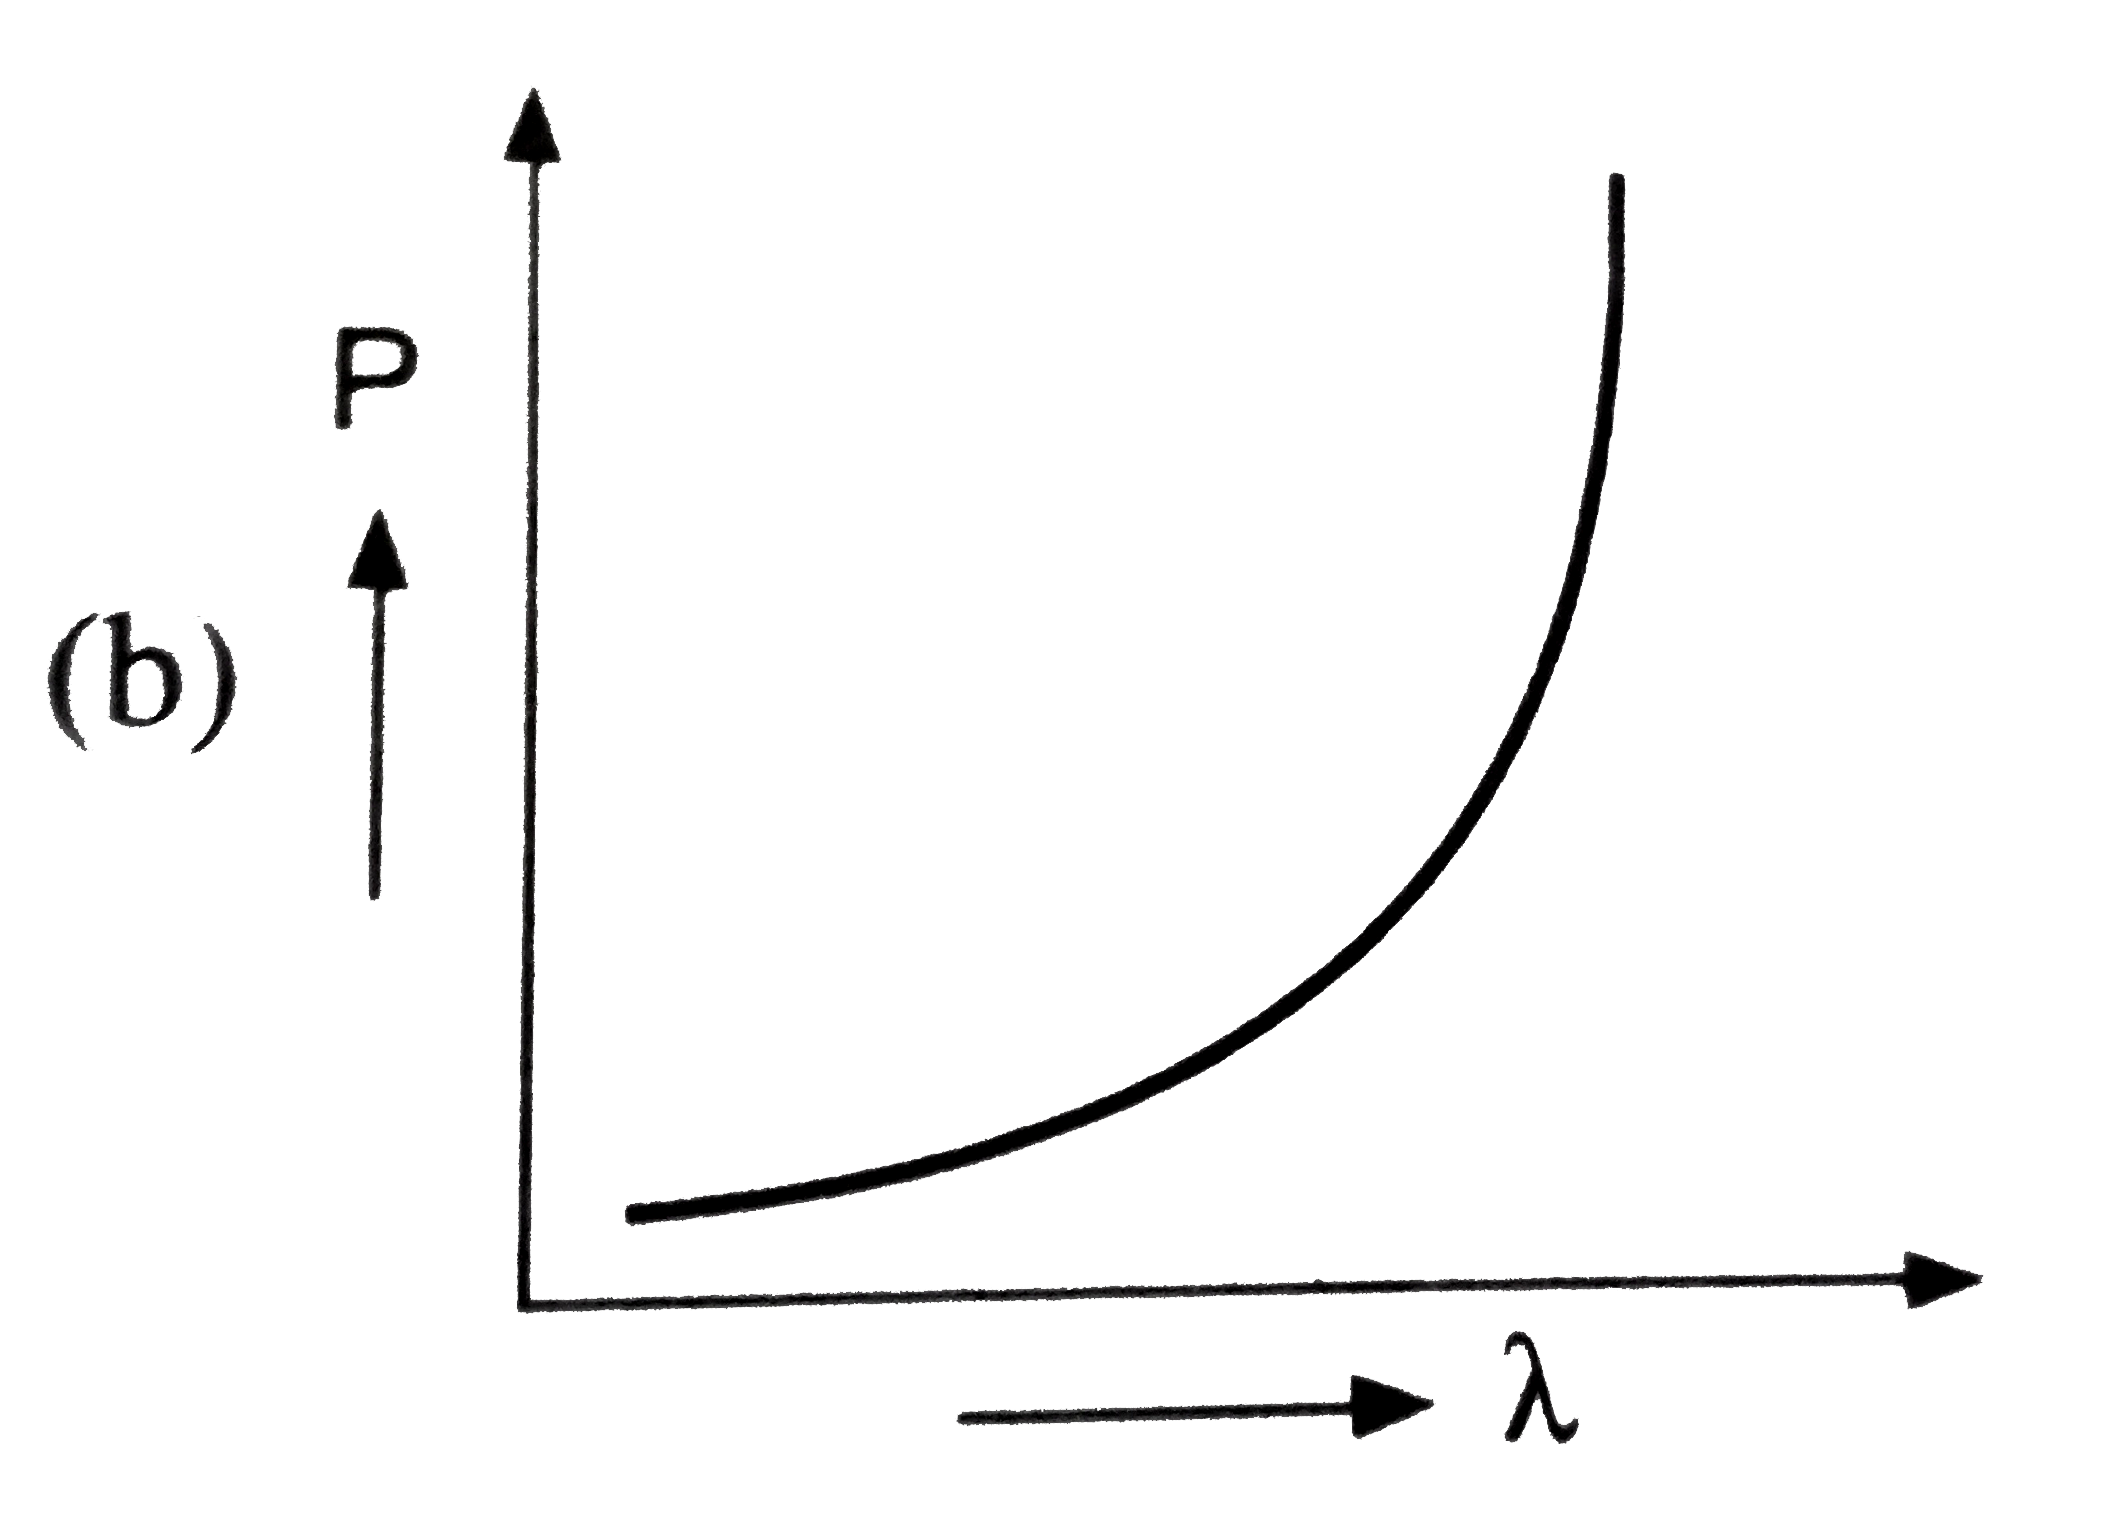
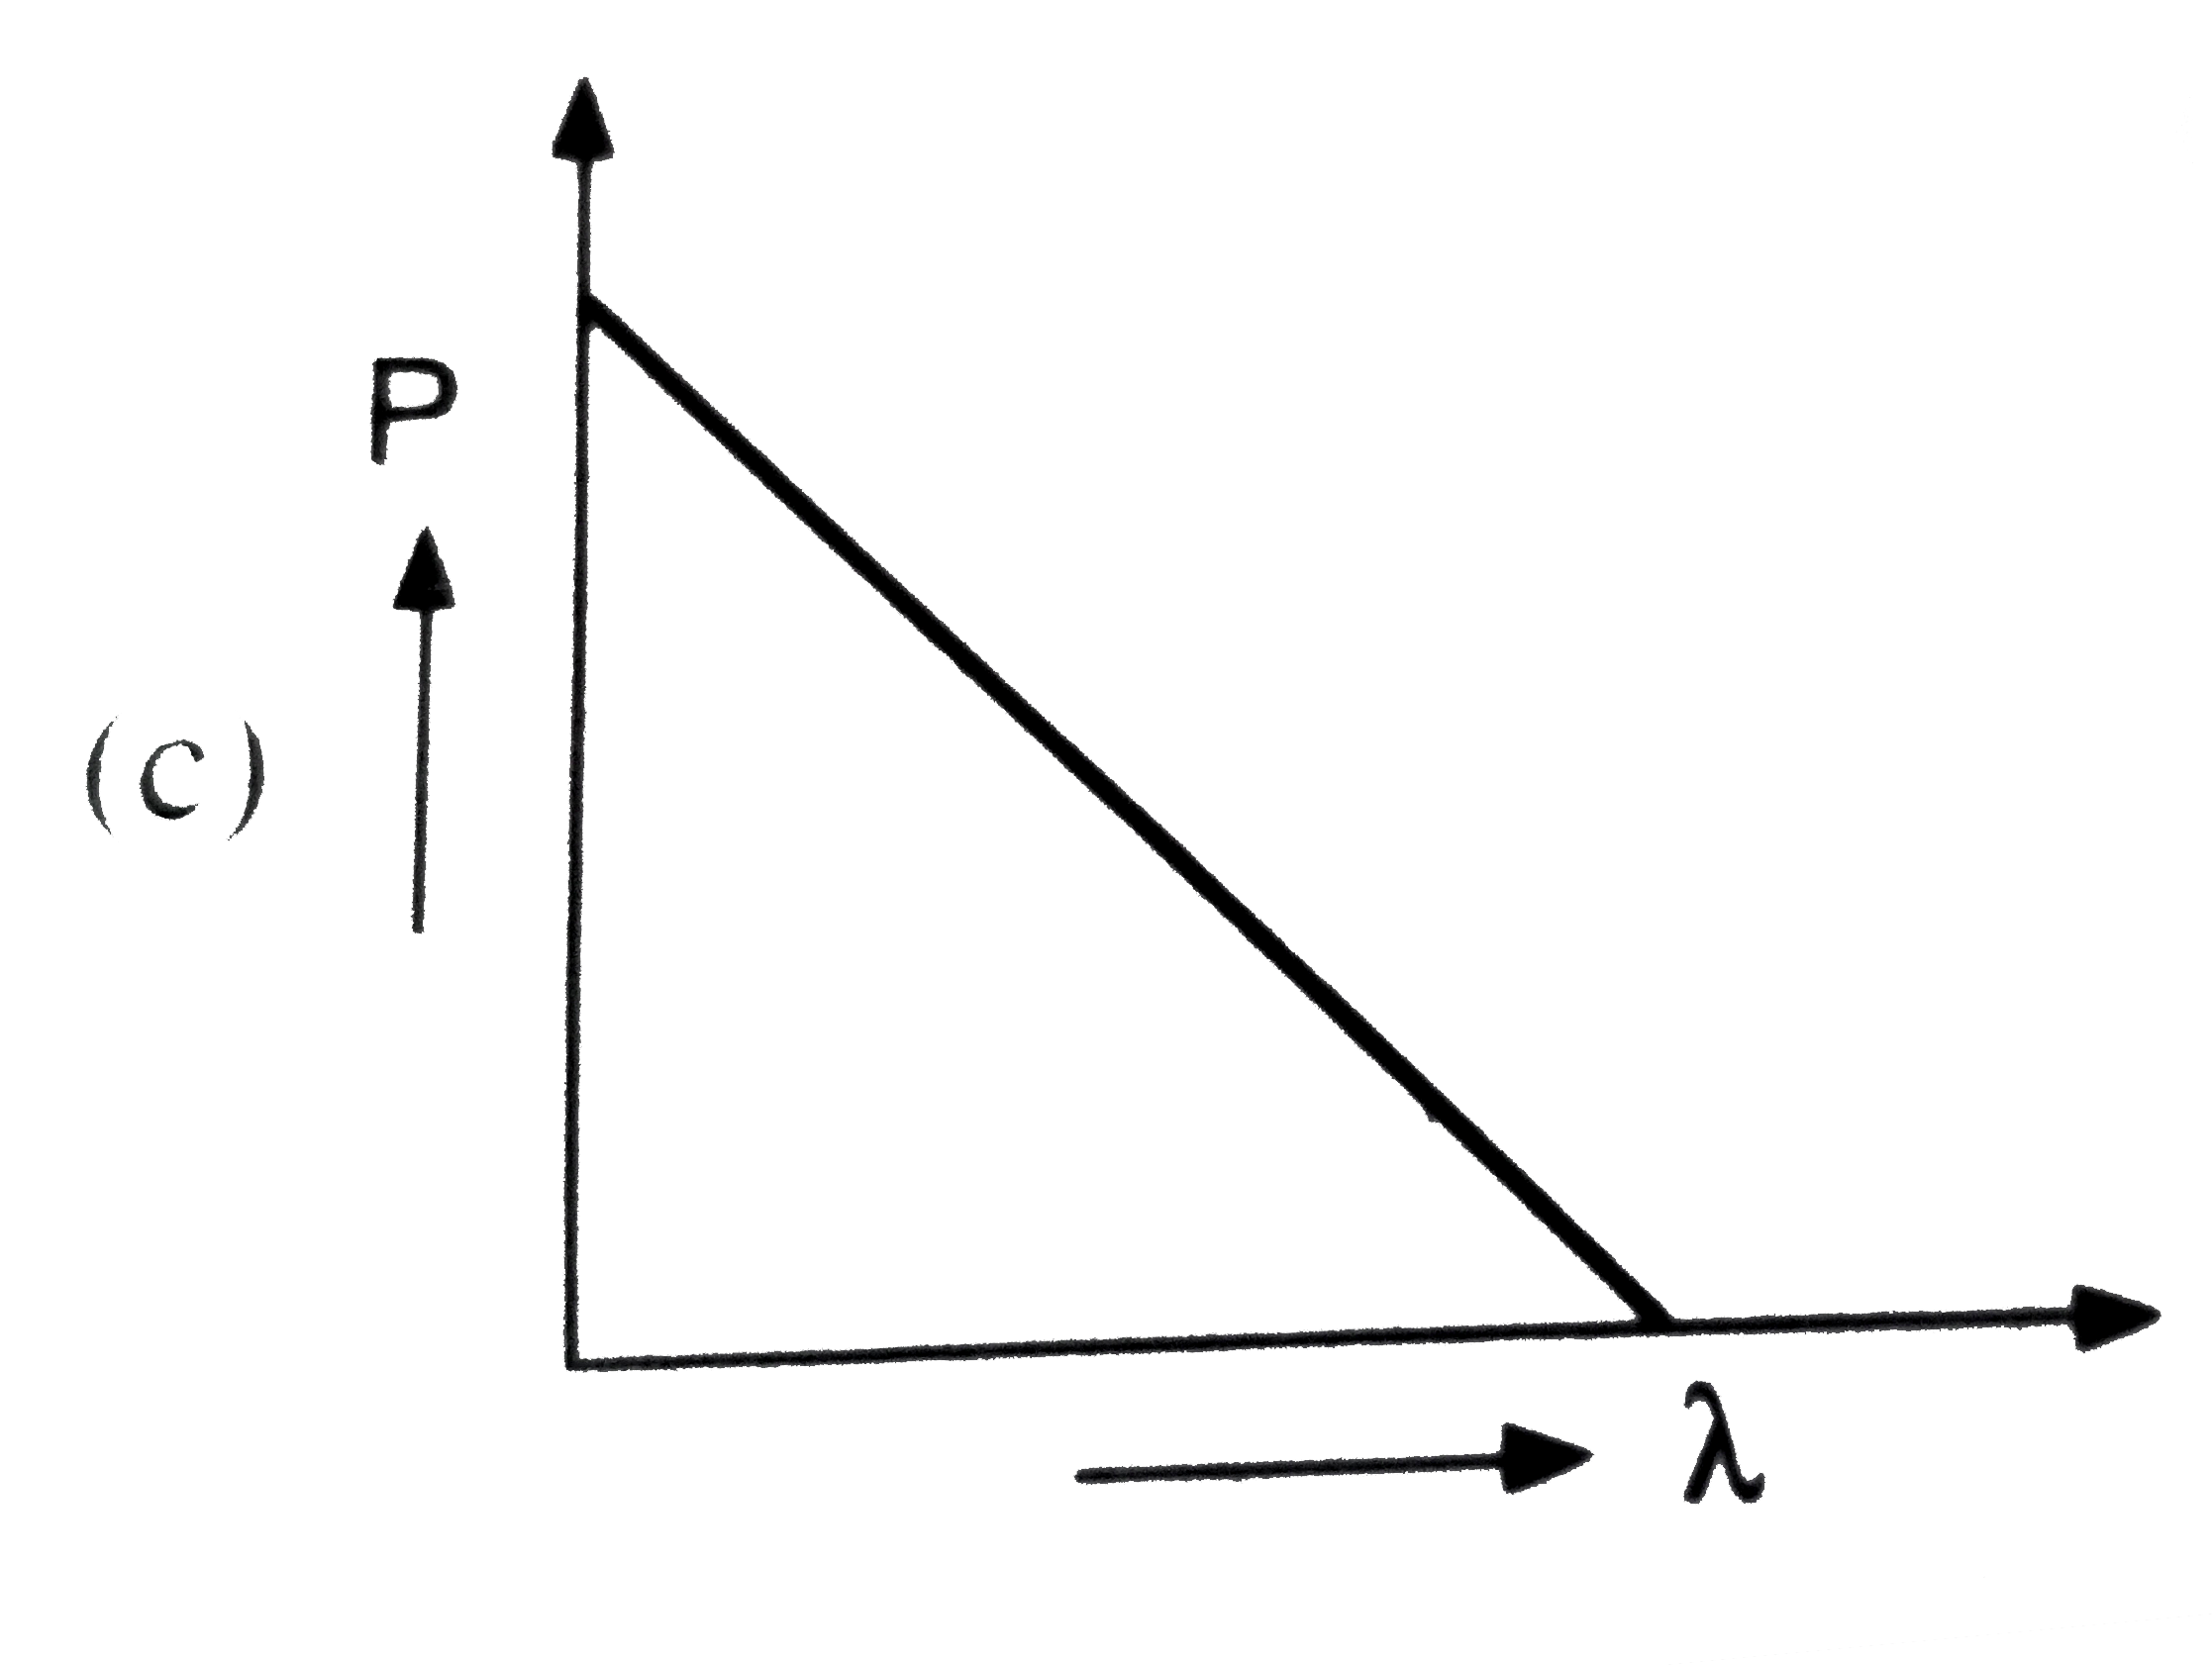
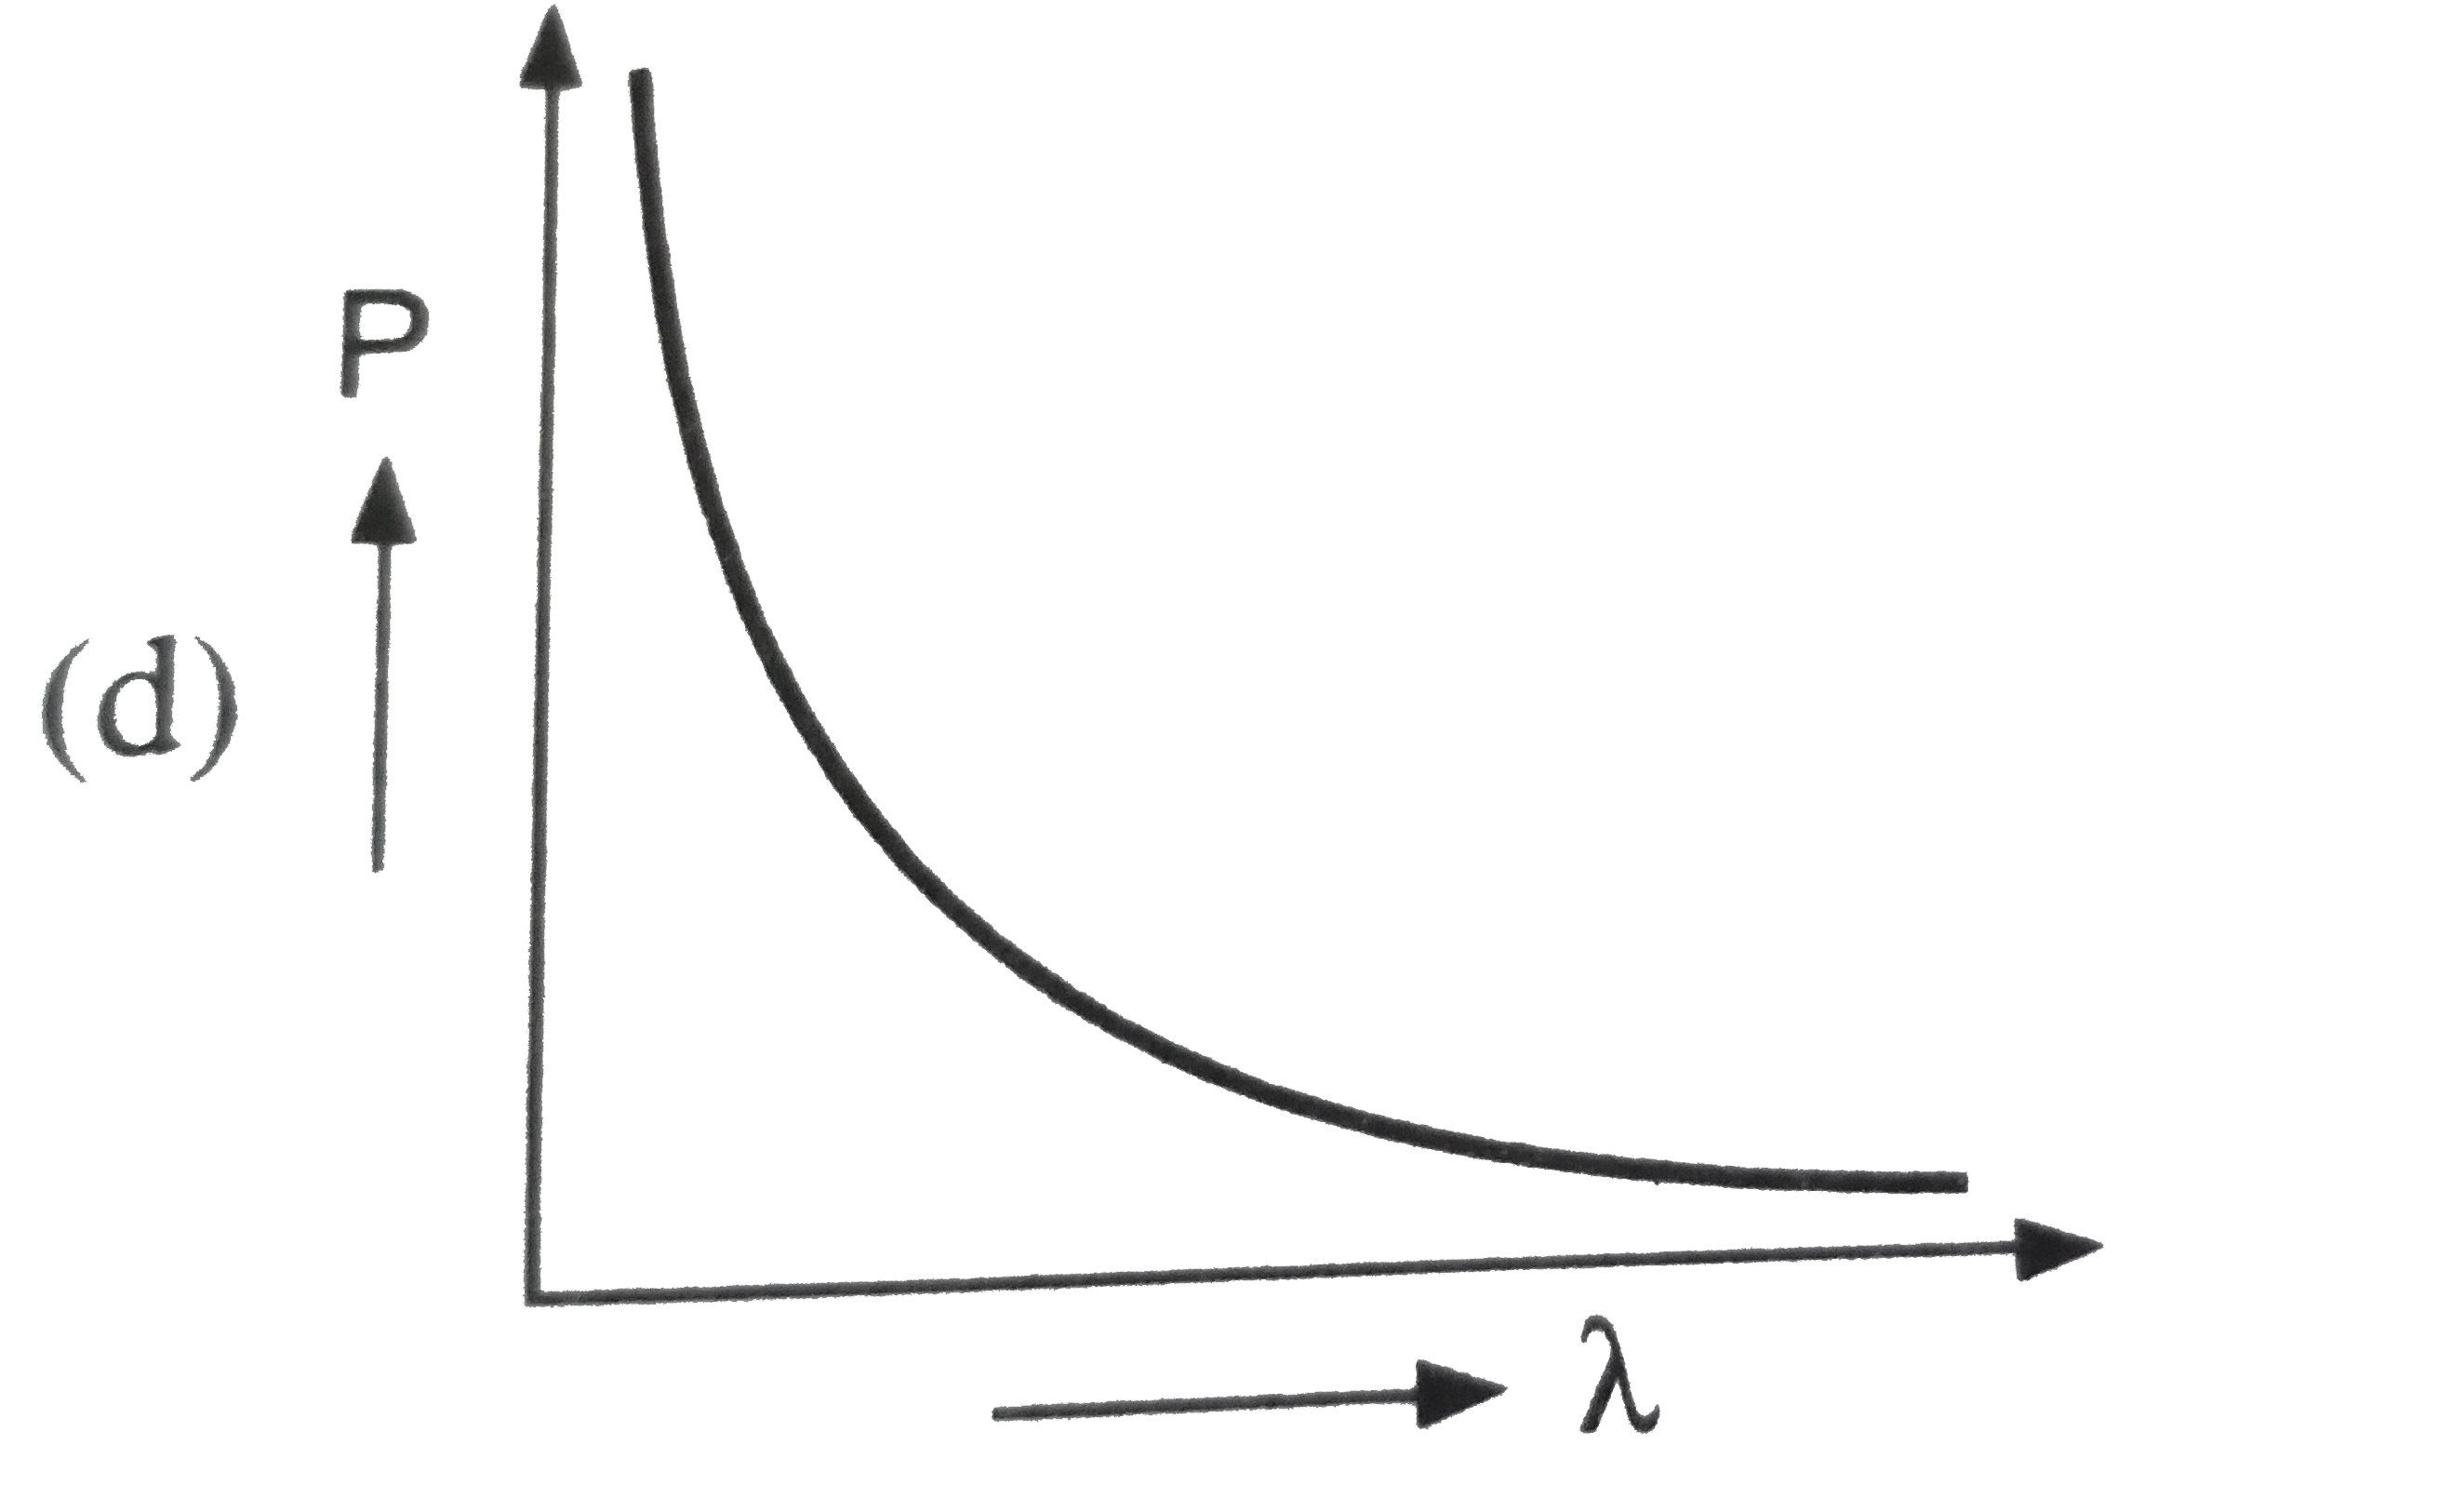
The correct Answer is:D
Step by step video, text & image solution for Which of the following figure represents the variation of particle momentum and the associated de - Broglie wavelength ? by Chemistry experts to help you in doubts & scoring excellent marks in Class 11 exams.
Topper's Solved these Questions
- BOOK - OP TANDONCHAPTER - MISCELLANEOUS (TOPICS OF GENERAL INTEREST)EXERCISE - SET-V: Matching type Questions37videos
MISCELLANEOUS (TOPICS OF GENERAL INTEREST)
- BOOK - OP TANDONCHAPTER - INTRODUCTION TO ORGANIC CHEMISTRY EXERCISE - SINGLE INTEGER ANSWER TYPE4videos
INTRODUCTION TO ORGANIC CHEMISTRY
- BOOK - OP TANDONCHAPTER - OXIDATION AND REDUCTION (REDOX REACTIONS)EXERCISE - SECTION V3videos
OXIDATION AND REDUCTION (REDOX REACTIONS)
Similar Questions
Knowledge Check
- Question 1 - Select One
Which of the following figure represents the variation of particle momentum and the associated de - Broglie wavelength ?
A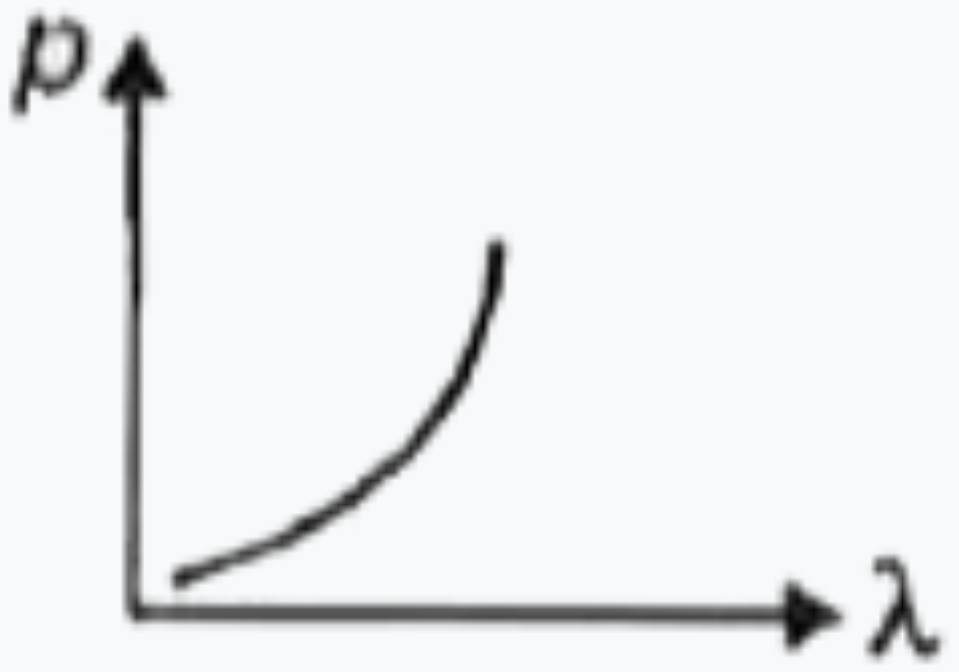 B
B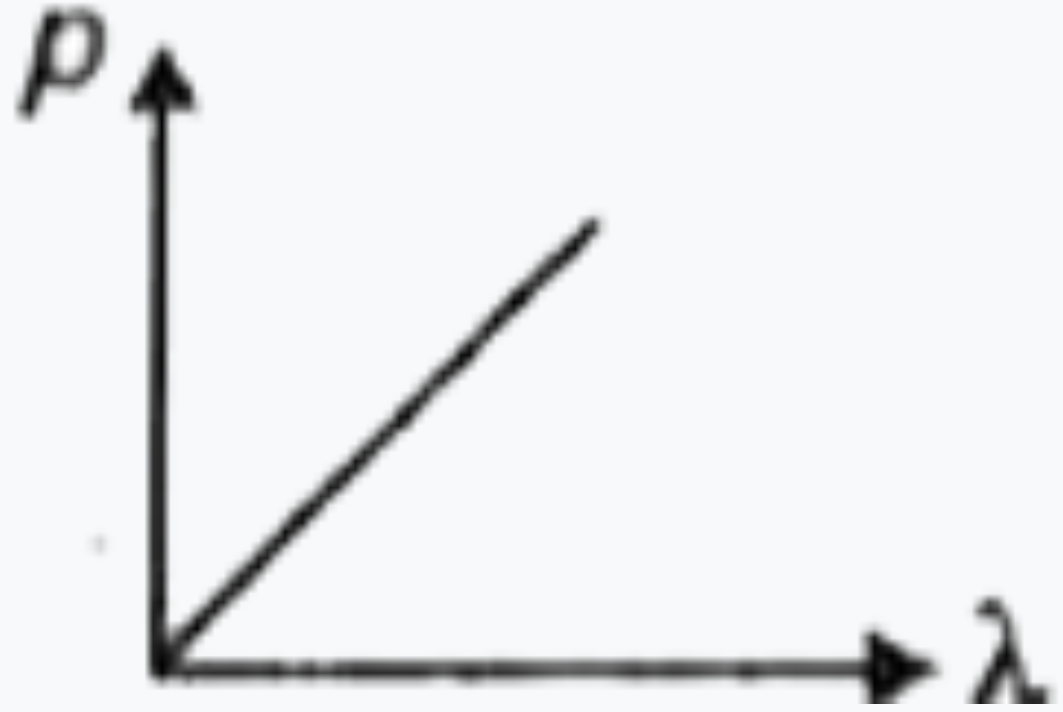 C
C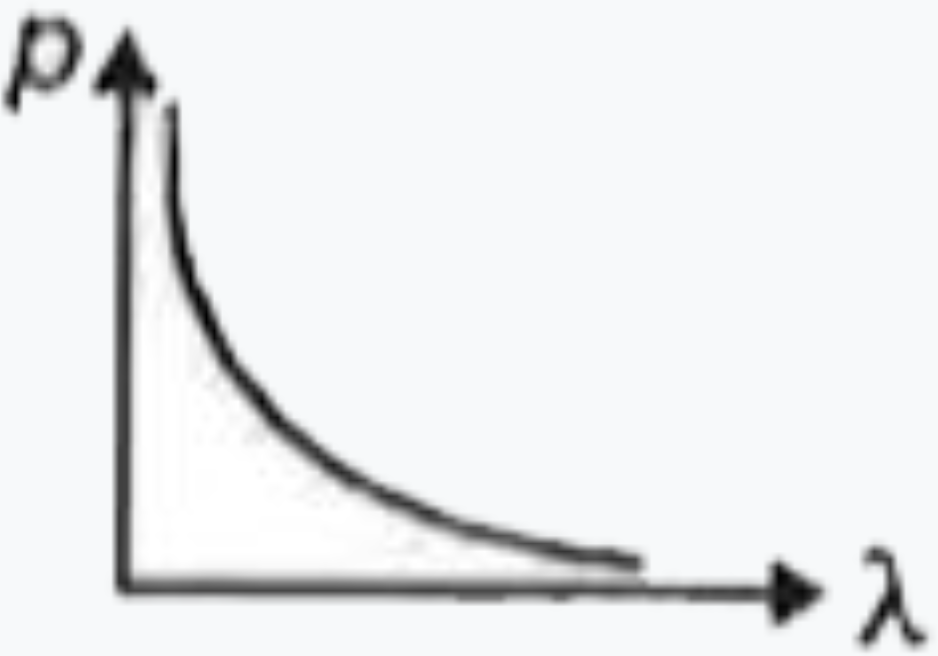 D
D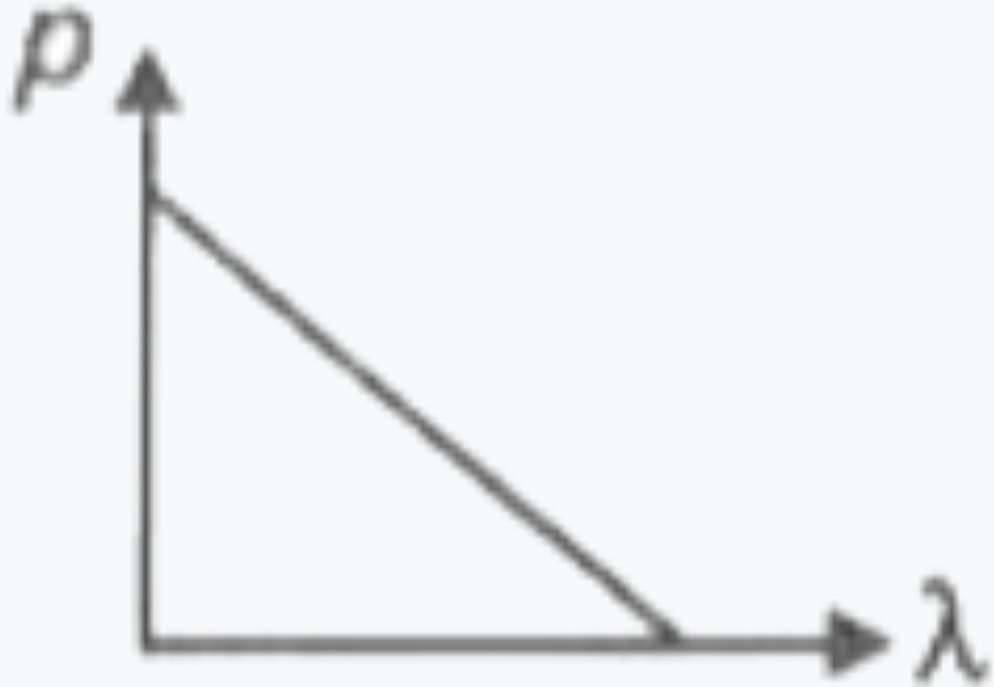
- Question 2 - Select One
Which of the following graph represent the variation of particle momentum and associated de Broglie wavelength?
A B
B C
C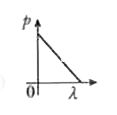 D
D
- Question 3 - Select One
Which of the following graphs correctly represents the variation of particle momentum with associated de Broglie wavelength?
A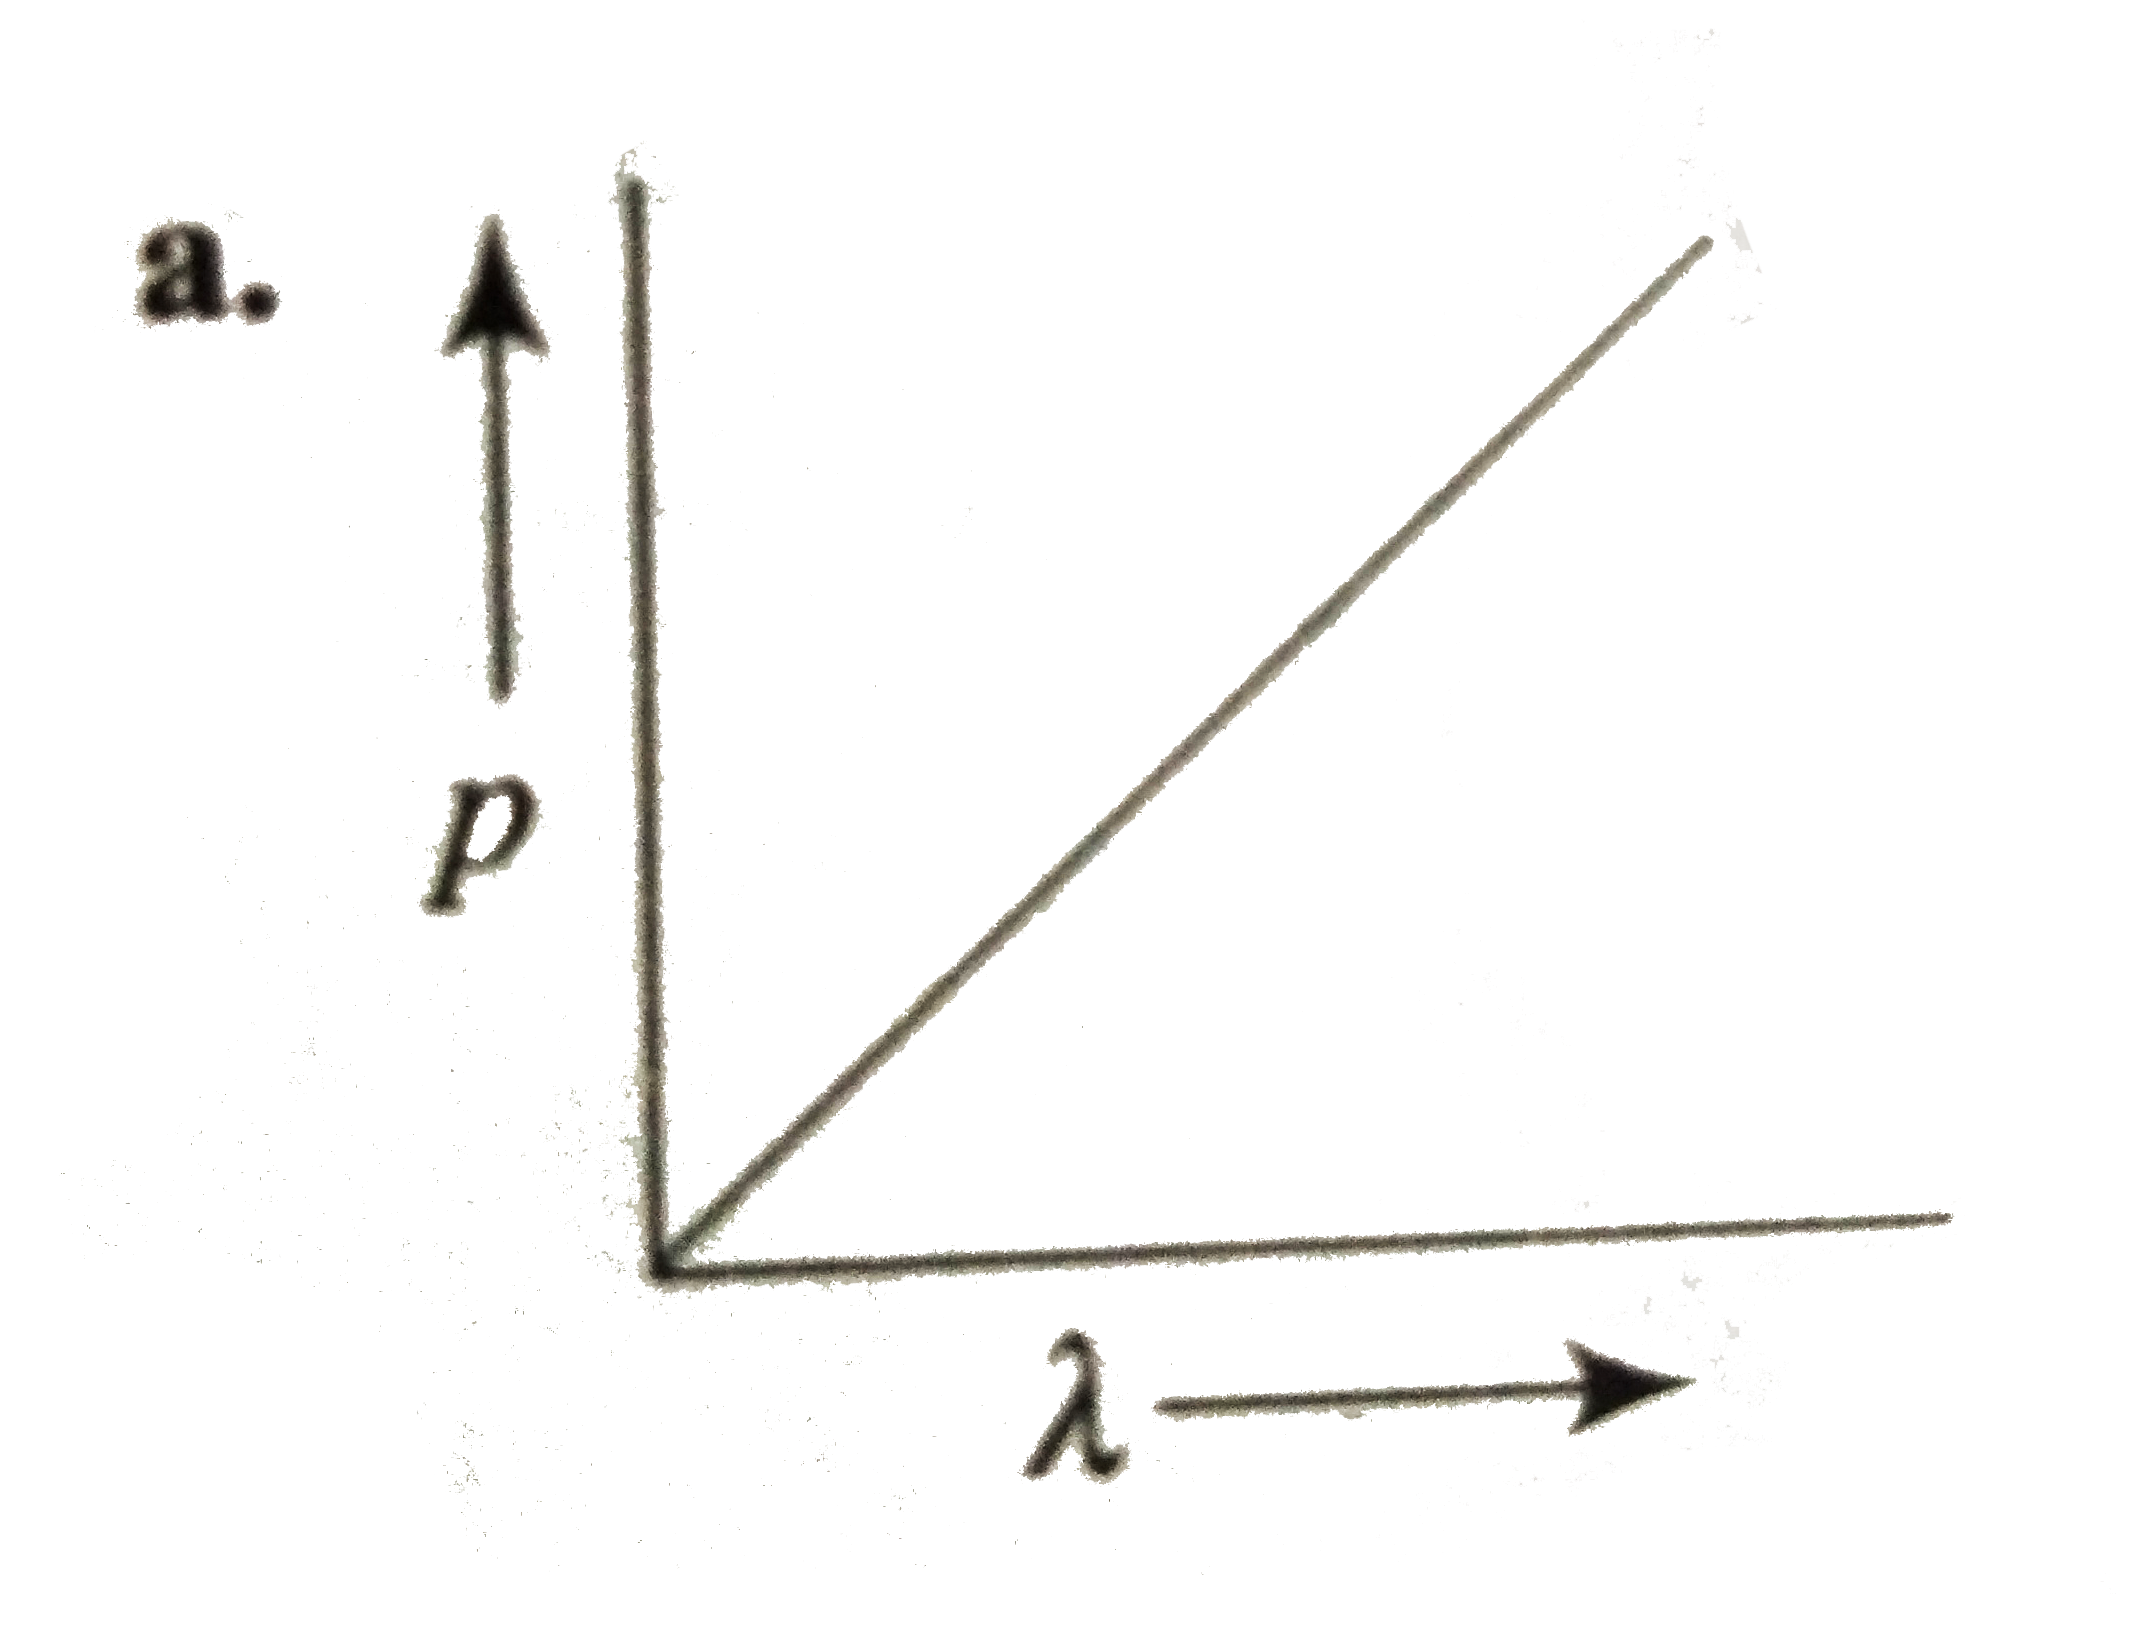 B
B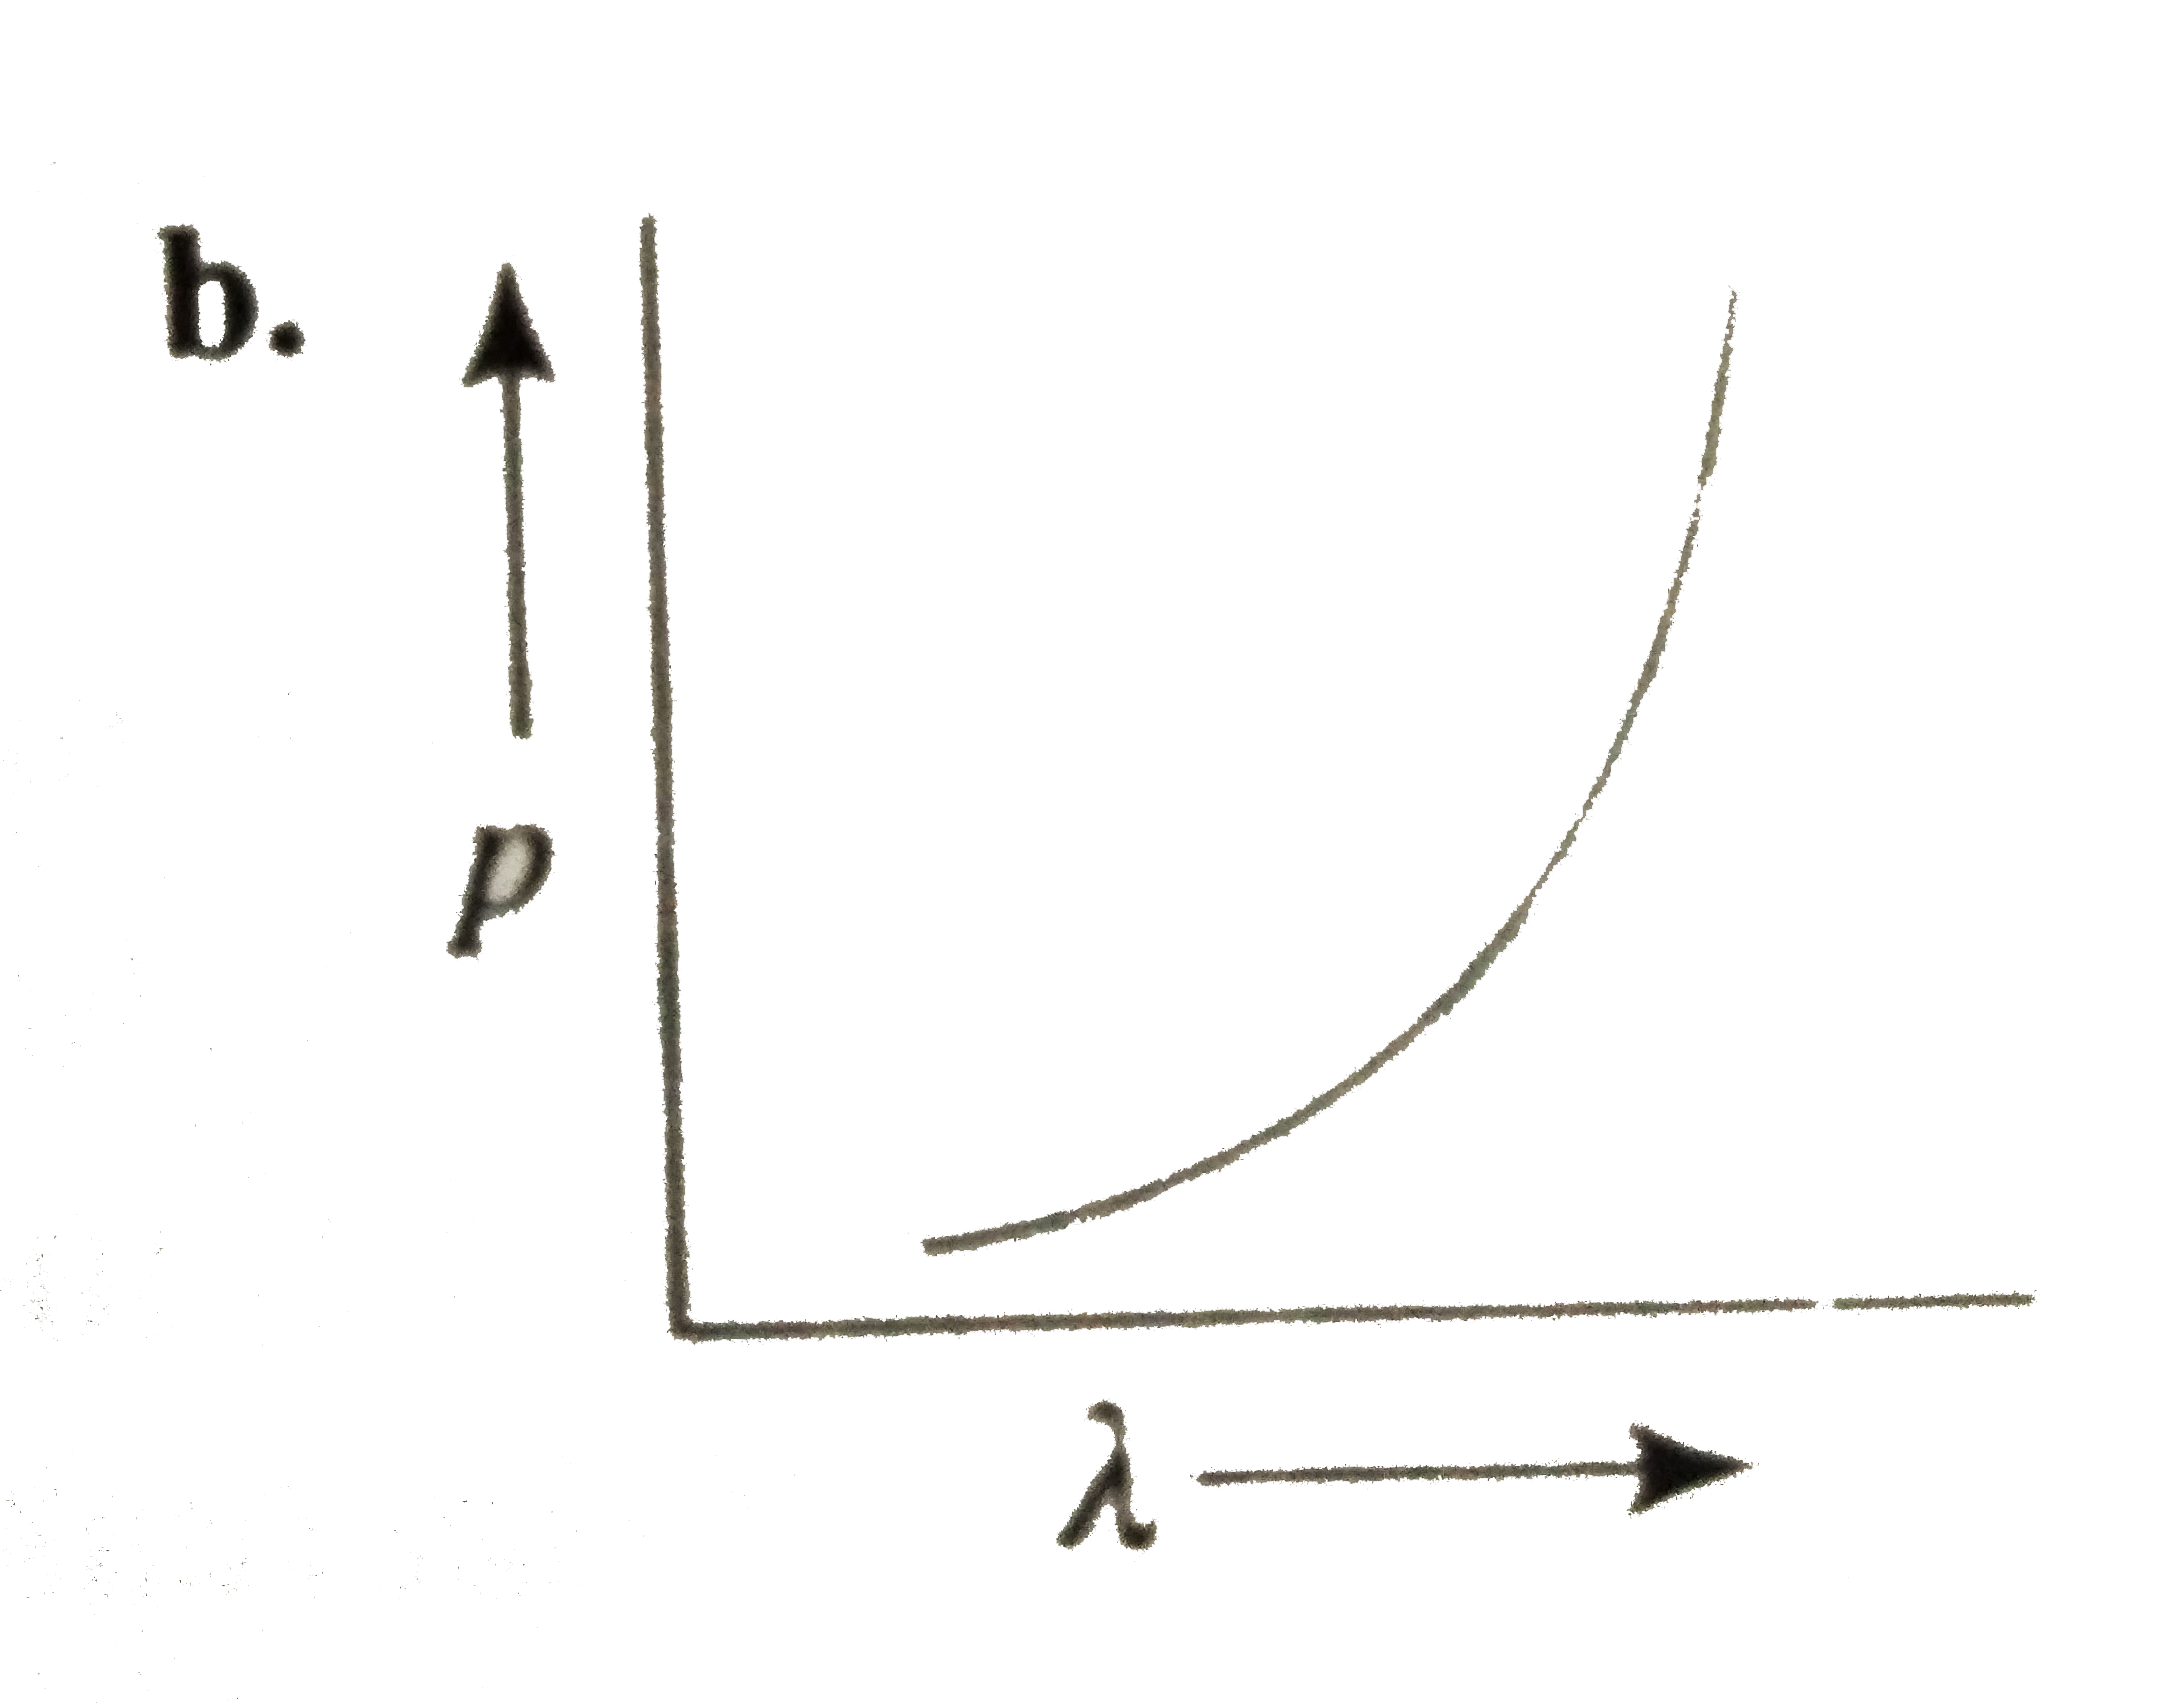 C
C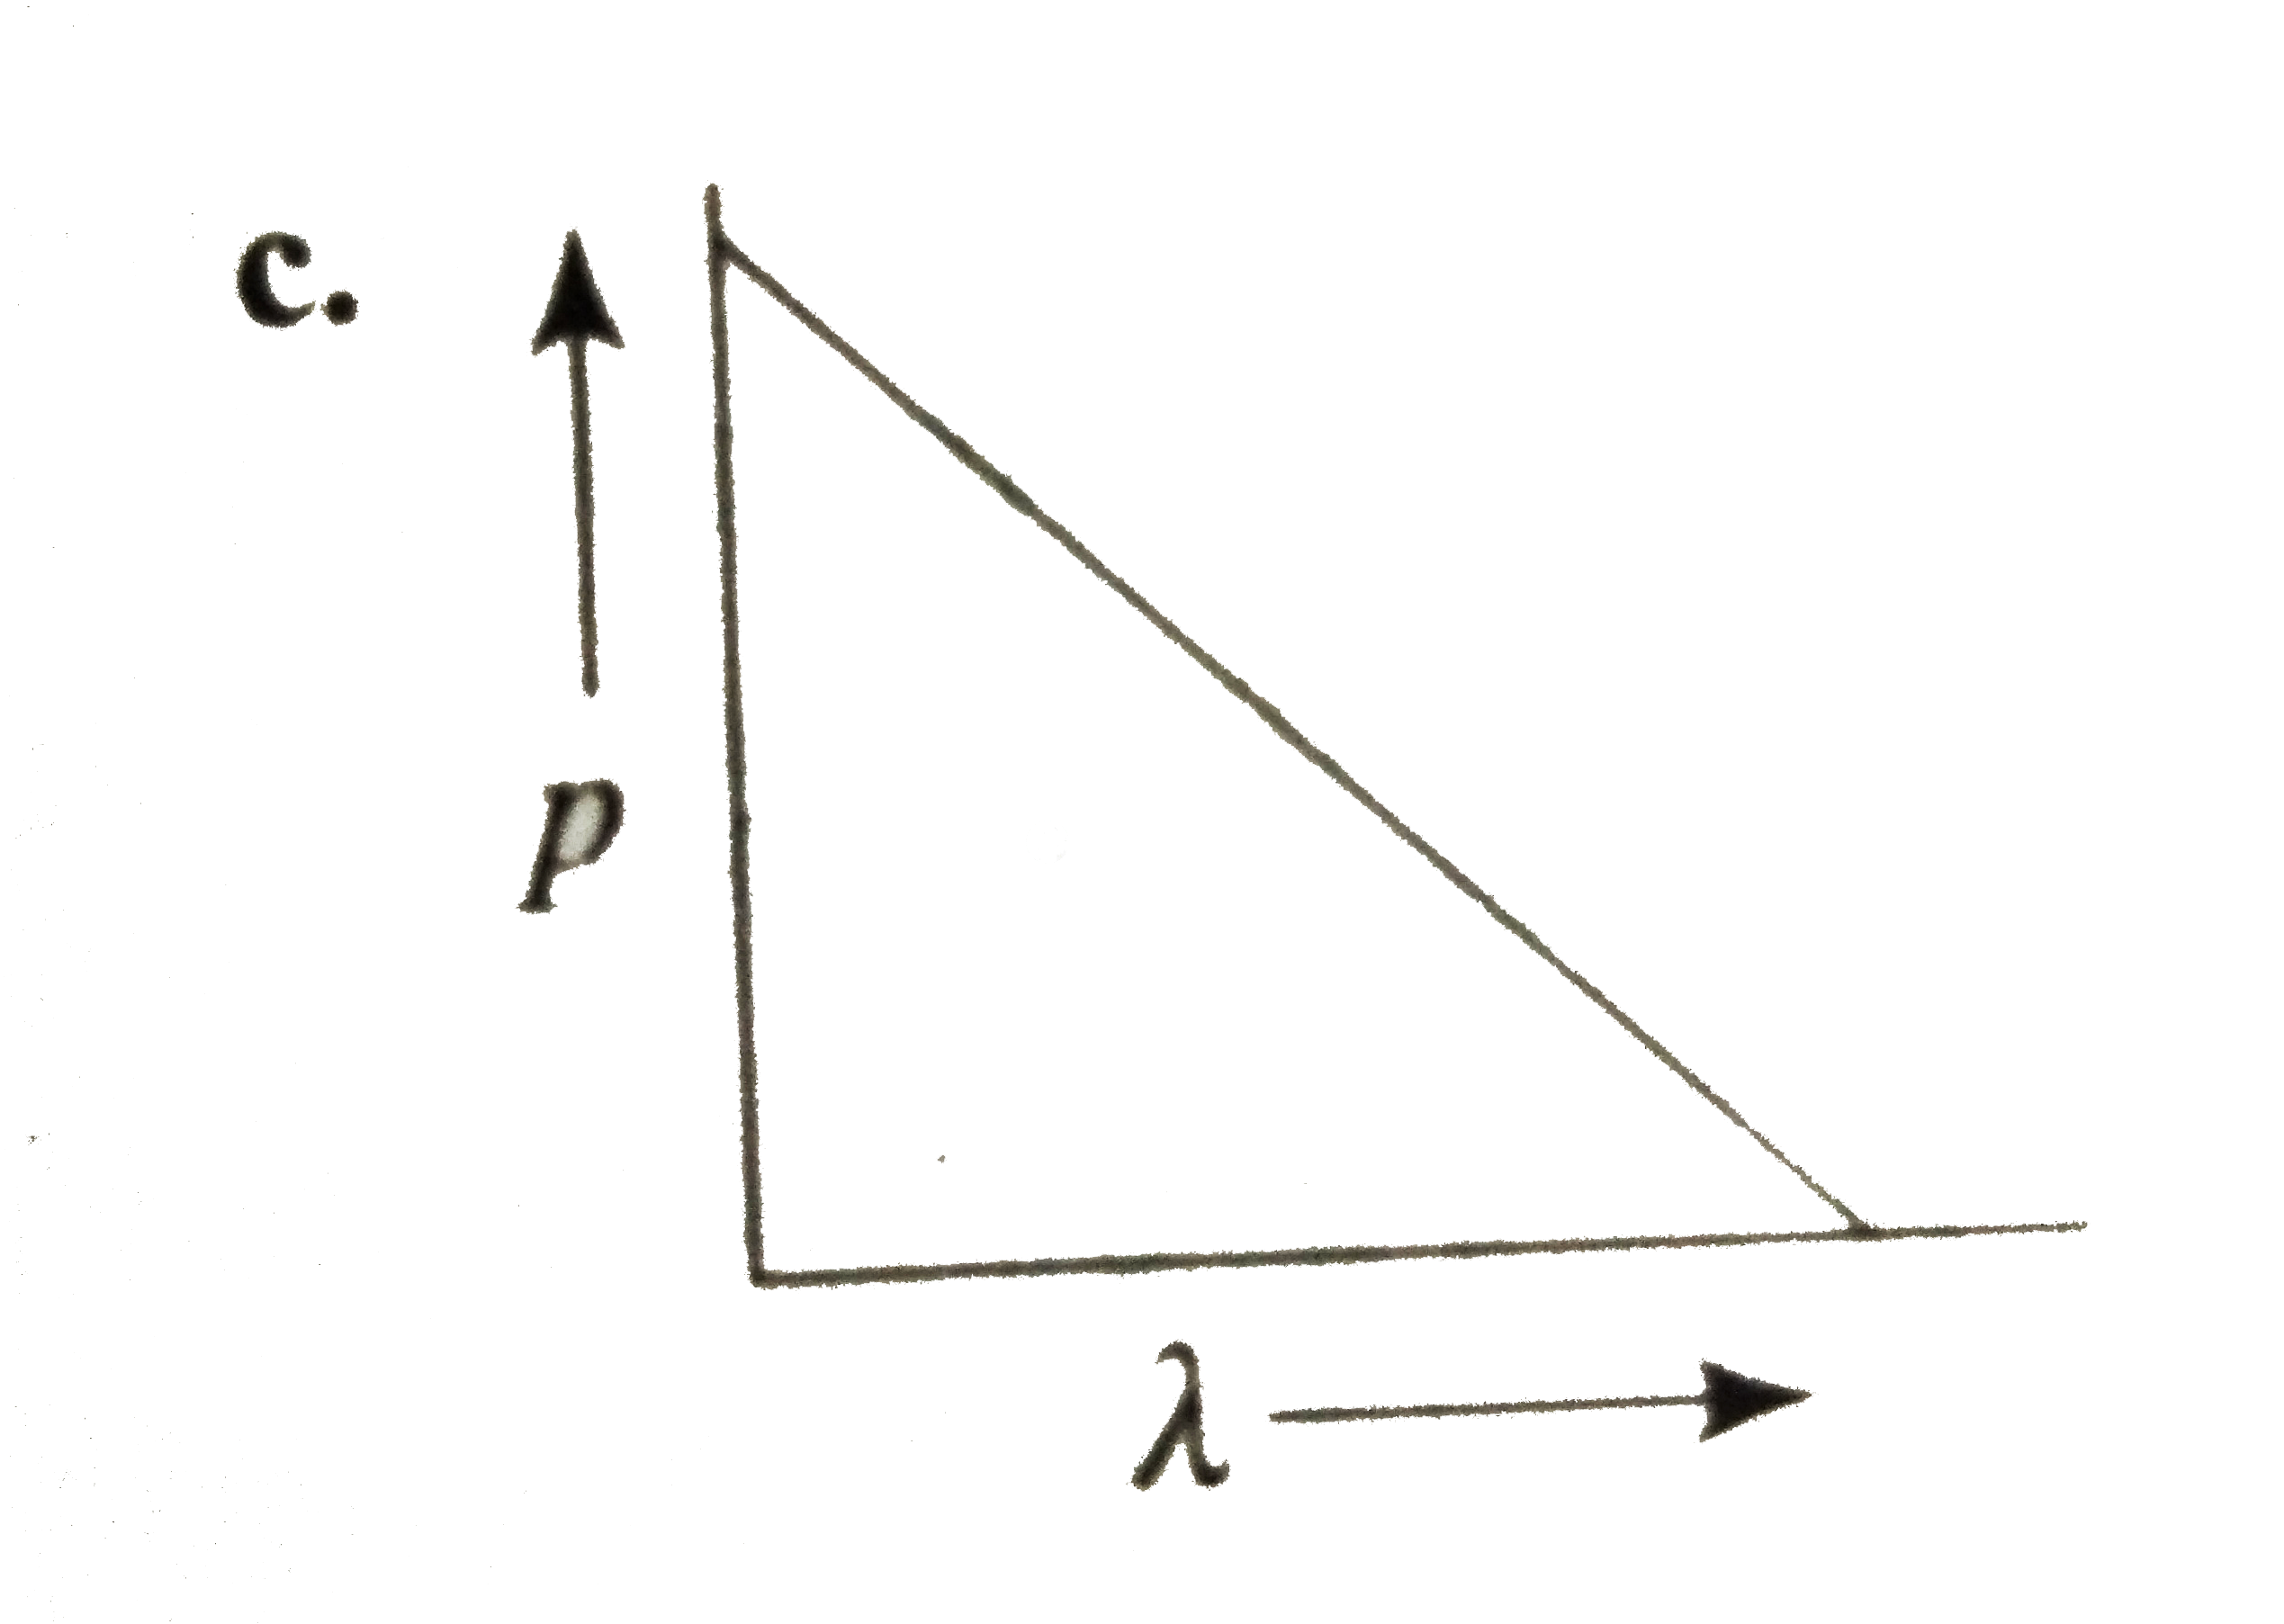 D
D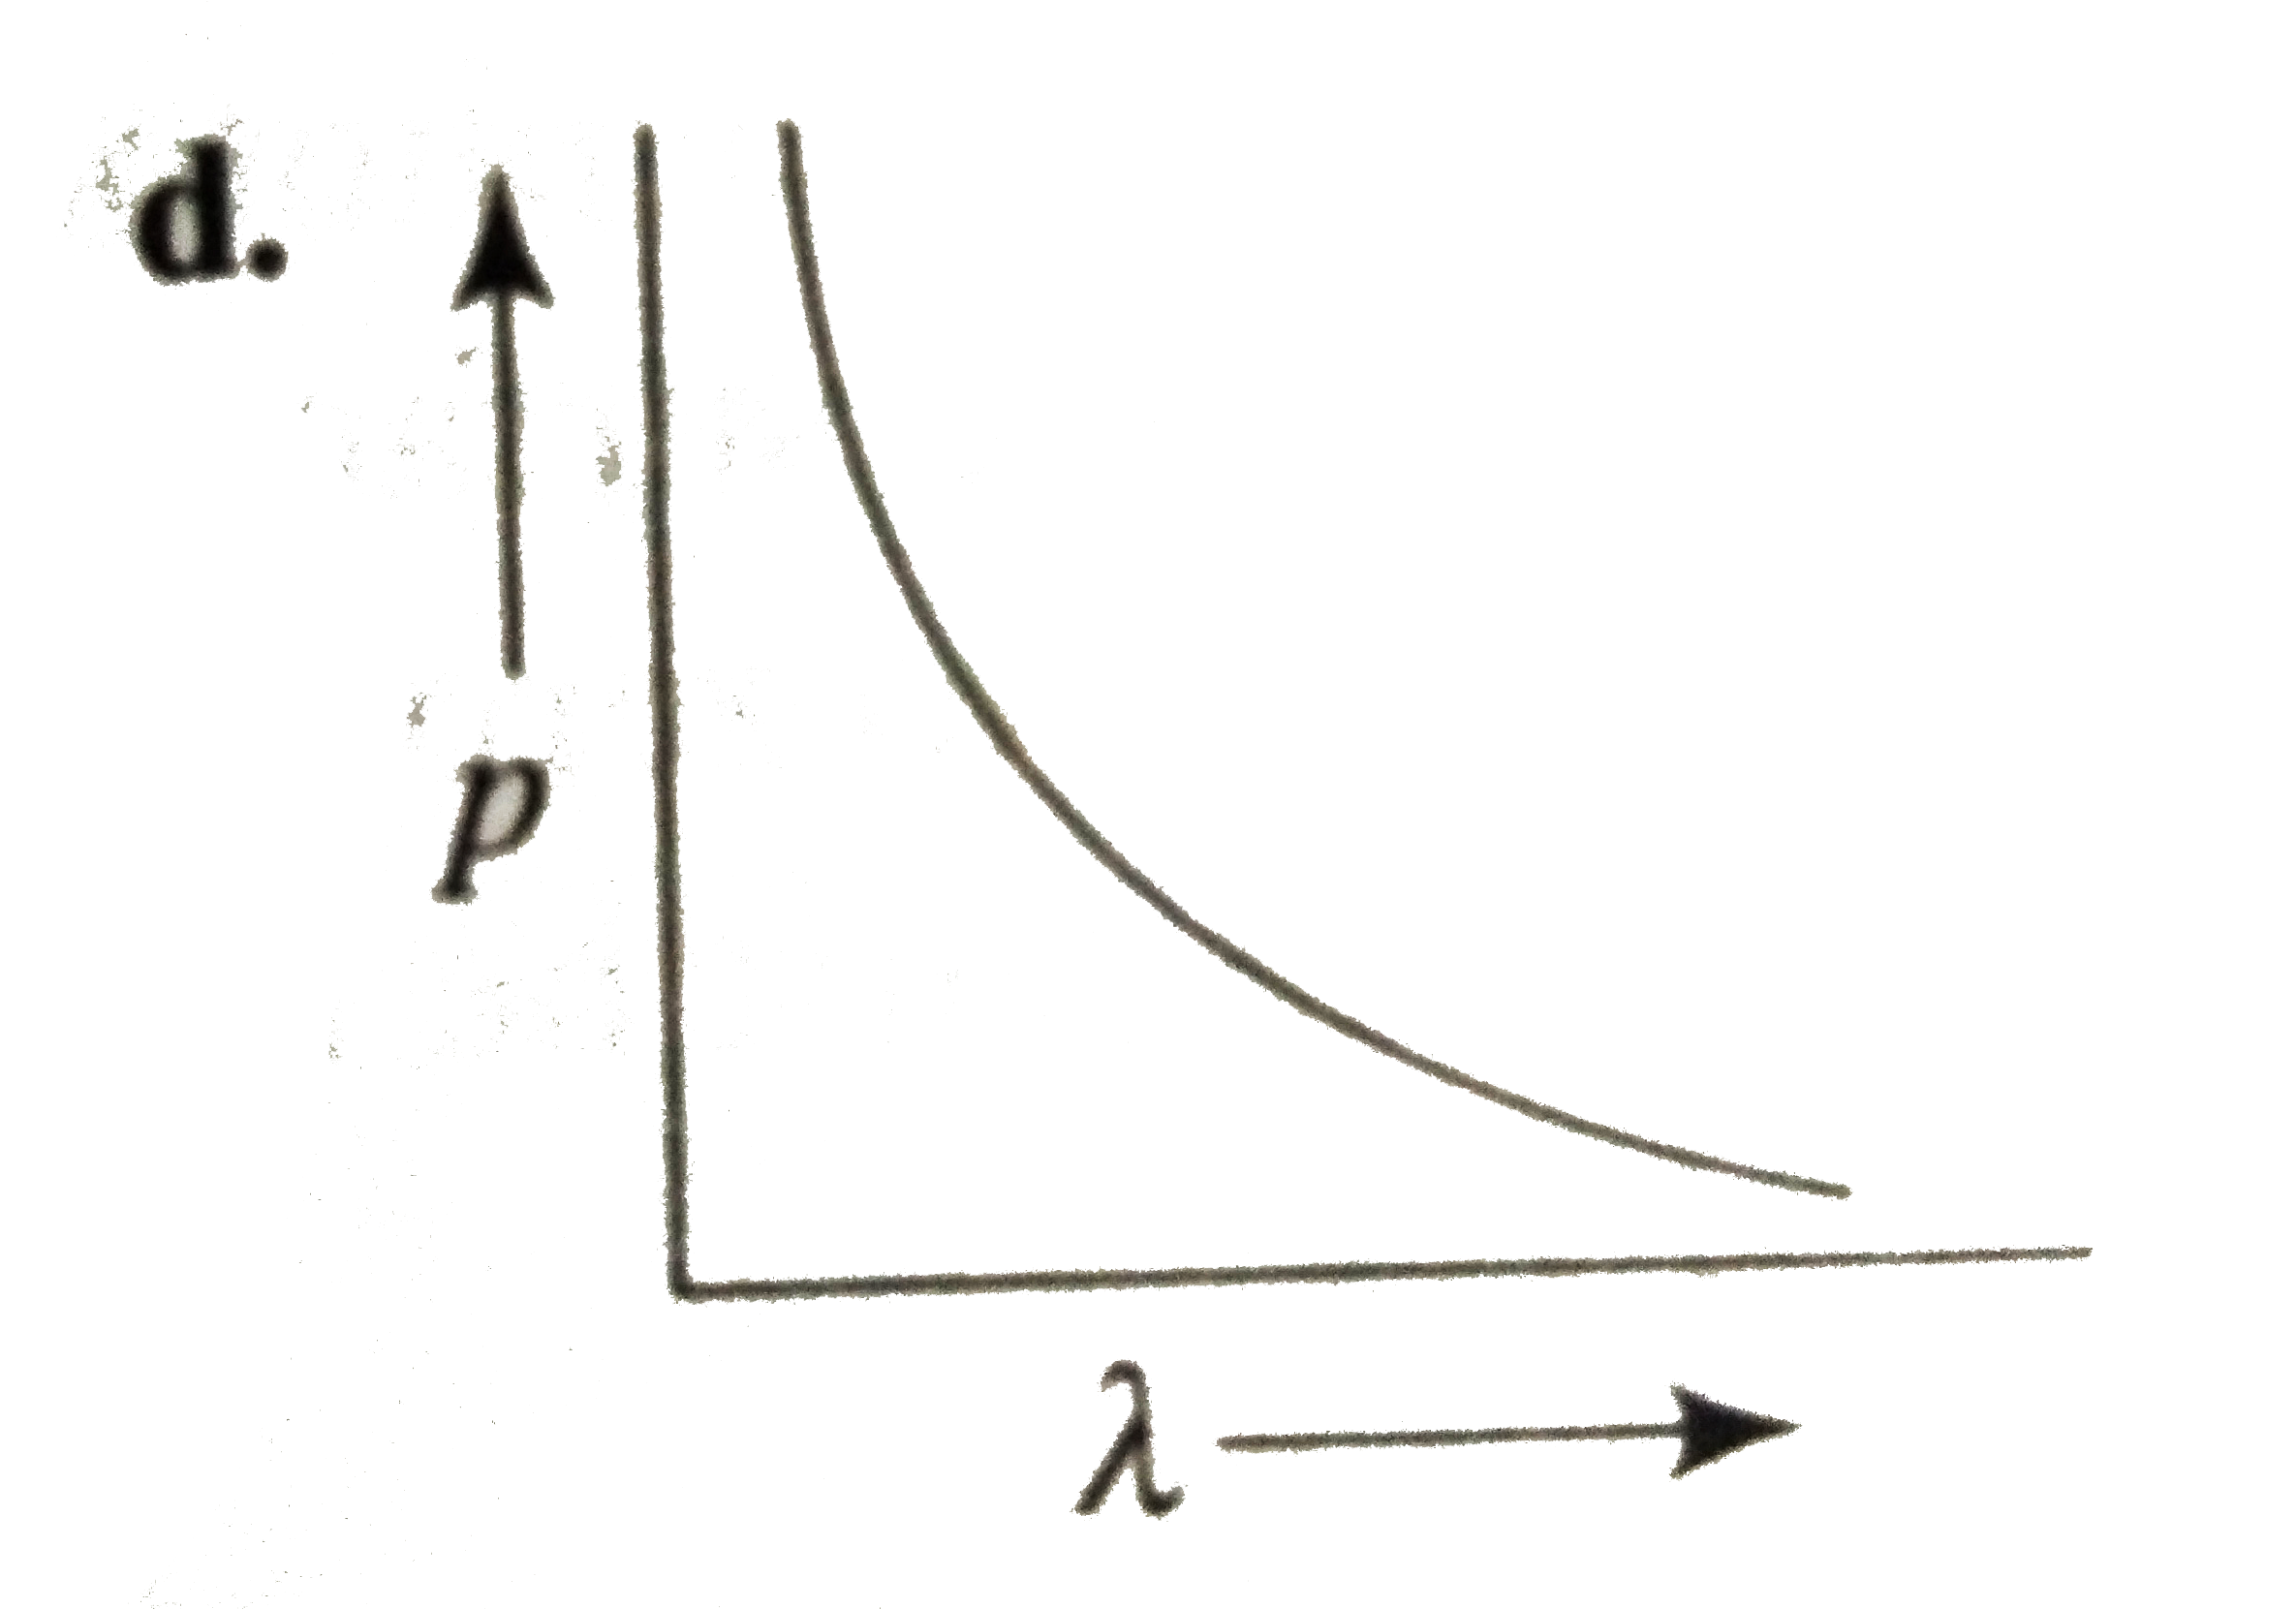
The momentum of a particle associated with de-Broglie's wavelength of 6Å is
View SolutionThe momentum of a particle having de-Broglie wavelength of 6Å
View SolutionWhich of the following particles moving with the same velocity would be associated with smallest de-Broglie wavelength?
View SolutionVeriation of momentum of perticle (p) with associated de-Broglie wavelength (λ) is shown correctly by
View SolutionIn which of the following cases the havier of the two particles has a smaller de-Broglie wavelength ? The two particles
View Solution

