Complete Solutions to Illustration of chapter ORGANISATION OF DATA of Class 11 book with complete answers and questions
| Class 11 | ECONOMICS |
| Chapter | ORGANISATION OF DATA |
| TARUN JAIN & VK OHRI | Illustration |
| Number Of Questions | 8 |
| Academic Year | 2023-24 |
Twenty students of Class XI have secured the following marks :

Present the data as a frequency array.
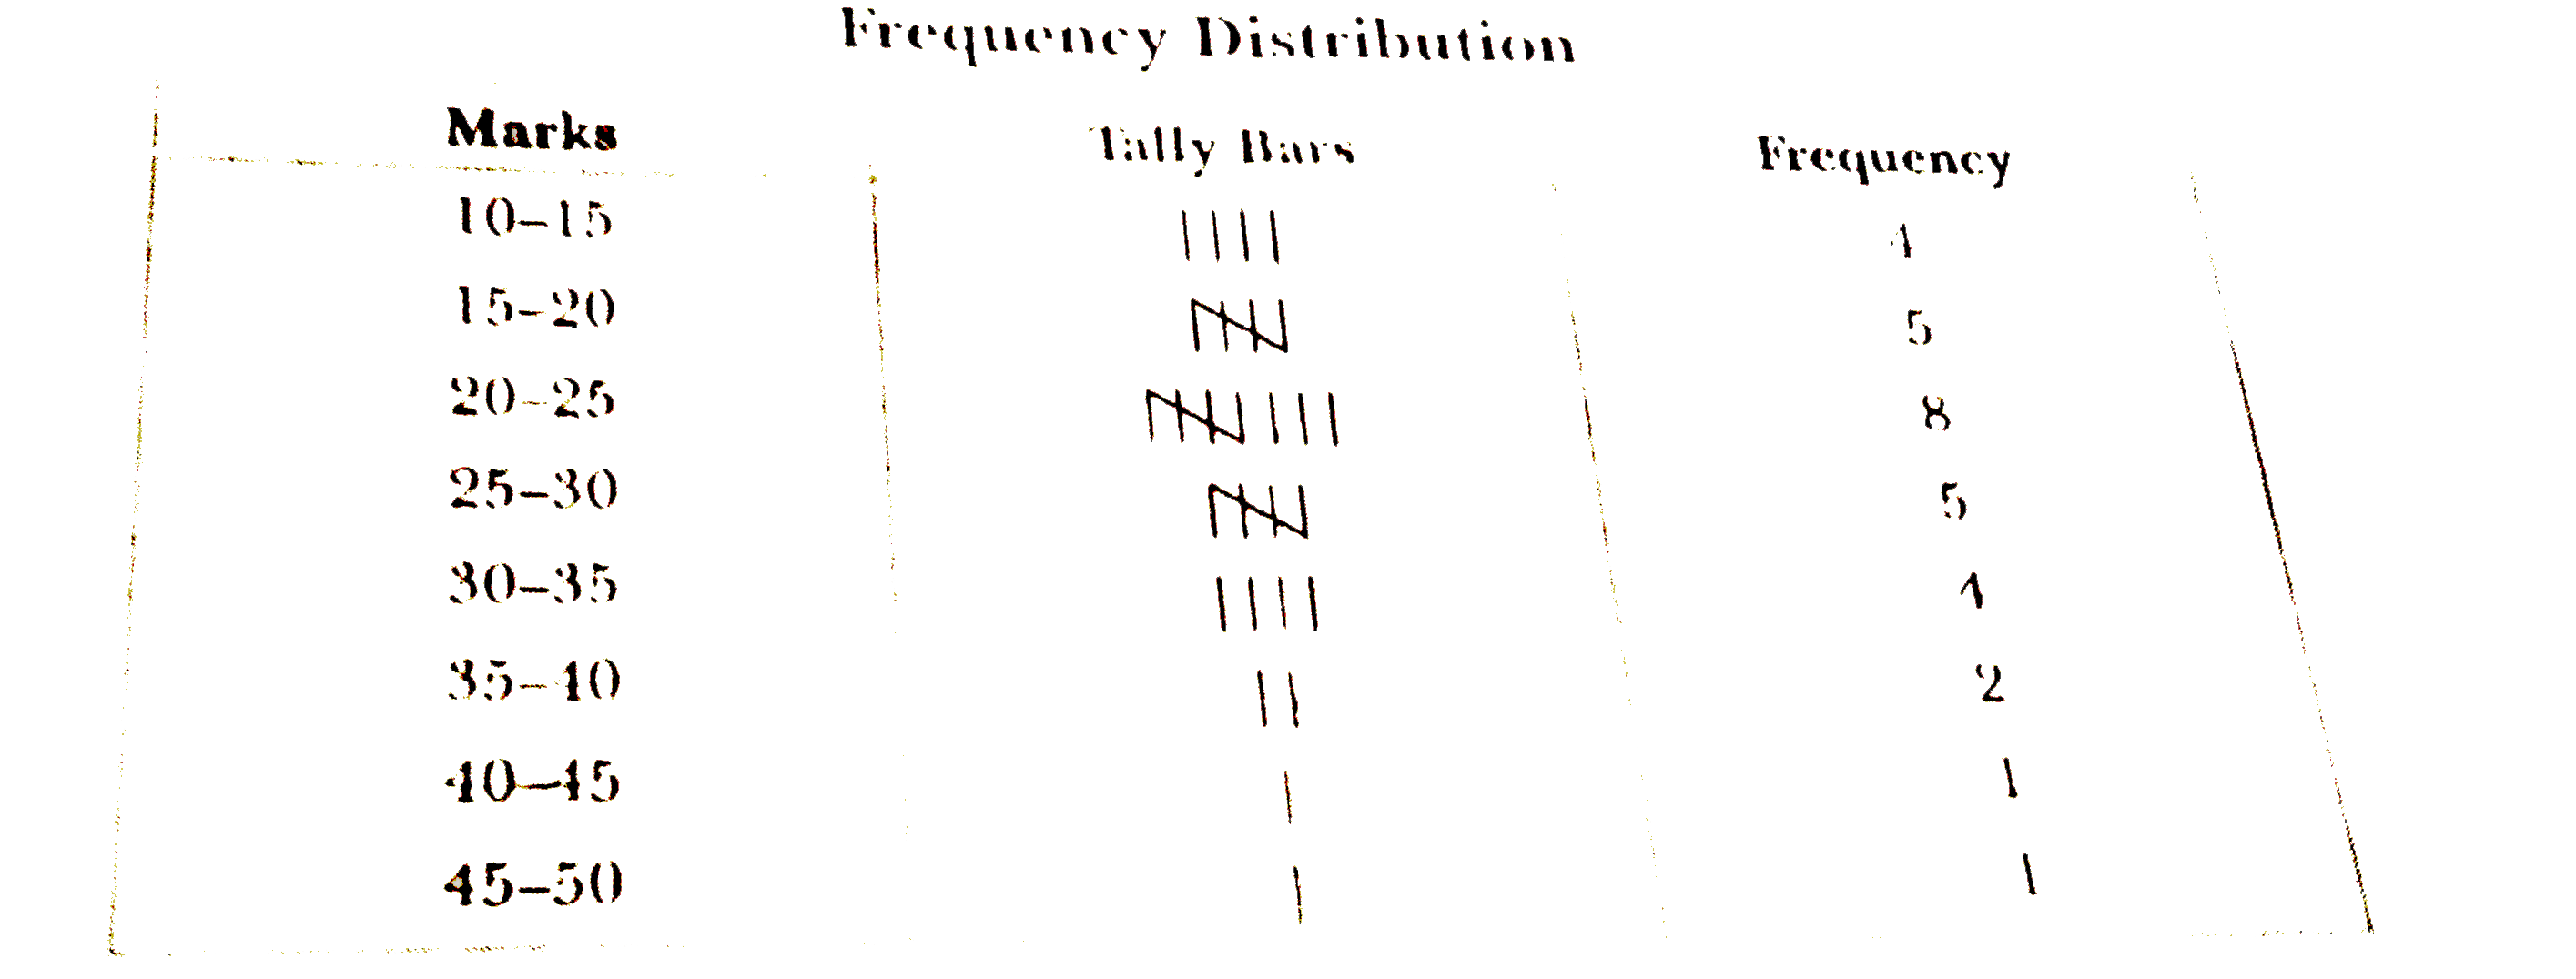
View SolutionFollowing table offers an illustration of a frequency distribution. The table shows different class intervals (each showing a range of marks in Statistics) and the corresponding frequencies (each showing the number of students).

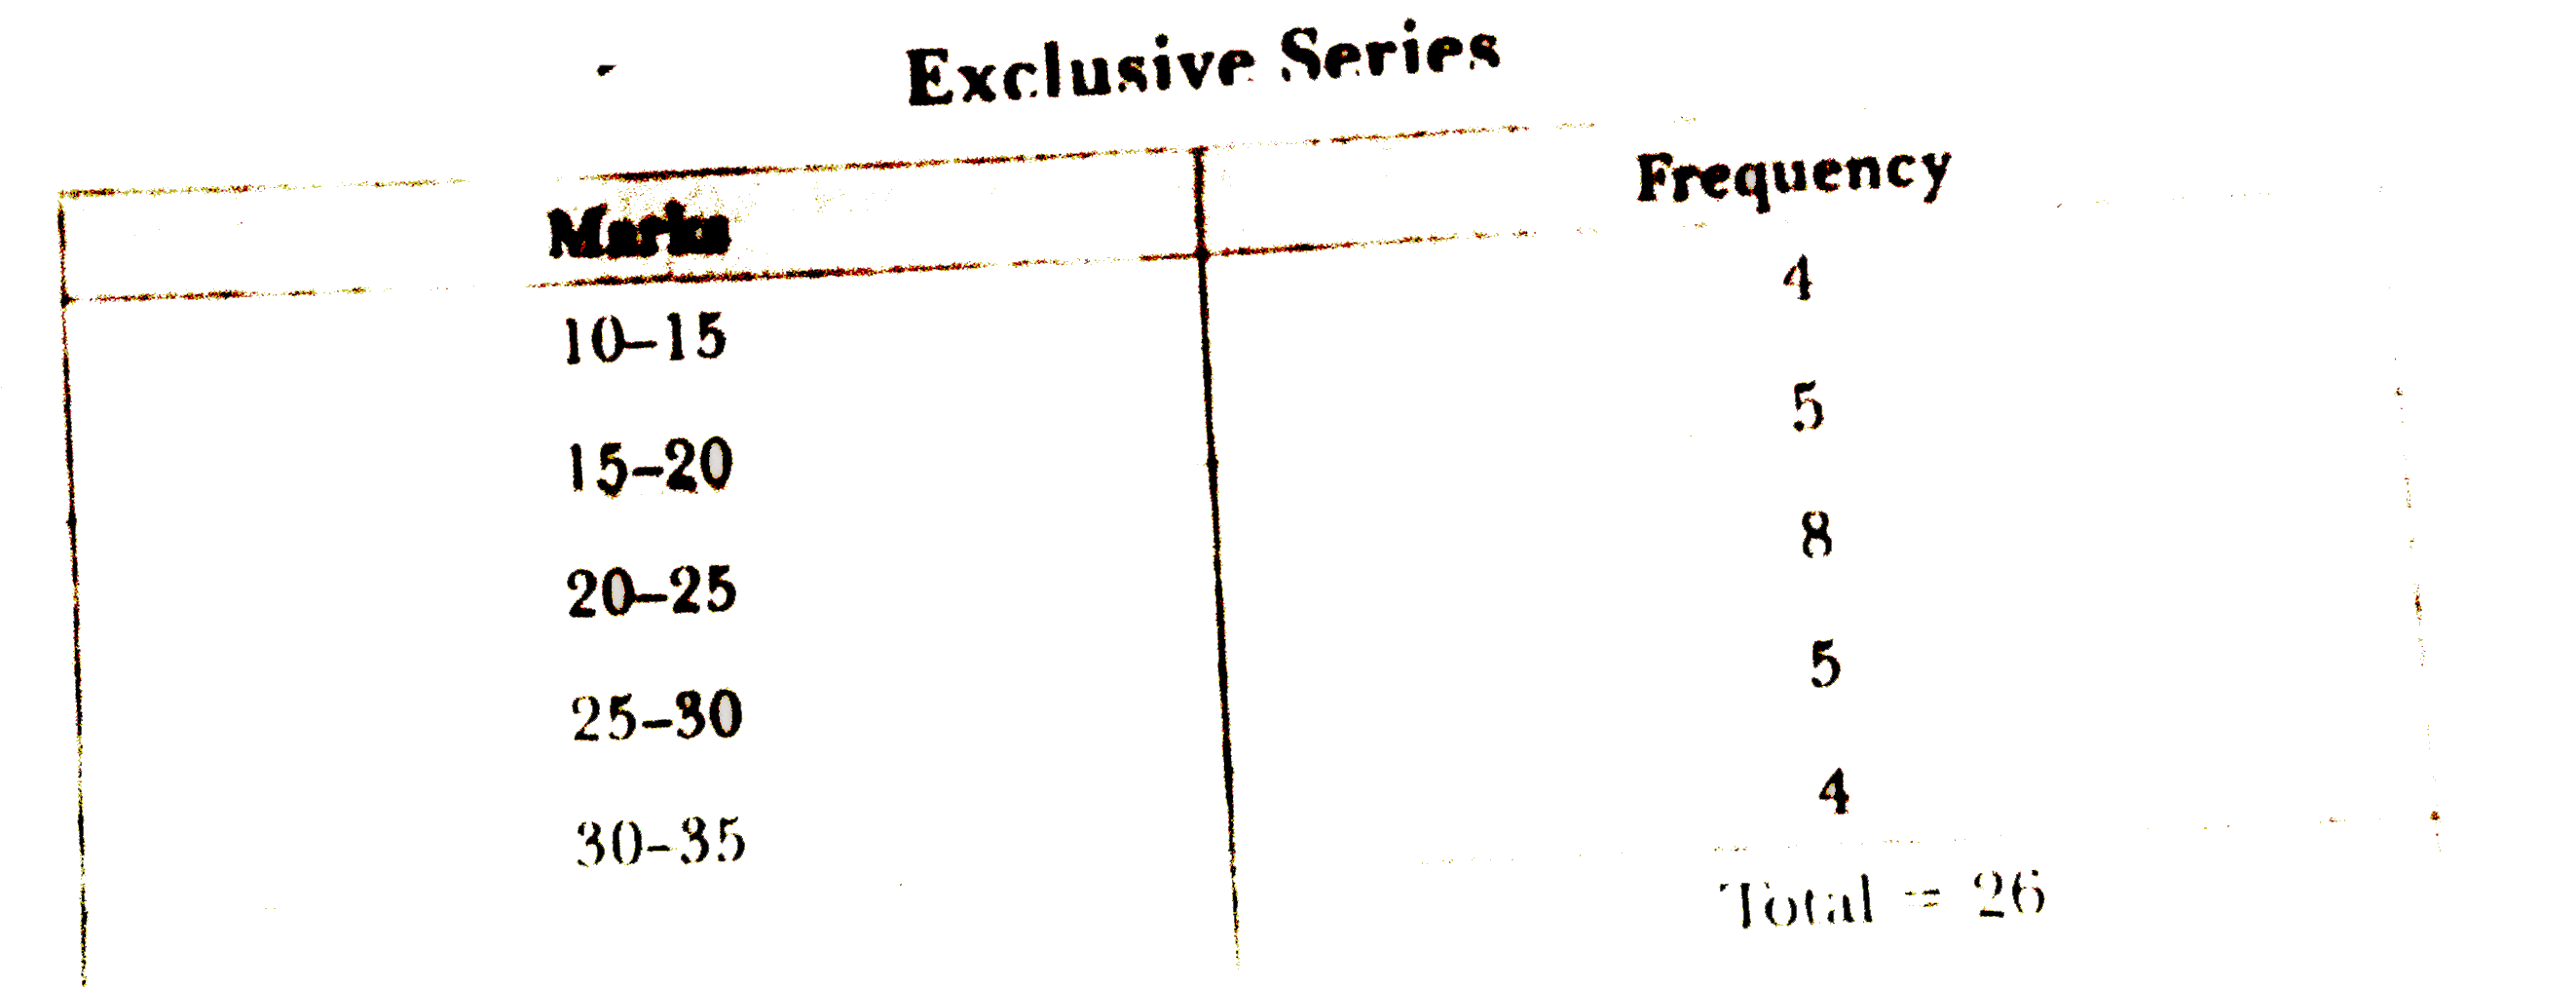
View SolutionExclusive Series

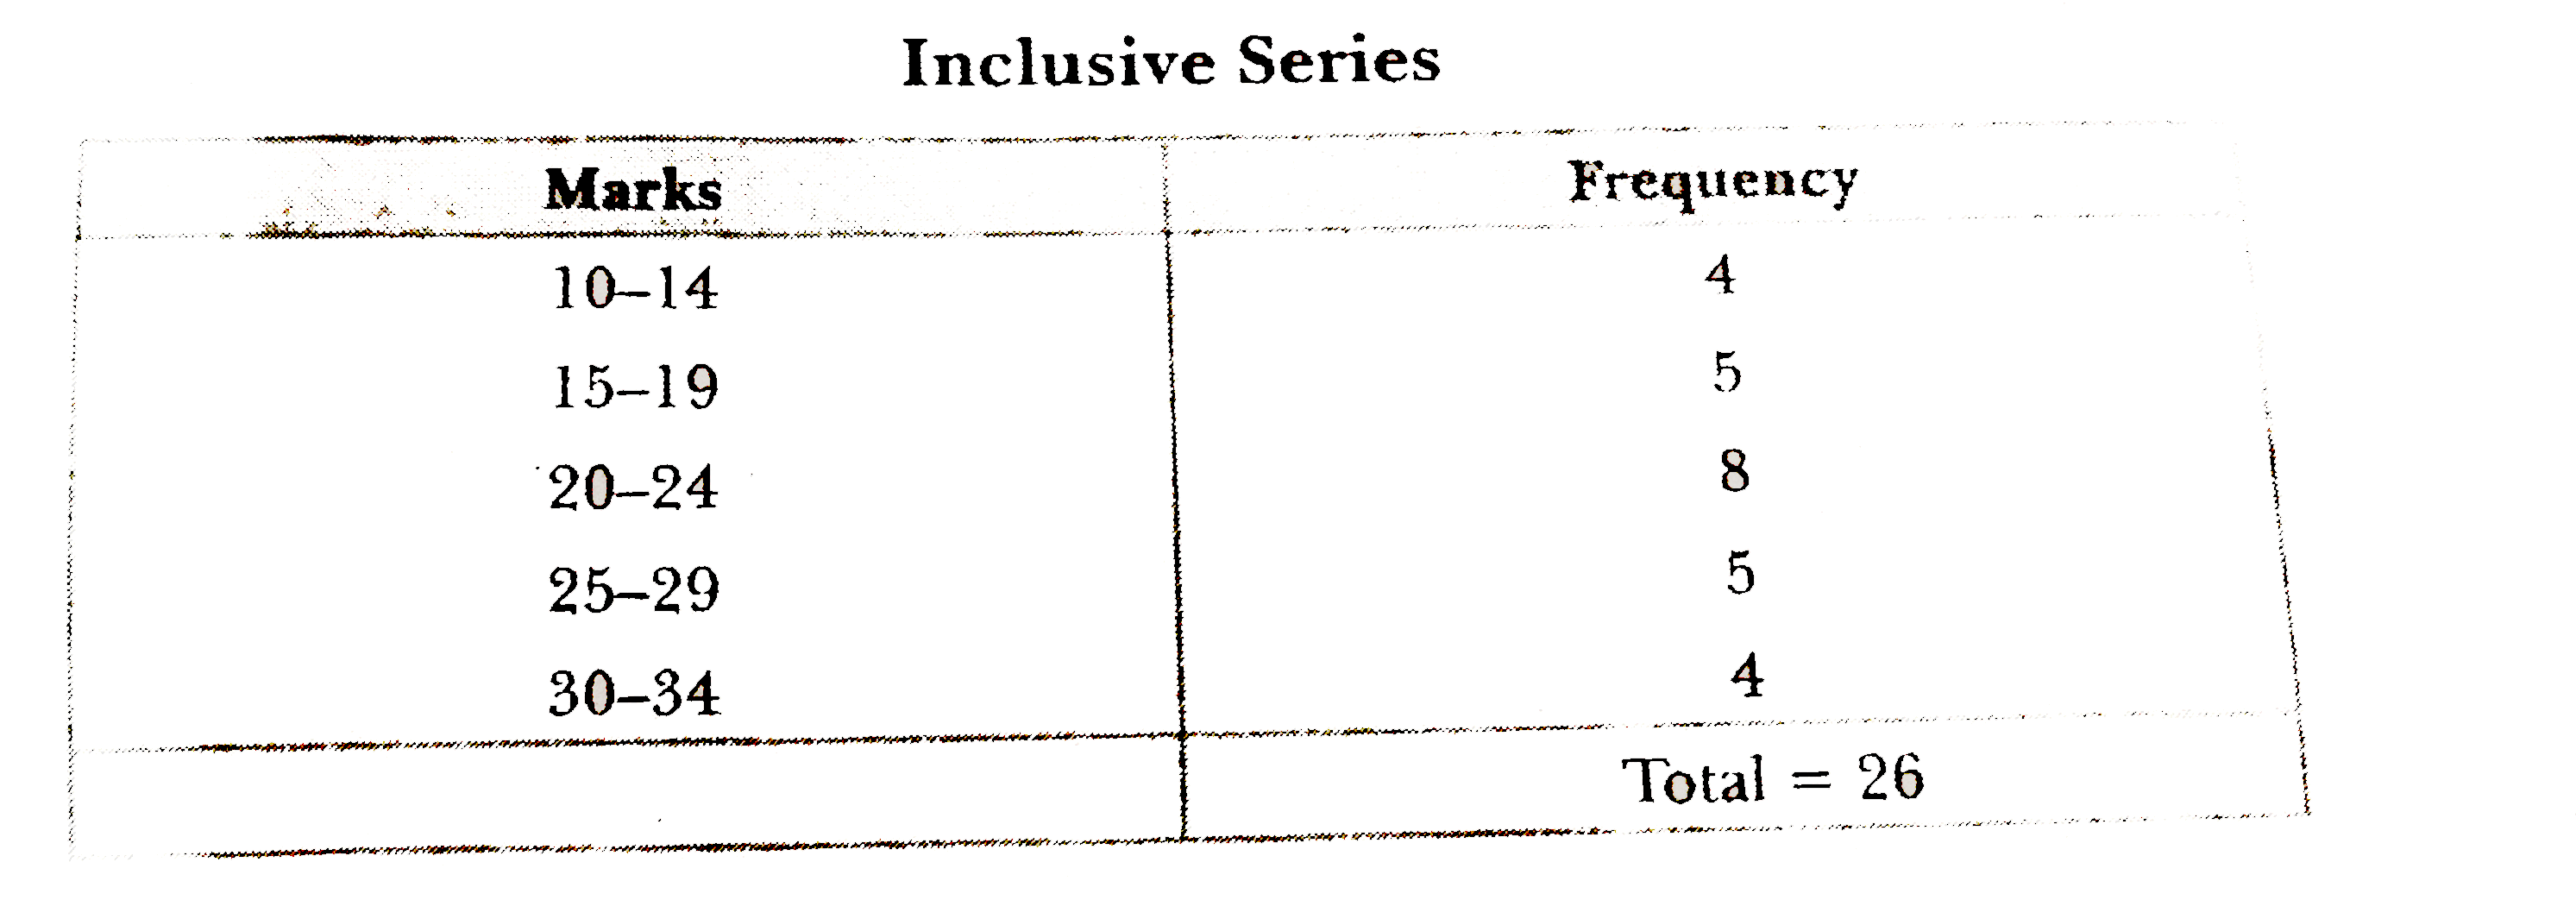
View SolutionConvert Inclusive Series into Exclusive Series

View SolutionSimple Frequency Series

View SolutionConvert the following cumulative frequency series into a simple frequency series.
4 students obtained less than 10 marks
20 students obtained less than 20 marks
40 students obtained less than 30 marks
48 students obtained less than 40 marks
50 students obtained less than 50 marks
View Solution
Such series may be converted into simple frequency series using the following method:
(i) First, mutual difference between mid-values (i), is determined, and (ii) Second, the difference so obtained is reduced to half `(1/2i)` which when deducted from the mid-value gives lower limit of the class interval and when added to the mid-value gives the corresponding upper limit.
View SolutionClass mid-values of a frequency distribution of marks in economics of a group of students in Class XI are given as 25,32,39,46,53 and 60.
Find the size of the class interval and class limits.
View Solution
Illustration questions and complete solutions for chapter ORGANISATION OF DATA of VK GLOBAL PUBLICATION ECONOMICS (HINGLISH) of Class 11