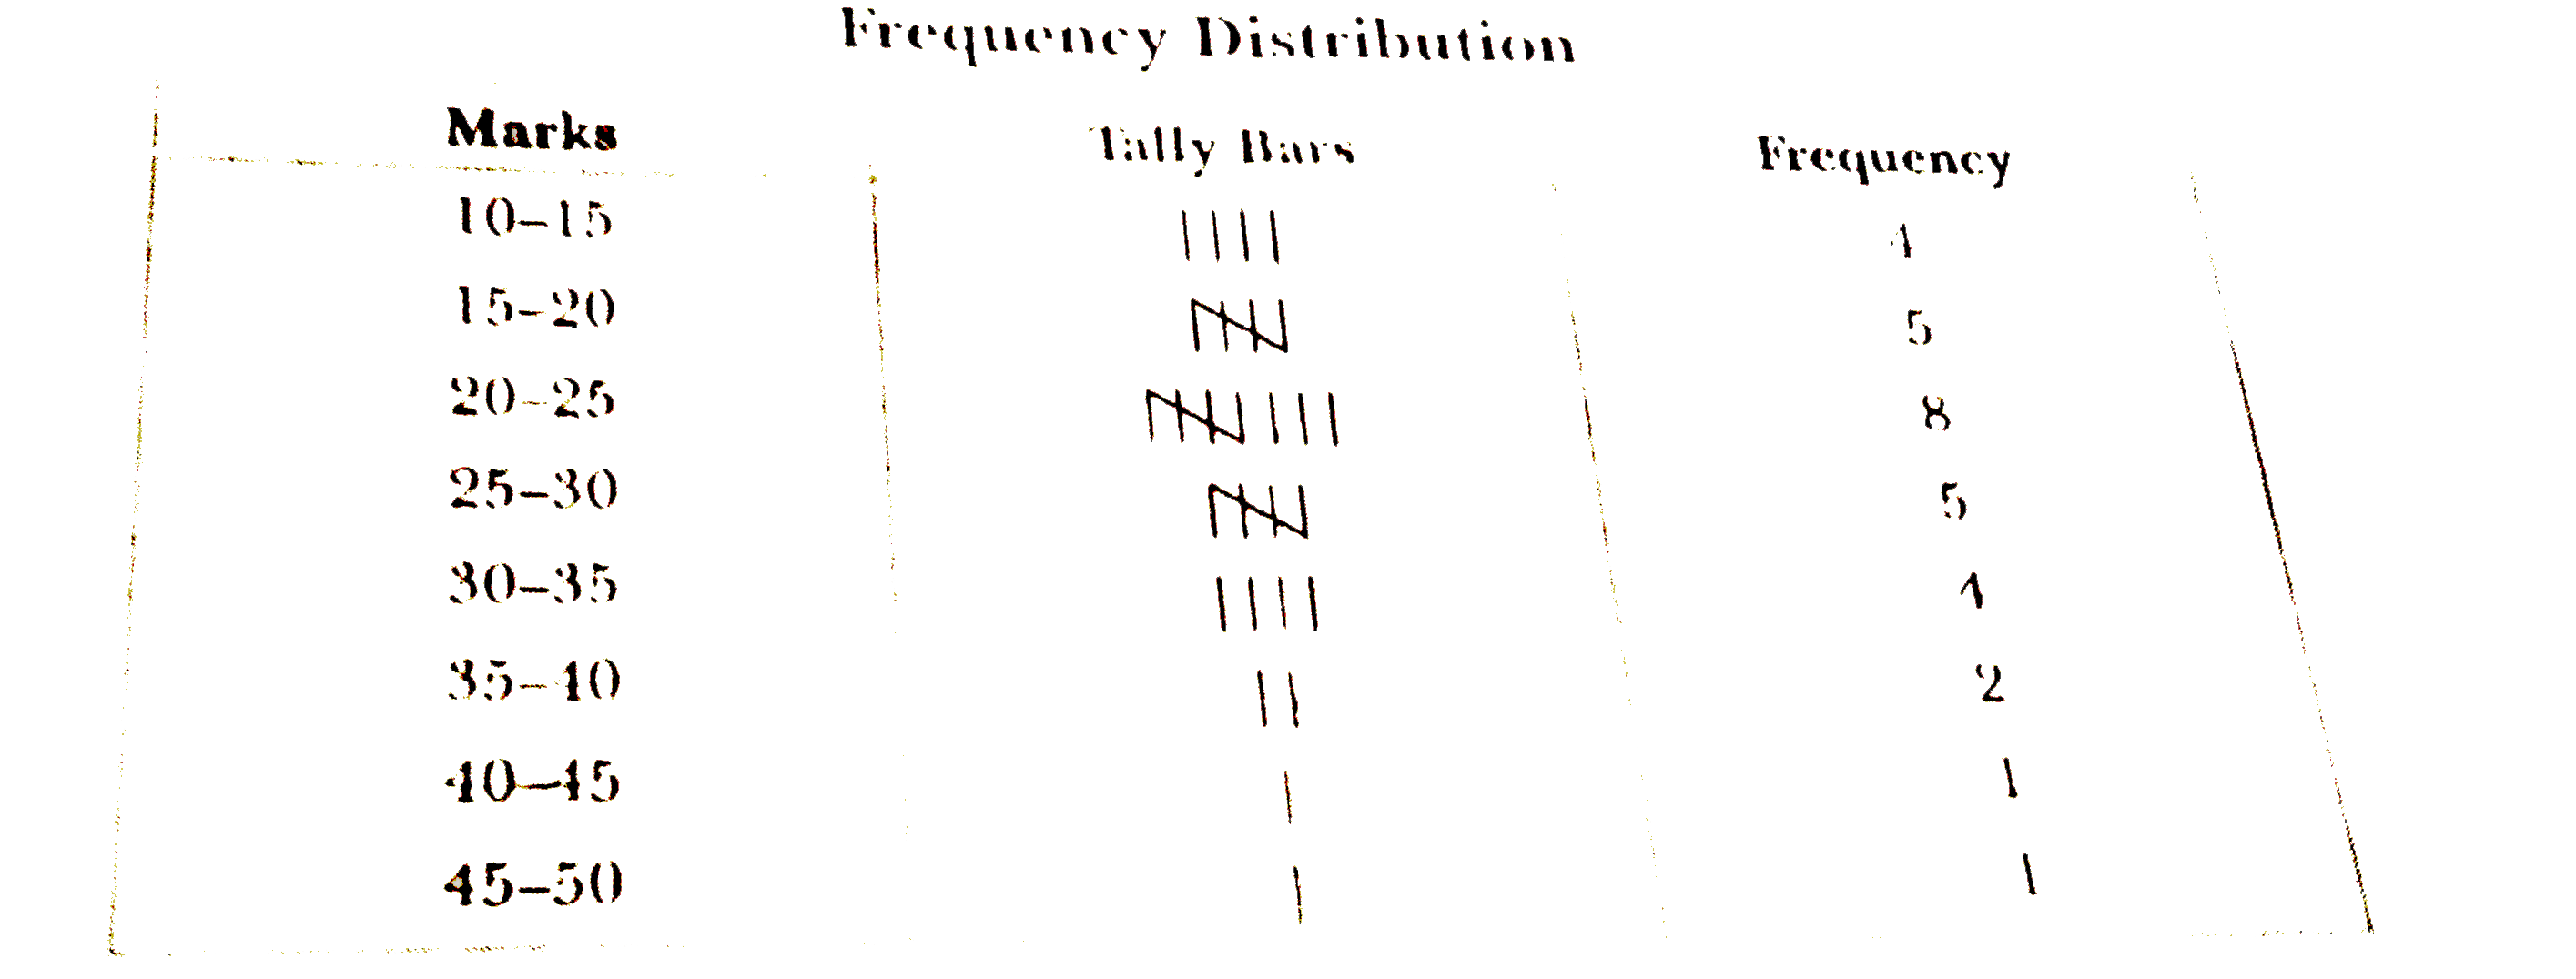
Following table offers an illustration of a frequency distribution. The table shows different class intervals (each showing a range of marks in Statistics) and the corresponding frequencies (each showing the number of students).

It is clear from above table that frequency of class interval 10-15 is 4. It means that there are 4 students who have secured marks between 10-15. Likewise, frequency of class interval 20-25 is 8 which means that there are 8 students who have secured marks between 20-25. But, it is not clear that how many students have secured 10 marks in the class interval 10-15 and how many have secured 11 and 14 marks in the same class interval.
Topper's Solved these Questions
- ORGANISATION OF DATABOOK - TARUN JAIN & VK OHRICHAPTER - ORGANISATION OF DATAEXERCISE - Miscellaneous Illustration
13 Videos
- ORGANISATION OF DATABOOK - TARUN JAIN & VK OHRICHAPTER - ORGANISATION OF DATAEXERCISE - EXERCISE M.C.Q
10 Videos
- MEASURES OF DISPERSIONBOOK - TARUN JAIN & VK OHRICHAPTER - MEASURES OF DISPERSIONEXERCISE - Learning by doing
30 Videos
- PRESENTATION OF DATA - TEXTUAL AND TABULAR PRESENTATIONBOOK - TARUN JAIN & VK OHRICHAPTER - PRESENTATION OF DATA - TEXTUAL AND TABULAR PRESENTATIONEXERCISE - ESSENTIAL PRATICALS
8 Videos
Similar Questions
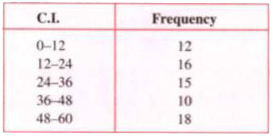
Contruct a cumulative frequency distributions table from the following frequency table:

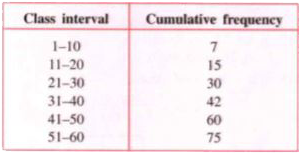
View SolutionContruct a cumulative frequency distributions table from the following frequency table:

View SolutionFollowing are the marks obtained by 25 students in Statistics . Prepare a frequency distribution by taking a class interval of 4 on exclusive basis.

View SolutionThe frequency distribution table shows the number of mango tree in a grove and their yield of mangoes.Find the megian of data.

View SolutionThe frequency distribution table shows the number of mango trees in a grove and their yield of mangoes. Find the median of data.

View SolutionThe frequency distribution table shows the number of mango trees in a grove and their yield of mangoes. Find the median of data.

View SolutionThe following table shows the frequency distribution of heights of 50 boys: Find the mode of heights
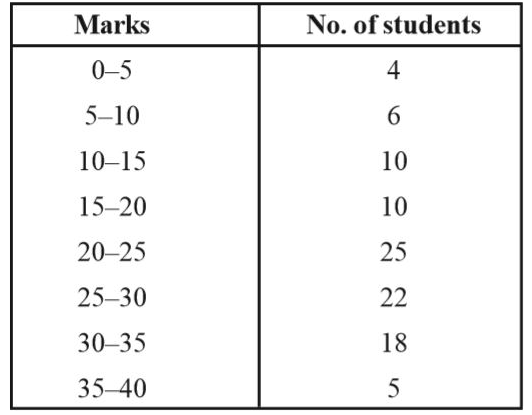
View SolutionFollowing table shows number of students of a college corresponding to different range of marks in Statistics.Make a frequency polygon.

View SolutionThe distribution given below show the marks of 100 students of a class:
then find Ogive medium of data
View SolutionThe following table shows the classification of percentages of marks of students and the number of students.Draw a frequency polygen from the table.

View Solution
