Complete Solutions to Miscellaneous Illustration of chapter FREQUENCY DIAGRAMS - HISTOGRAM, POLYGON AND OGIVE of Class 11 book with complete answers and questions
| Class 11 | ECONOMICS |
| Chapter | FREQUENCY DIAGRAMS - HISTOGRAM, POLYGON AND OGIVE |
| TARUN JAIN & VK OHRI | Miscellaneous Illustration |
| Number Of Questions | 8 |
| Academic Year | 2023-24 |
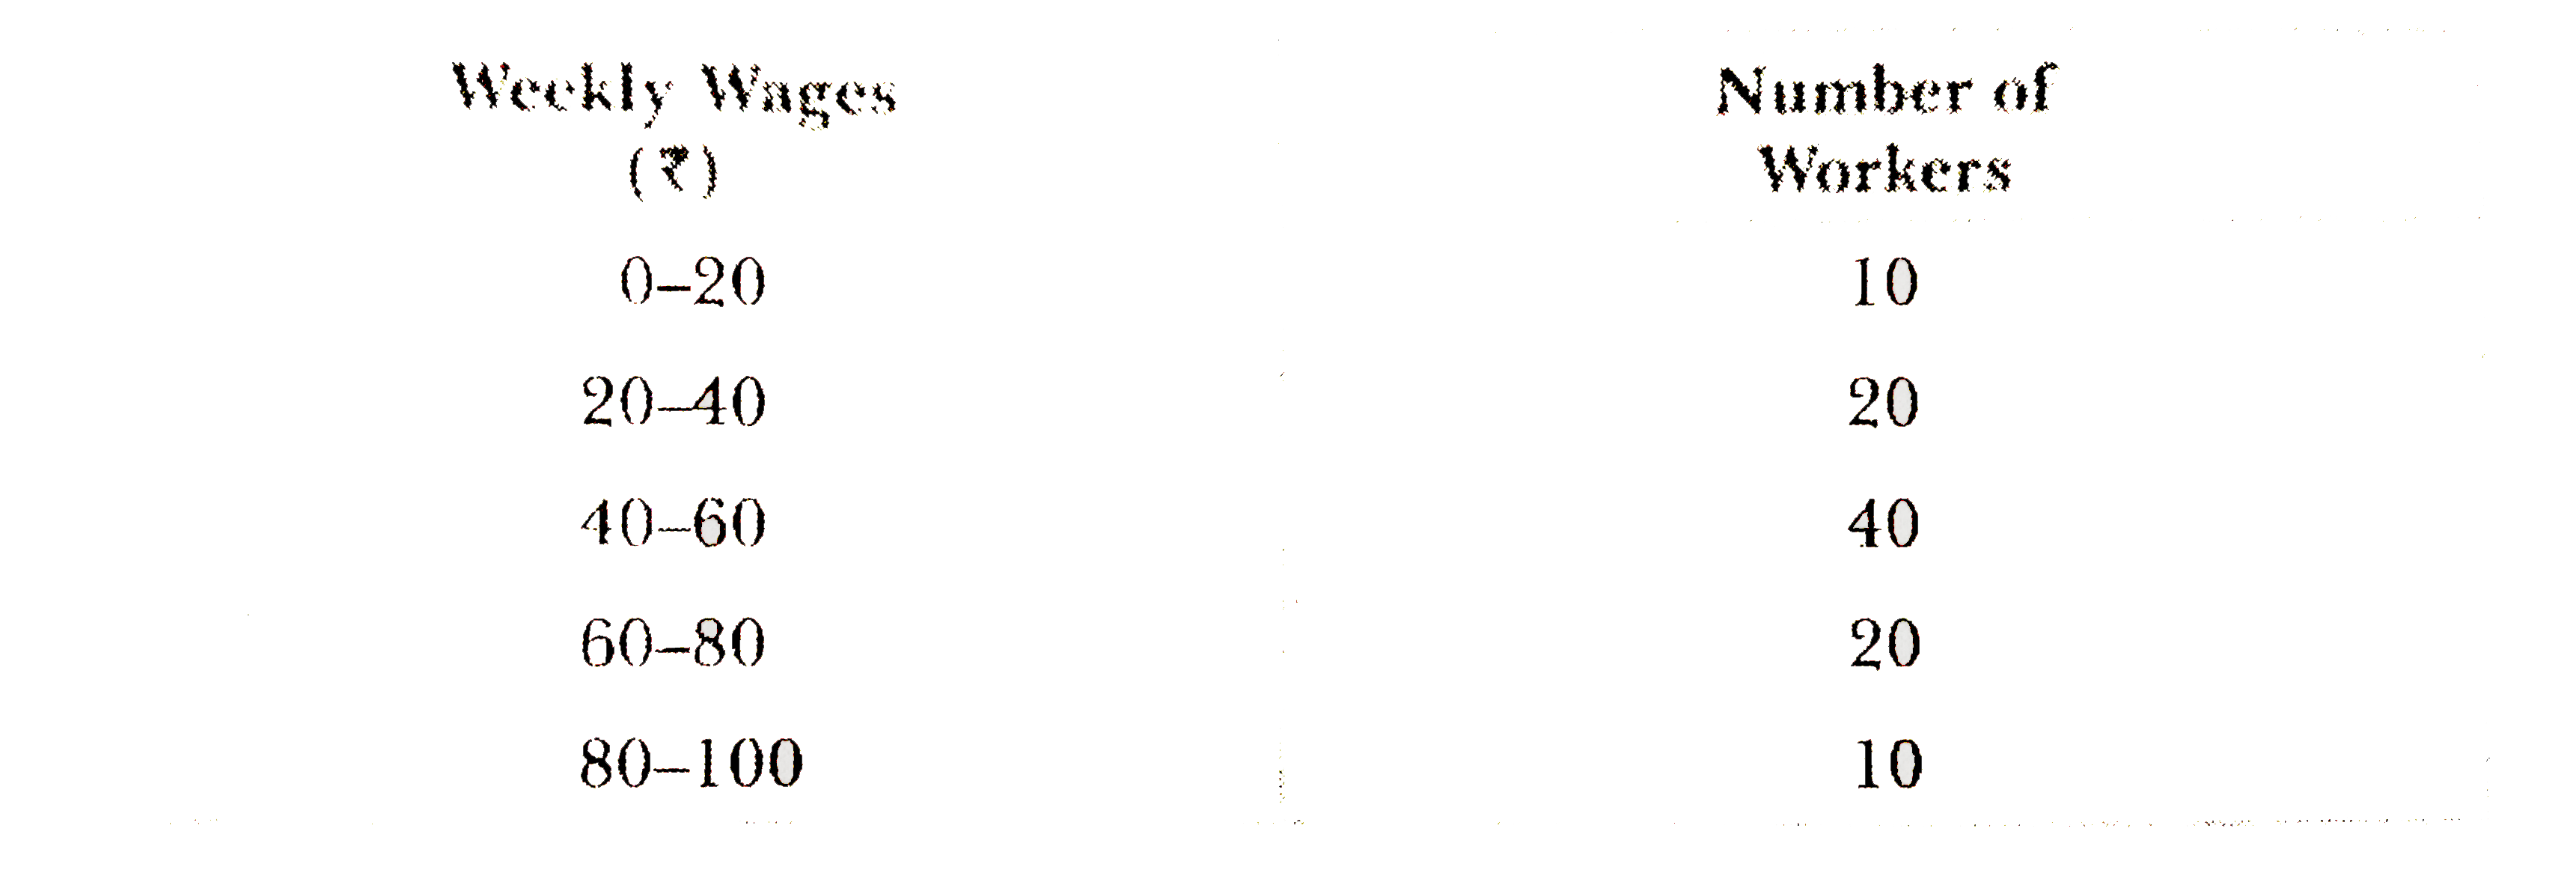
Prepare histogram and frequency polygon from the following data :
 07:44View Solution
From the following data, construct frequency histogram, frequency polygon and frequency curve.
 14:08View Solution
Draw the 'less than' and 'more than' ogive on the same graph paper from the data given below :
 19:59View Solution
Construct a histogram from the following data :
 05:51View Solution
Draw histogram and frequency polygon for the following distribution :
 08:41View Solution
Represent the following data by frequency curve :
 09:46View Solution
Draw a histogram, a frequency polygon and frequency curve of the following data :
 09:30View Solution
Draw the 'less than' and 'more than' ogive on the same graph paper from the data given below :
 16:34View Solution
Miscellaneous Illustration questions and complete solutions for chapter FREQUENCY DIAGRAMS - HISTOGRAM, POLYGON AND OGIVE of VK GLOBAL PUBLICATION ECONOMICS (HINGLISH) of Class 11
