Complete Solutions to Illustration of chapter FREQUENCY DIAGRAMS - HISTOGRAM, POLYGON AND OGIVE of Class 11 book with complete answers and questions
| Class 11 | ECONOMICS |
| Chapter | FREQUENCY DIAGRAMS - HISTOGRAM, POLYGON AND OGIVE |
| TARUN JAIN & VK OHRI | Illustration |
| Number Of Questions | 6 |
| Academic Year | 2023-24 |
The table below shows number of students of students of a college corresponding to different range of marks in Statistics. Present the information in the form of a histogram.

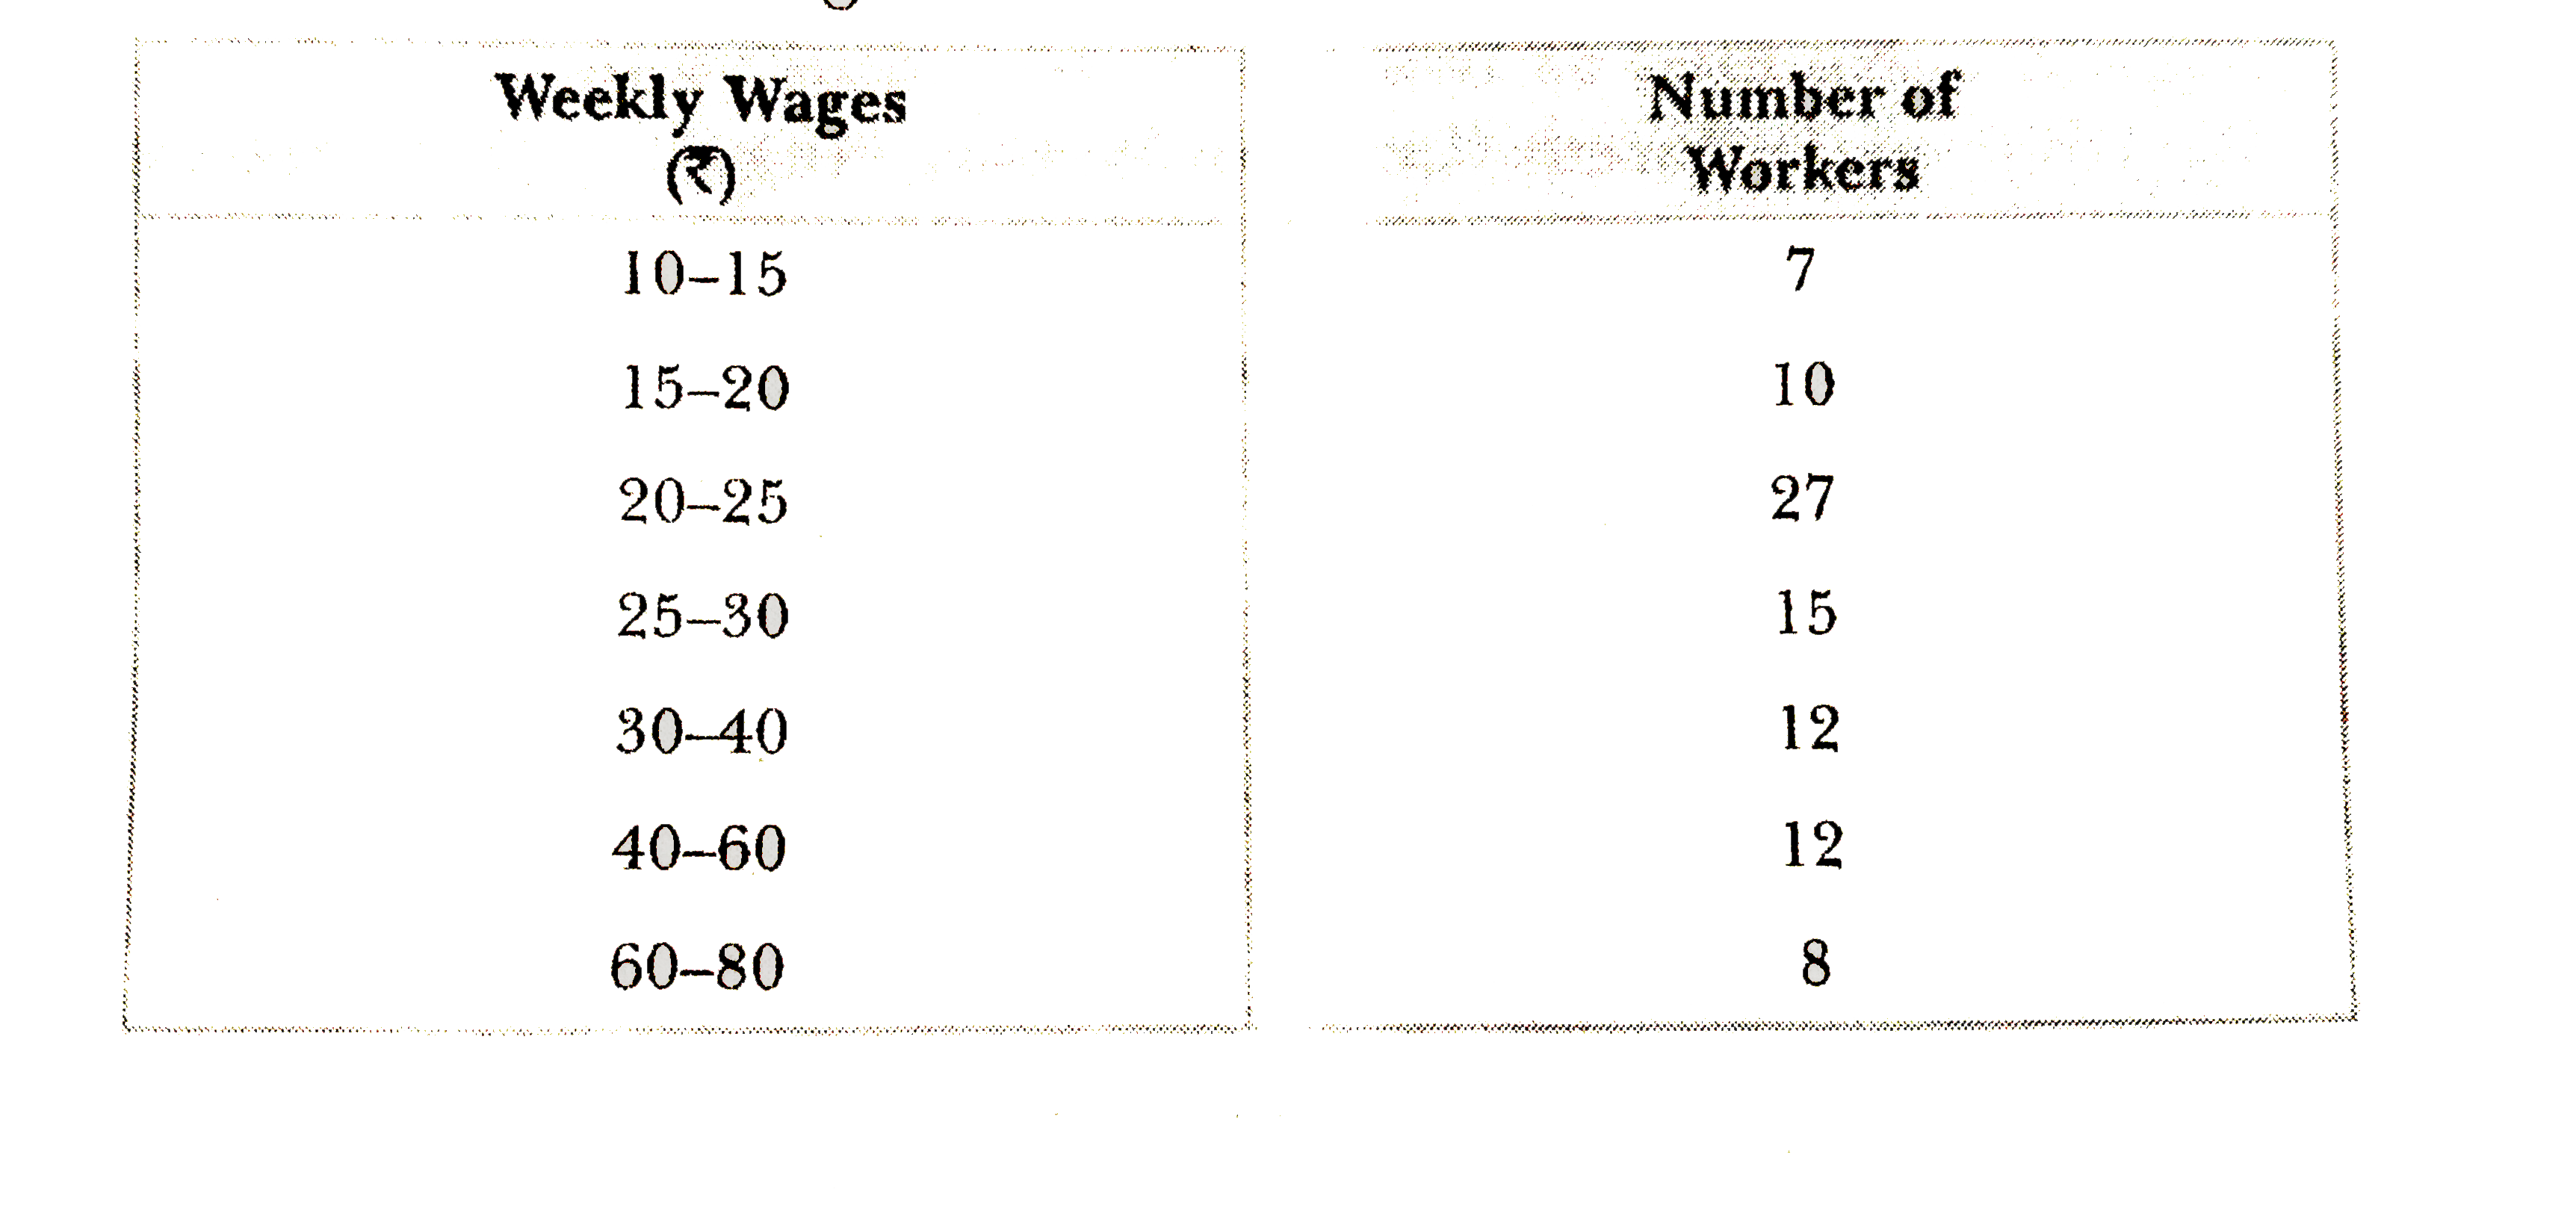
View SolutionPresent the following data in the form of a histogram :

View SolutionFollowing table shows number of students of a college corresponding to different range of marks in Statistics.Make a frequency polygon.

View SolutionPresent the following data in the form of a frequency polygon :

View SolutionMake a frequency curve of the following data :

View SolutionFollowing data relate to the marks secured by students in their Statistics paper. Graph these data in the form of less than ogive and more than ogive.

View Solution
Illustration questions and complete solutions for chapter FREQUENCY DIAGRAMS - HISTOGRAM, POLYGON AND OGIVE of VK GLOBAL PUBLICATION ECONOMICS (HINGLISH) of Class 11