Complete Solutions to EXERCISE of chapter BAR GRAPH of Class 6 book with complete answers and questions
| Class 6 | MATHS |
| Chapter | BAR GRAPH |
| RS AGGARWAL | EXERCISE |
| Number Of Questions | 4 |
| Academic Year | 2023-24 |
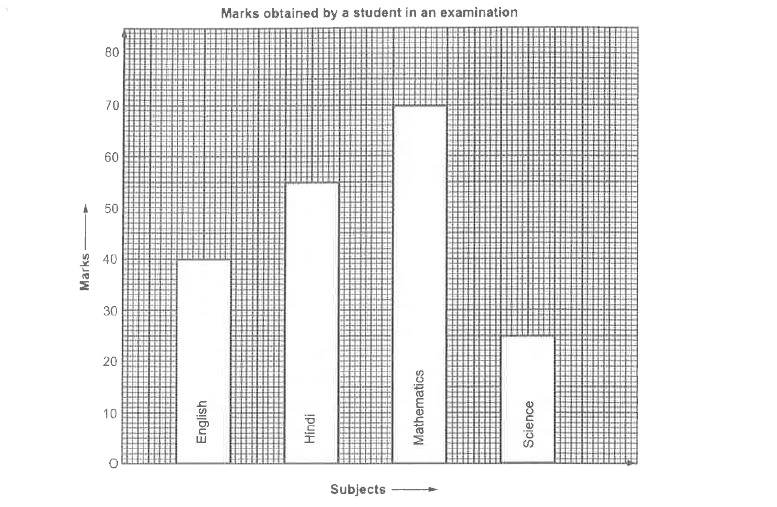
Look at the bar graph given below.

Read if cerefully and answer the questions given below:
What information does the bar graph give ?
In which subject is the student poorest ?
In which subject is the student best ?
In which subjects did he get more than 40 marks ?
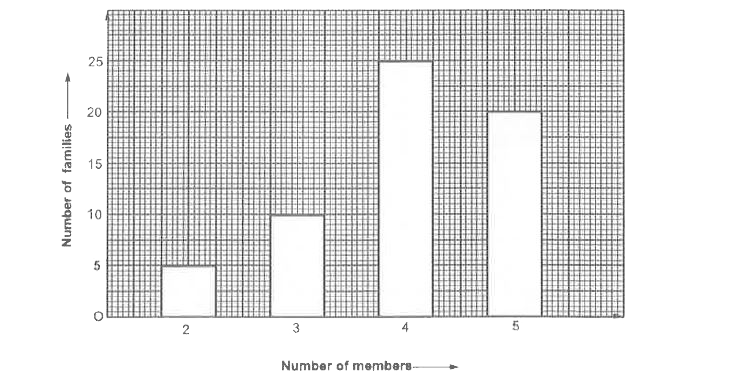
View SolutionIn a survey of 60 families of a colony, the number of members in each family was recorded and the data has been represented by the bar graph given below :

Read the gar graph carefully and answer the fquestion
What information does the bar graph give ?
How many families have 3 members ?
How many coupies have no child ?
Which type of family is the most common ?
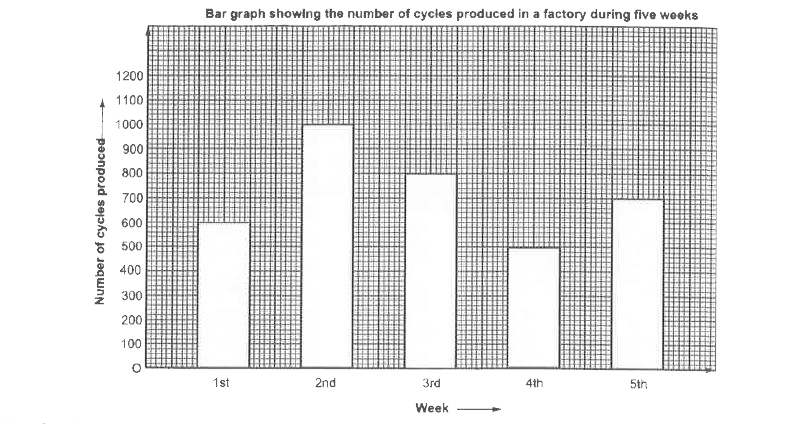
View SolutionLook at the bar graph given below:

Study the bar graph carefully and answer the question given below:
In which week was the production maximum ?
What is the average production during these five weeks ?
How many cycles were produced in the first 3 weeks ?
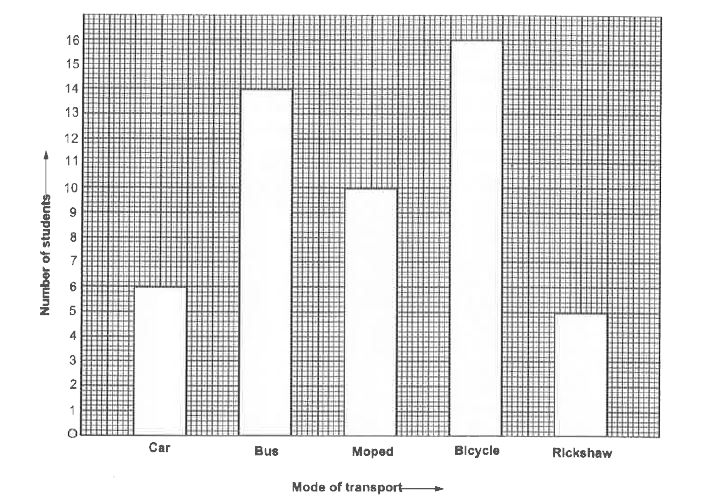
View Solution51 students from a locality use different modes of transport to school, as shown by the bar graph given below:

Look at the bar graph given above and answer the question given below:
What does the above bar graph show ?
Which mode of transport is used by maximum number of students ?
How many students use bus for going to school ?
How many students of the locality do not use bus for going to school ?
View Solution
EXERCISE questions and complete solutions for chapter BAR GRAPH of RS AGGARWAL MATHS (HINGLISH) of Class 6