Complete Solutions to EXERCIES 18.2 of chapter DATA HANDLING AND MEASURES OF CENTRAL TENDENCY of Class 7 book with complete answers and questions
| Class 7 | MATHS |
| Chapter | DATA HANDLING AND MEASURES OF CENTRAL TENDENCY |
| OXFORD SCHOOL EDUCATION | EXERCIES 18.2 |
| Number Of Questions | 16 |
| Academic Year | 2023-24 |
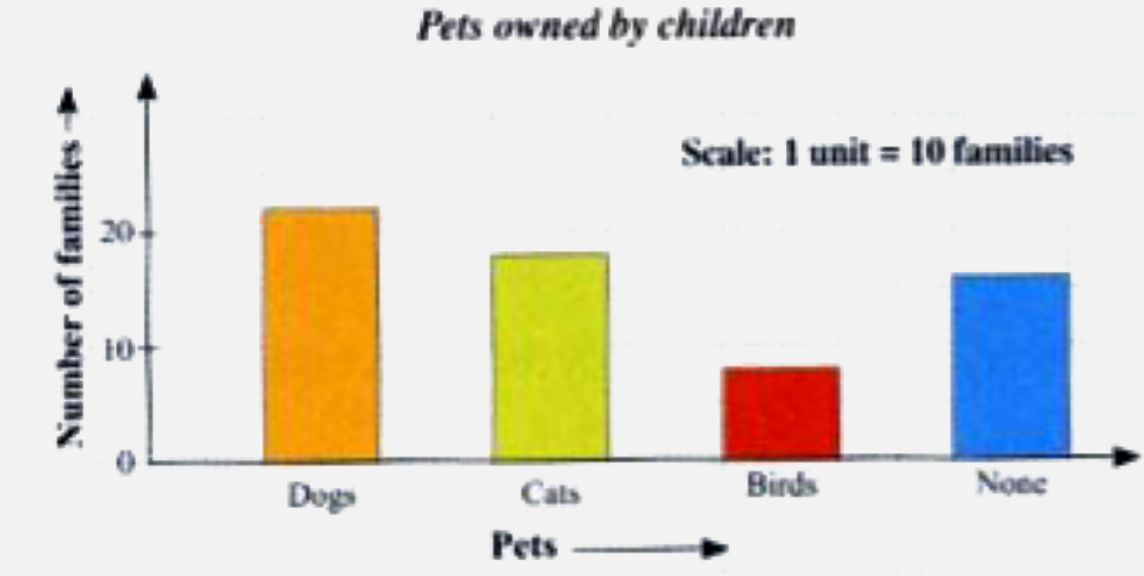
The following bar graph gives the data about the pets owned by families in a colony.

Read the graph and answer the following.
Which is the most common pet in the colony?
View SolutionThe following bar graph gives the data about the pets owned by families in a colony.

Read the graph and answer the following.
Which is the least common pet?
View SolutionThe following bar graph gives the data about the pets owned by families in a colony.

Read the graph and answer the following.
How many families do not have any pets?
View SolutionThe following graph gives the number of times the numbers 1 to 6 show when a die is rolled 40 times.

Read the graph and answer the following.
Which number appears the maximum number of times?
View SolutionThe following graph gives the number of times the numbers 1 to 6 show when a die is rolled 40 times.

Read the graph and answer the following.
Which number(s) appears/appear the least number of times?
View SolutionThe following graph gives the number of times the numbers 1 to 6 show when a die is rolled 40 times.

Read the graph and answer the following.
How many times does the number 4 appear?
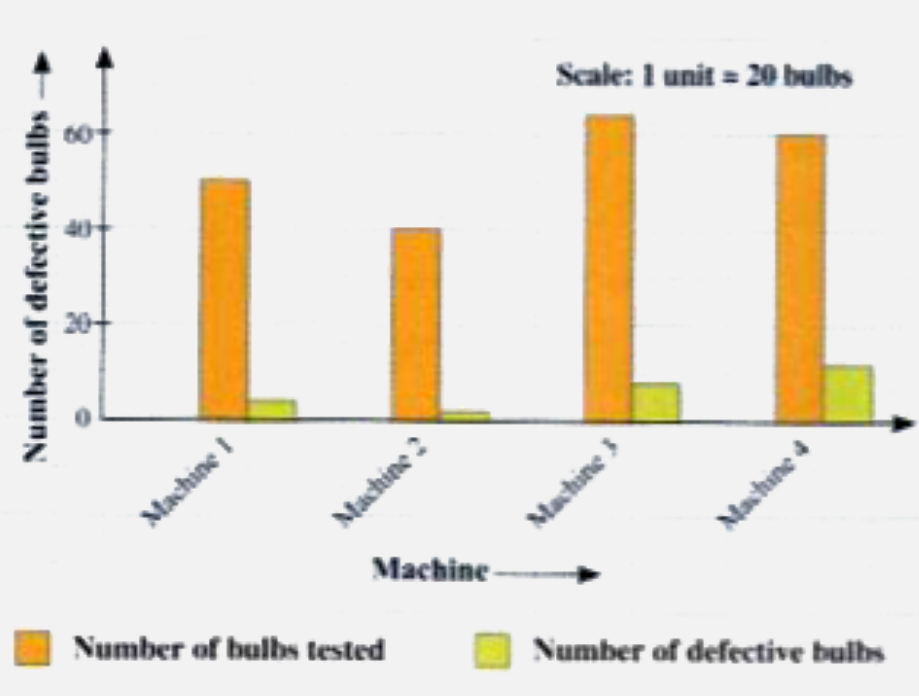
View SolutionA bulb manufacturing company tests the bulbs produced by four different machines. The following graph gives the number of bulbs tested that are produced by each machine and the number that are found to be defective.

Read the graph and answer the following.
What percentage of bulbs produced by each of the four machines is defective
View SolutionA bulb manufacturing company tests the bulbs produced by four different machines. The following graph gives the number of bulbs tested that are produced by each machine and the number that are found to be defective.

Read the graph and answer the following.
Which is the best machine?
View SolutionA bulb manufacturing company tests the bulbs produced by four different machines. The following graph gives the number of bulbs tested that are produced by each machine and the number that are found to be defective.

Read the graph and answer the following.
Which is the worst machined?
View SolutionThe following table gives the height of five trees in a garden.

If the given data has to be represented as a bar graph, then select the most appropriate scale from the given options that can be used to draw the bar graph.
1 unit = 5 trees
View SolutionThe following table gives the height of five trees in a garden.
<
If the given data has to be represented as a bar graph, then select the most appropriate scale from the given options that can be used to draw the bar graph.
1 unit = 1 trees
View SolutionThe following table gives the height of five trees in a garden.

If the given data has to be represented as a bar graph, then select the most appropriate scale from the given options that can be used to draw the bar graph.
1 unit = 20 trees
View SolutionThe following table gives the height of five trees in a garden.

If the given data has to be represented as a bar graph, then select the most appropriate scale from the given options that can be used to draw the bar graph.
1 unit = 8 trees
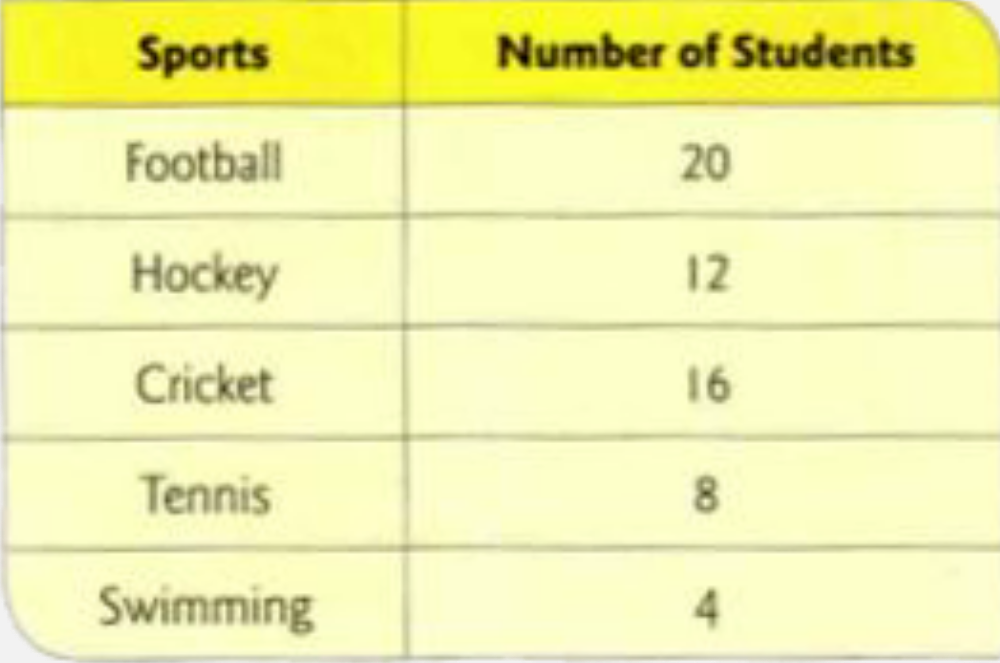
View SolutionFollowing table represents the data collected from a group of children who were asked about their favourite sports. Represent the data as a bar graph.

View SolutionFollowing is a data collected from a survey of a colony about their favourite sports.

Draw a double bar graph choosing appropriate scale
View SolutionFollowing is a data collected from a survey of a colony about their favourite sports.

Draw a double bar graph choosing appropriate scale
View Solution
EXERCIES 18.2 questions and complete solutions for chapter DATA HANDLING AND MEASURES OF CENTRAL TENDENCY of ICSE of Class 7