Complete Solutions to EXAMPLE of chapter DATA HANDLING AND MEASURES OF CENTRAL TENDENCY of Class 7 book with complete answers and questions
| Class 7 | MATHS |
| Chapter | DATA HANDLING AND MEASURES OF CENTRAL TENDENCY |
| OXFORD SCHOOL EDUCATION | EXAMPLE |
| Number Of Questions | 38 |
| Academic Year | 2023-24 |
Thirty students of Class 7 have appeared for a mathematics examinations.
The mathematics teacher Ms Rinku has to keep a record of the marks obtained by each student and prepare the result of each student ? From the given figure, State what are the data collected for each students and how it is useful if you have this figure.
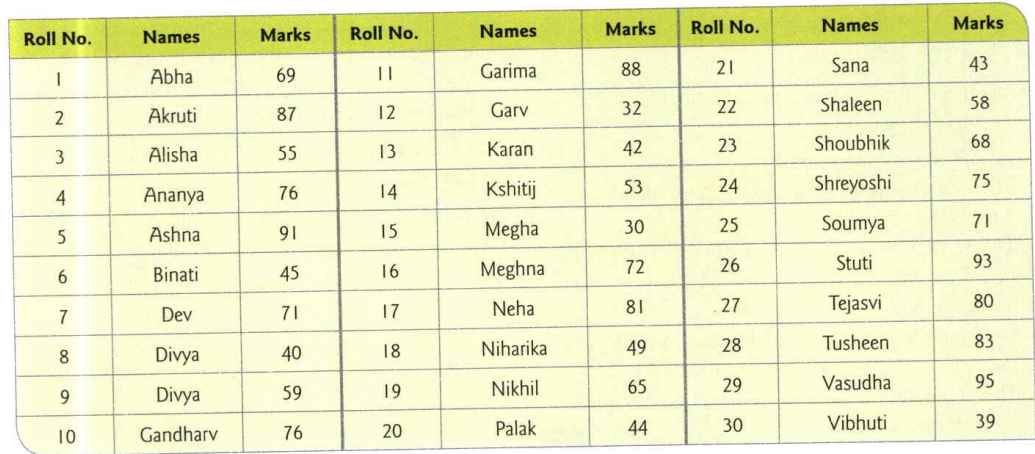
View SolutionThirty students of Class 7 have appeared for a mathematics examinations.
Ms Rinku wants to identify students who can be trained to participate in an inter-school mathematics competition. She also wants to arrange remedial clases for students who were not able to score very well in the examination. From the given figure, state how this organize figure is helpful for Ms Rinku? Can you tell the name and marks of people who were not able to scored very well?
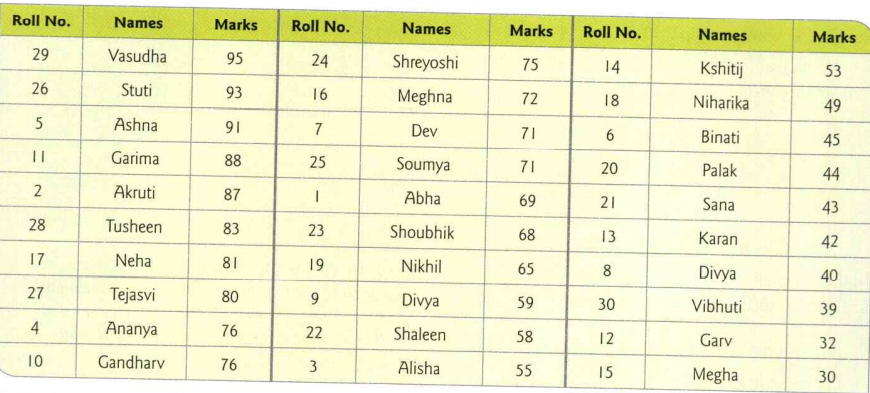
View SolutionThe heights of `8` students in a study group are `180` cm, `160` cm, `175` cm, `165` cm , `178` cm, `170` cm, `174` cm and `182` cm. Find their mean height.
View SolutionMarks of `10` students in an English test are as follow, `9,10,7,11,12,6,8,14,15,18`. Find.
Maximum marks obtained
View SolutionMarks of 10 students in an English test are as follow, 9,10,7,11,12,6,8,14,15,18. Find.
Minimum marks obtained
View SolutionMarks of `10` students in an English test are as follow, `9,10,7,11,12,6,8,14,15,18`. Find.
Range of the marks
View SolutionMarks of `10` students in an English test are as follow, `9,10,7,11,12,6,8,14,15,18`. Find mean marks
View SolutionCreate data of 8 observations with mean 10.
View SolutionThe mean of `5` observations is `8`, Find the sum of the `5` observations.
View SolutionThe mean of `8` numbers is `7`. One more number is added and the mean is still `7`. Find the number that has been added.
View SolutionIf the mean of six consecutive multiples of `4` is `18`, find the sum of `3rd` and `4th` numbers.
View SolutionThe mean of 7 numbers is 12, Four of the 7 numbers are 10,14,15, and 17. The remaining three numbers are in the ratio 1 : 2 : 4. Find these three numbers.
View SolutionFind the median of the data: `24, 36, 46, 17, 18, 25, 35`
View SolutionFind the median of the data: `12,10,14,56,34,20,12,16,31,29`
View SolutionIs median always one of the numbers in a data?
View SolutionCreate a collection of 8 observations with median 12.
View SolutionThe median of a set of eight numbers is `4(1)/(2)`. Given that seven of the numbers are 9,2,3,4,12,13 and 1, find the eight number.
View SolutionA collection of data has 12 observation such that no two observations are equal. The median of this data is 15. One number is added to this data collection. The median of the new data is also 15. Find the number that was added.
View SolutionFind the mode for the data: `1,1,2,4,3,2,1,2,2,4`
View SolutionFind the mode of the following data. `12,14,12,16,15,13,14,18,19,12,14,15,16,15,16,16,15,17,13,16,16,15,15,13,15,17,15,14,15,13,15,14`.
View SolutionFollowing is a data sample in descending order.
If the mean is 18.2 and the mode of this data is 17.5. find the missing numbers. 22.1, 20.9, x , 18.6, y, 17.5 ,13.5
View SolutionThe salaries of 14 employes in a company are as follows.
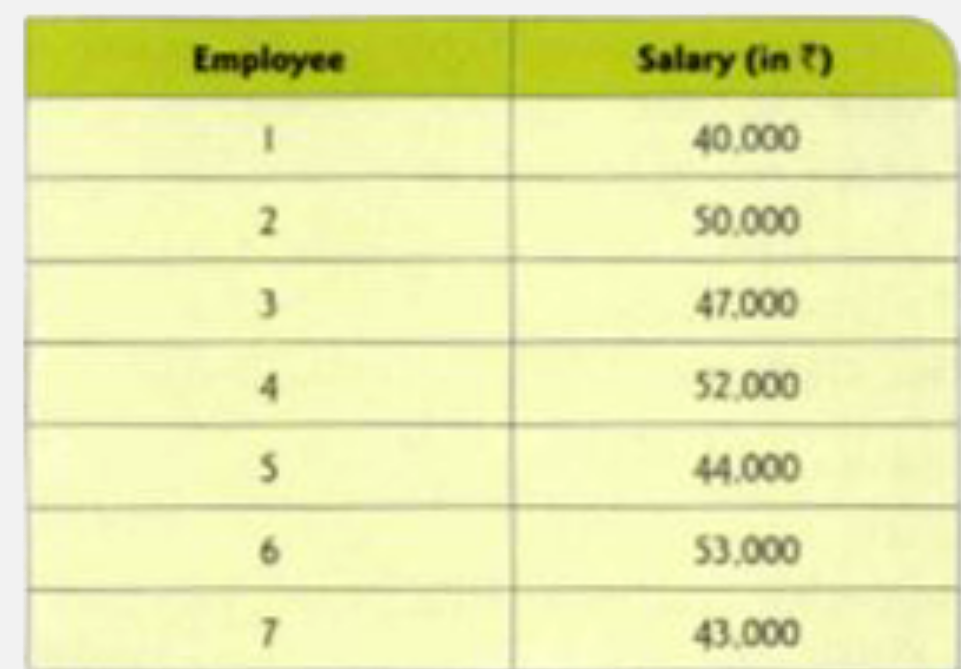
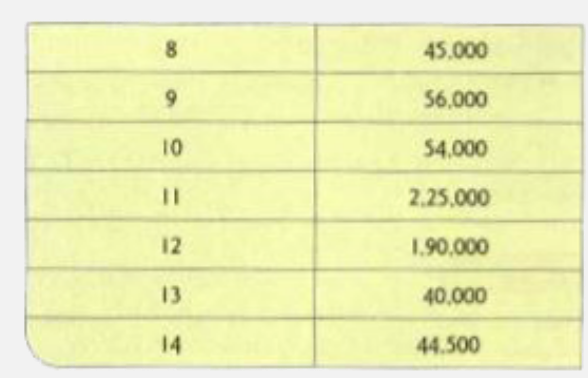
Which central tendency should be used to represent the salaries of the empolyes of the company?
View SolutionA school has to send one team of 8 members to participate in team event in a Mathematics competition. Team A and B want to participate in this competition. The members of both the terms appear for a qualifying test. The marks obtained by the members of the two teams are as follow:
Team A: 76,72,78,82,79,80,77
Team B: 81,73,51,81,56,81,54,83
Which central tendency should the school use to select the team for the competition?

View SolutionThe following table shows the favourite sports of 250 students of a school. Represent the data by a bar graph.
View SolutionThe bar graph given alongside shows the amount of wheat purchased by government during the year 1998-2002.
Read the bar graph and write down your observations. In which year was
(a) the wheat production maximum?
(b) the wheat production minimum?
View SolutionLook at the bar graph given below.
Read it care fully and answer the following questions.
(i) What information does the bar graph give?
(ii) In which subject is the student very good?
(iii) In which subject is the poor? (iv) What is the average of his marks?
View SolutionGiven below is a bar graph showing the heights of five mountain peaks.
Read the bar graph carefully and answer the following questions:
(i) Which is the highest peak and what is its height?
(ii) What is the ratio of the heights of the highest peak and the next highest peak?
(iii) Arrange the heights of the given peaks in descending order.
View SolutionRead the following graph and answer the following question.
What information does the graph represent?
View SolutionRead the following graph and answer the following question.
What are the different sizes of shirts that are sold?
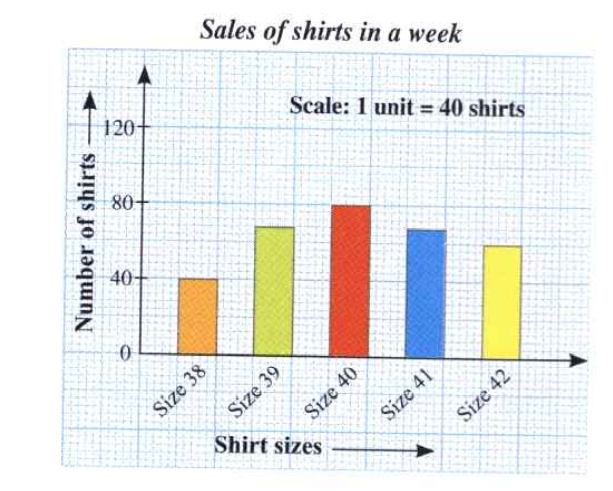
View SolutionHow many shirt of size 40 were sold?

View SolutionRead the following graph and answer the following question.
What is the mode is this data?
View SolutionRead the following graph and answer the following question.
Which shirt size sells the minimum?
View SolutionRead the following graph and answer the following question.
Find the ratio of the number of shirts of size 38 sold to the number of shirts of size 42 sold.
View SolutionThe following graph shows the result of a survey to test water resistant watches made by four different companies. Read the graph and answer the following question.
What is the fraction of the number of watches that leaked to the number testd for each company?
View SolutionThe following graph shows the result of a survey to test water resistant watches made by four different companies. Read the graph and answer the following question.
Which company has the best watches?
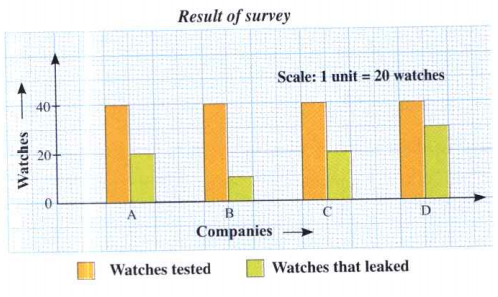
View SolutionThe following graph shows the result of a survey to test water resistant watches made by four different companies. Read the graph and answer the following question.
Which company has the worst watches?

View SolutionThe following graph shows the result of a survey to test water resistant watches made by four different companies. Read the graph and answer the following question.
What percentage of watches of the best company leaked?

View Solution
EXAMPLE questions and complete solutions for chapter DATA HANDLING AND MEASURES OF CENTRAL TENDENCY of ICSE of Class 7