Complete Solutions to TEST YOUR CONCEPTS (VERY SHORT ANSWER TYPE QUESTIONS (SELECT THE CORRECT ALTERNATIVE)) of chapter KINEMATICS of Class 7 book with complete answers and questions
| Class 7 | PHYSICS |
| Chapter | KINEMATICS |
| PEARSON IIT JEE FOUNDATION | TEST YOUR CONCEPTS (VERY SHORT ANSWER TYPE QUESTIONS (SELECT THE CORRECT ALTERNATIVE)) |
| Number Of Questions | 21 |
| Academic Year | 2023-24 |
Choose the correct statement:
02:18View SolutionThe ratio of unit of acceleration and velocity gives unit of the physical quantity
01:52View SolutionUnit of speed is ____
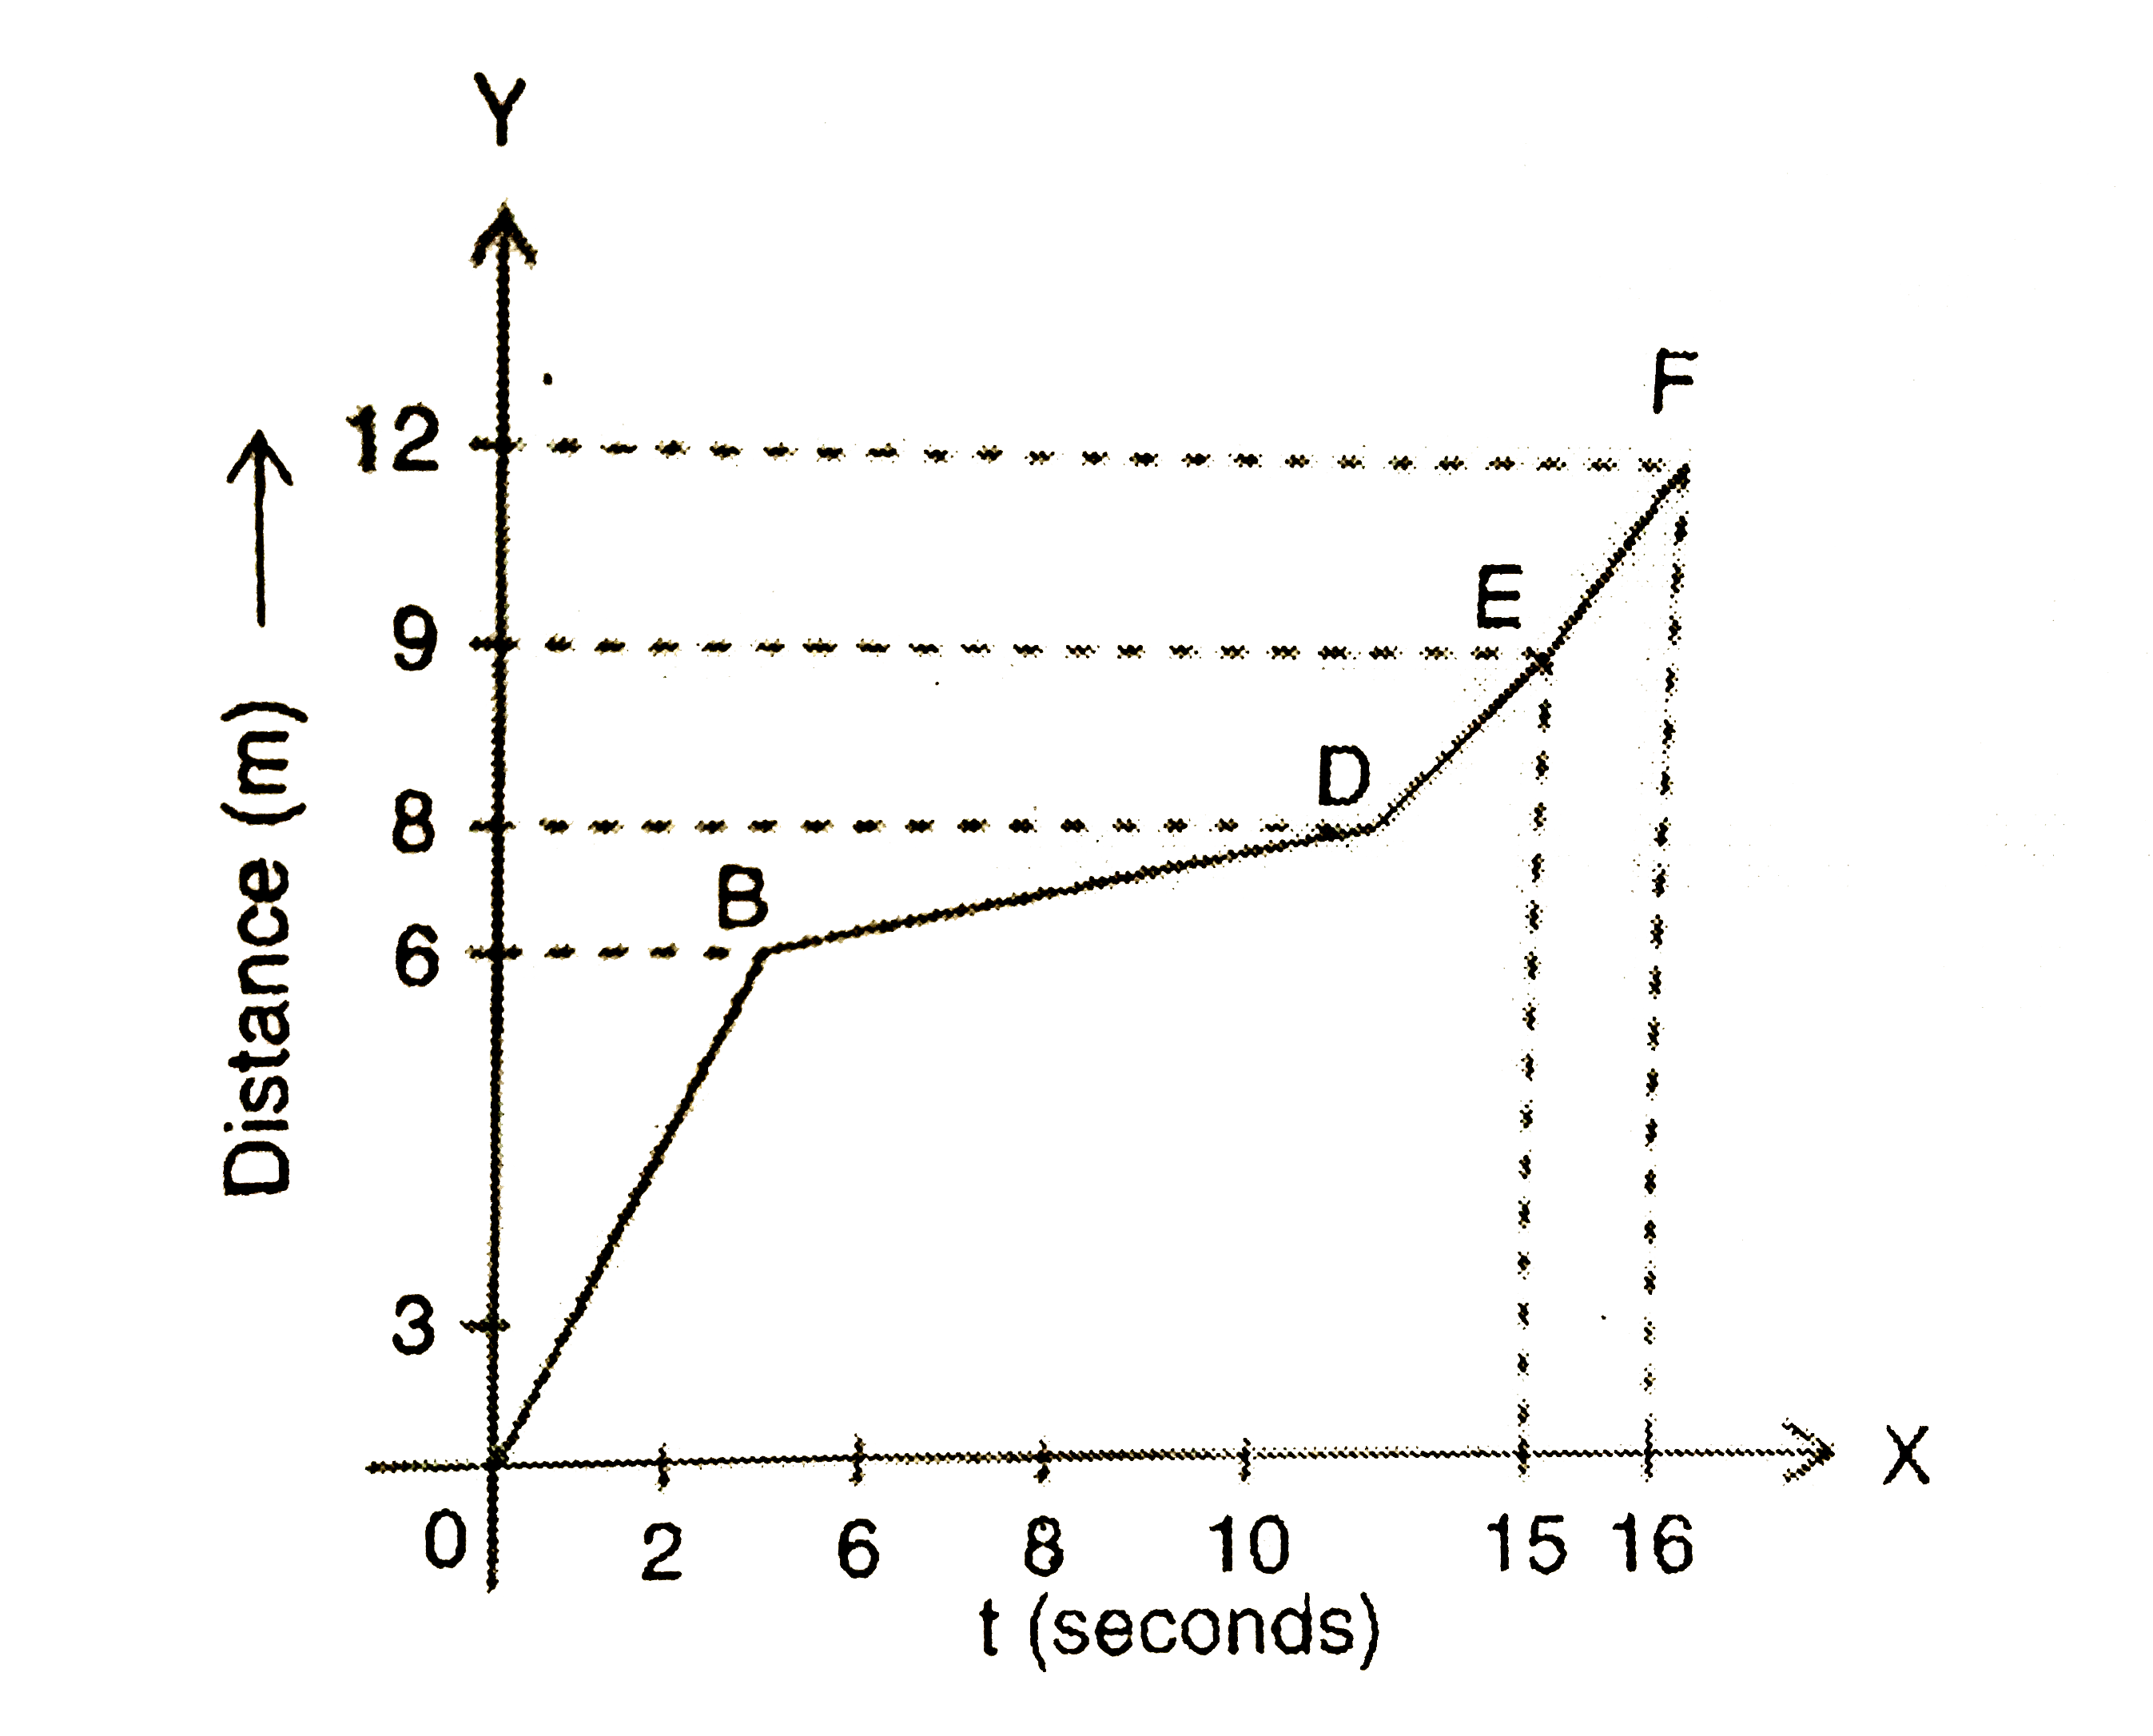
02:24View SolutionThe motion of a body is depicted graphically as shown in the figure, then the average speed of the body is _____ ` ms^(-1)`.
 01:36View Solution
The speed of the tip of a second hand of length 5 cm of a clock is ____ `ms^(-1)`
04:15View SolutionThe time period of a pendulum is independent of ______
02:15View SolutionThe distance between two stations is 20 km. If a train moves with a constant speed of 60 km `h^(-1)`, then the time taken by the train to reach the next station is _____.
01:04View SolutionThe distance -time graph of an object is a straight line parallel to the time axis , then the object is _____.
02:57View SolutionA car moves with a speed of 60 km `h^(-1)` for 20 min and then at a speed of 30 km `h^(-1)` for the next 20 min. The total distance covered by the car is _____ km.
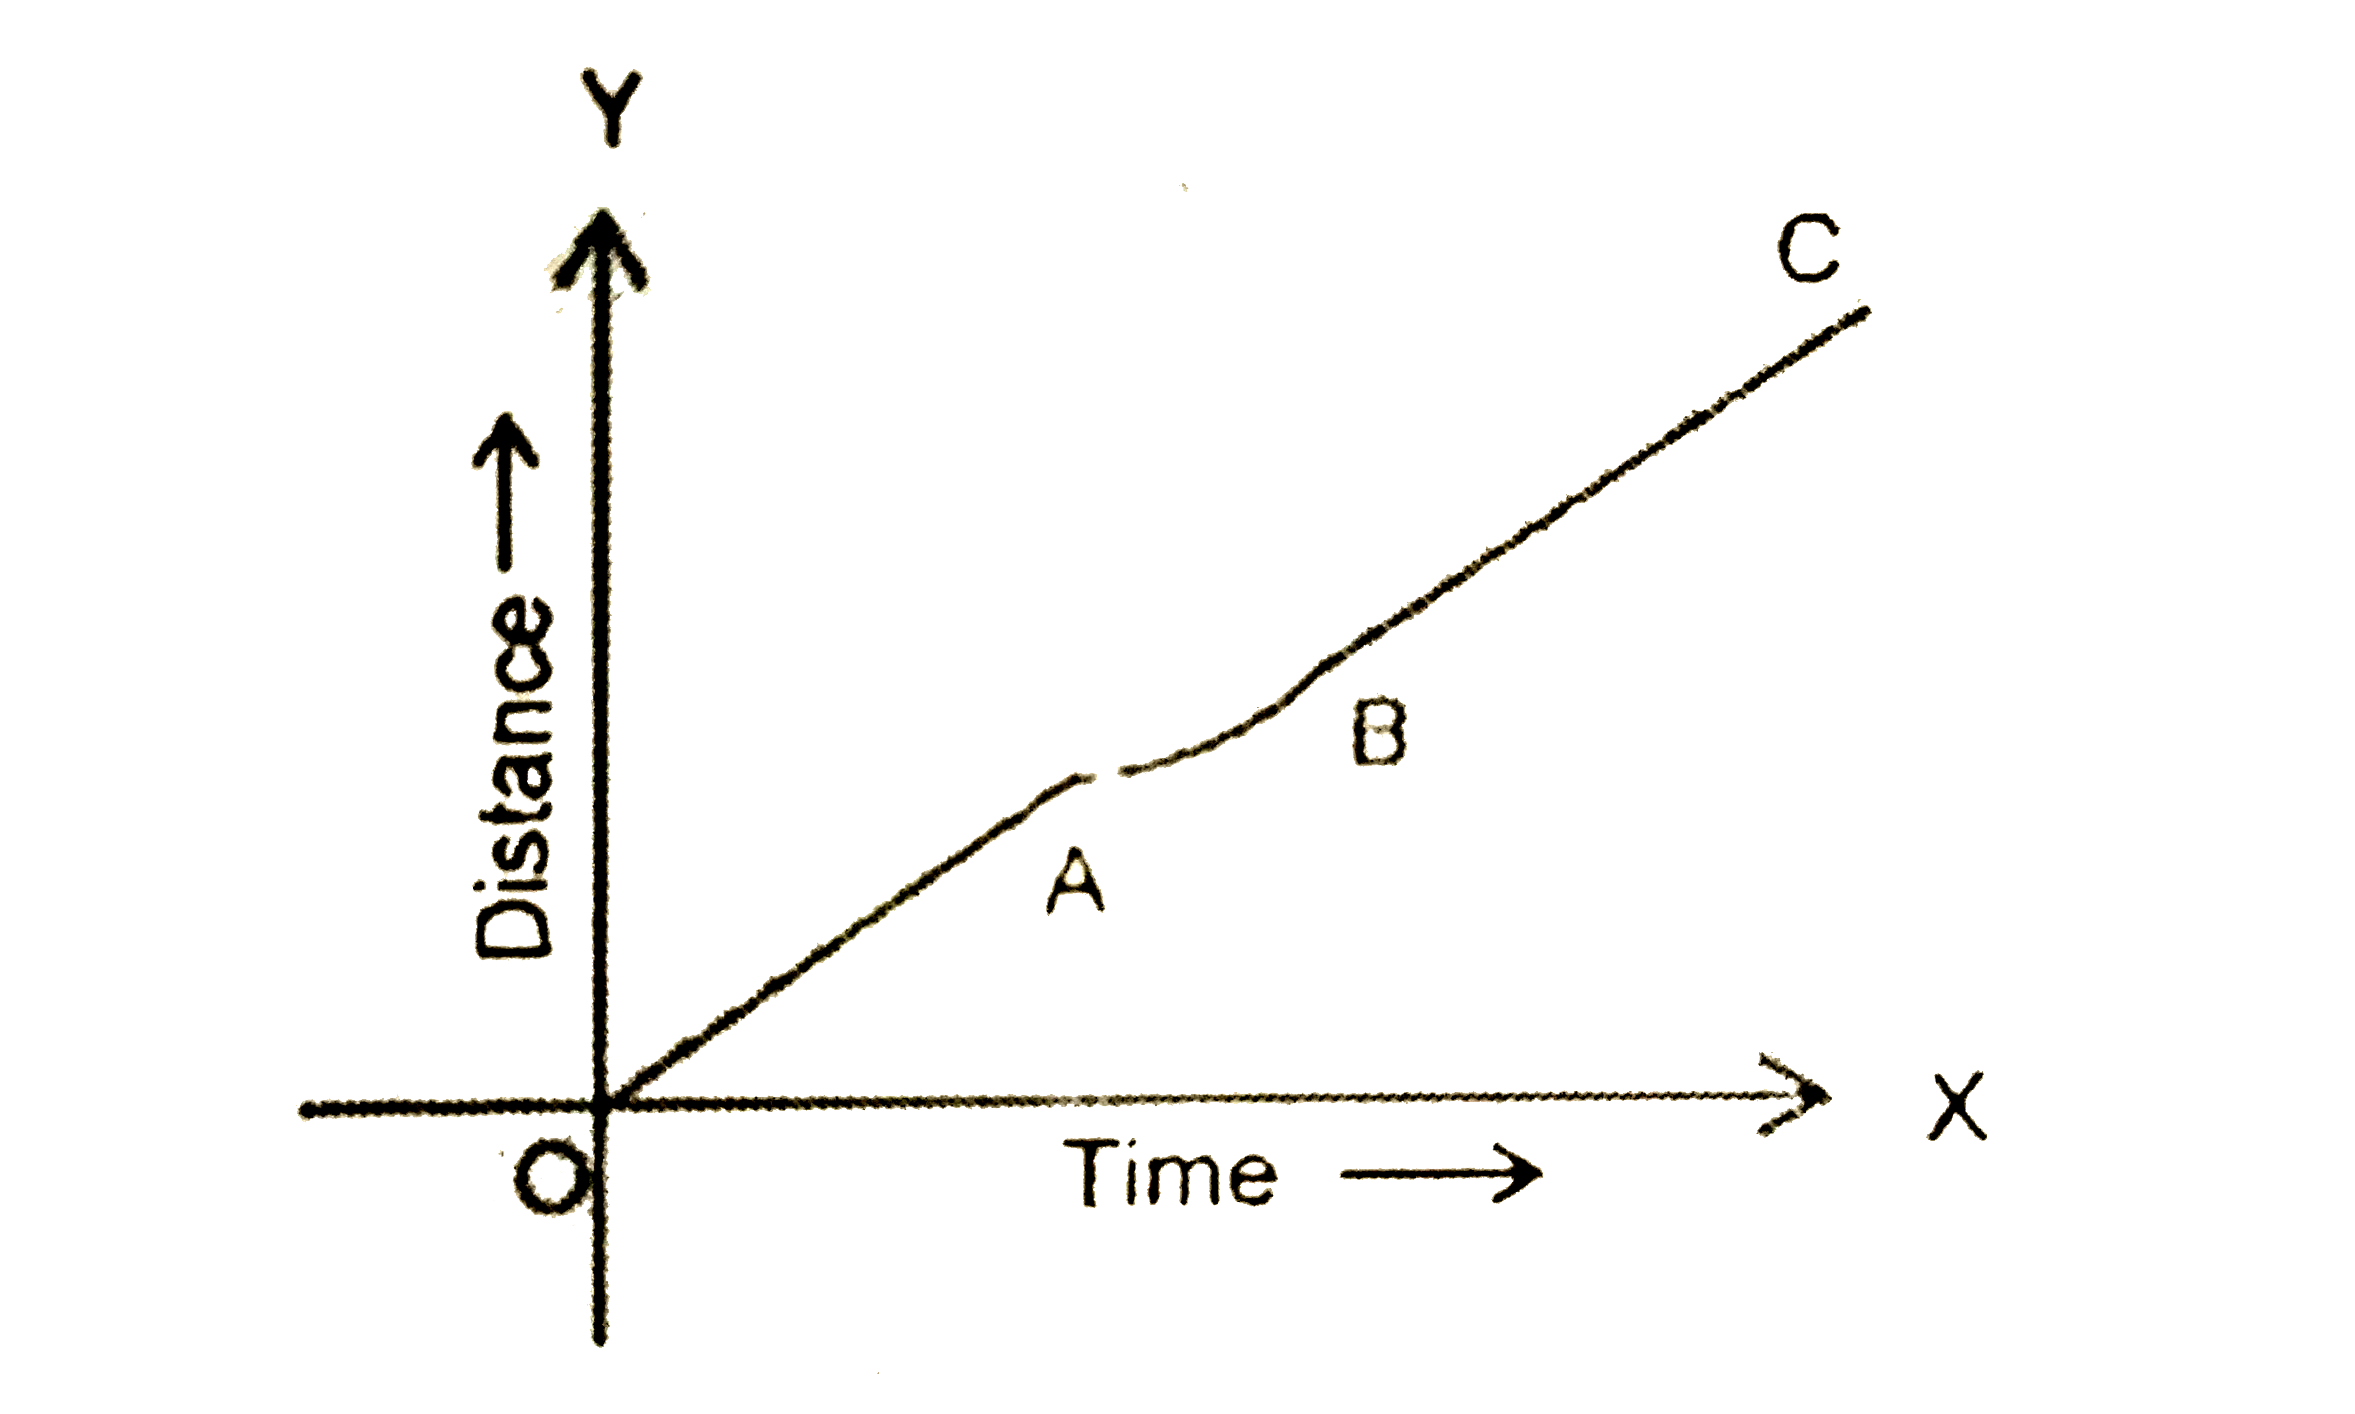
View SolutionThe distance- time graph of a body is as shown in the figure. The part of the graph that represent the unifrom speed of the body is
 01:31View Solution
A body moves with a uniform speed of 10 km `h^(-1)` for 2 h. The average speed of the body is ______ km `h^(-1)`.
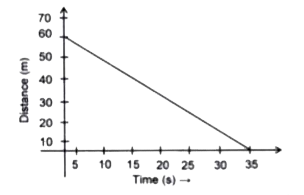
01:28View SolutionThe distance-time graph of a moving vehicle is as shown in the figure.
 02:00View Solution
`1kmh^(-1)` = _______ `ms^(-1)`.
01:24View SolutionChoose the correct statement(s).
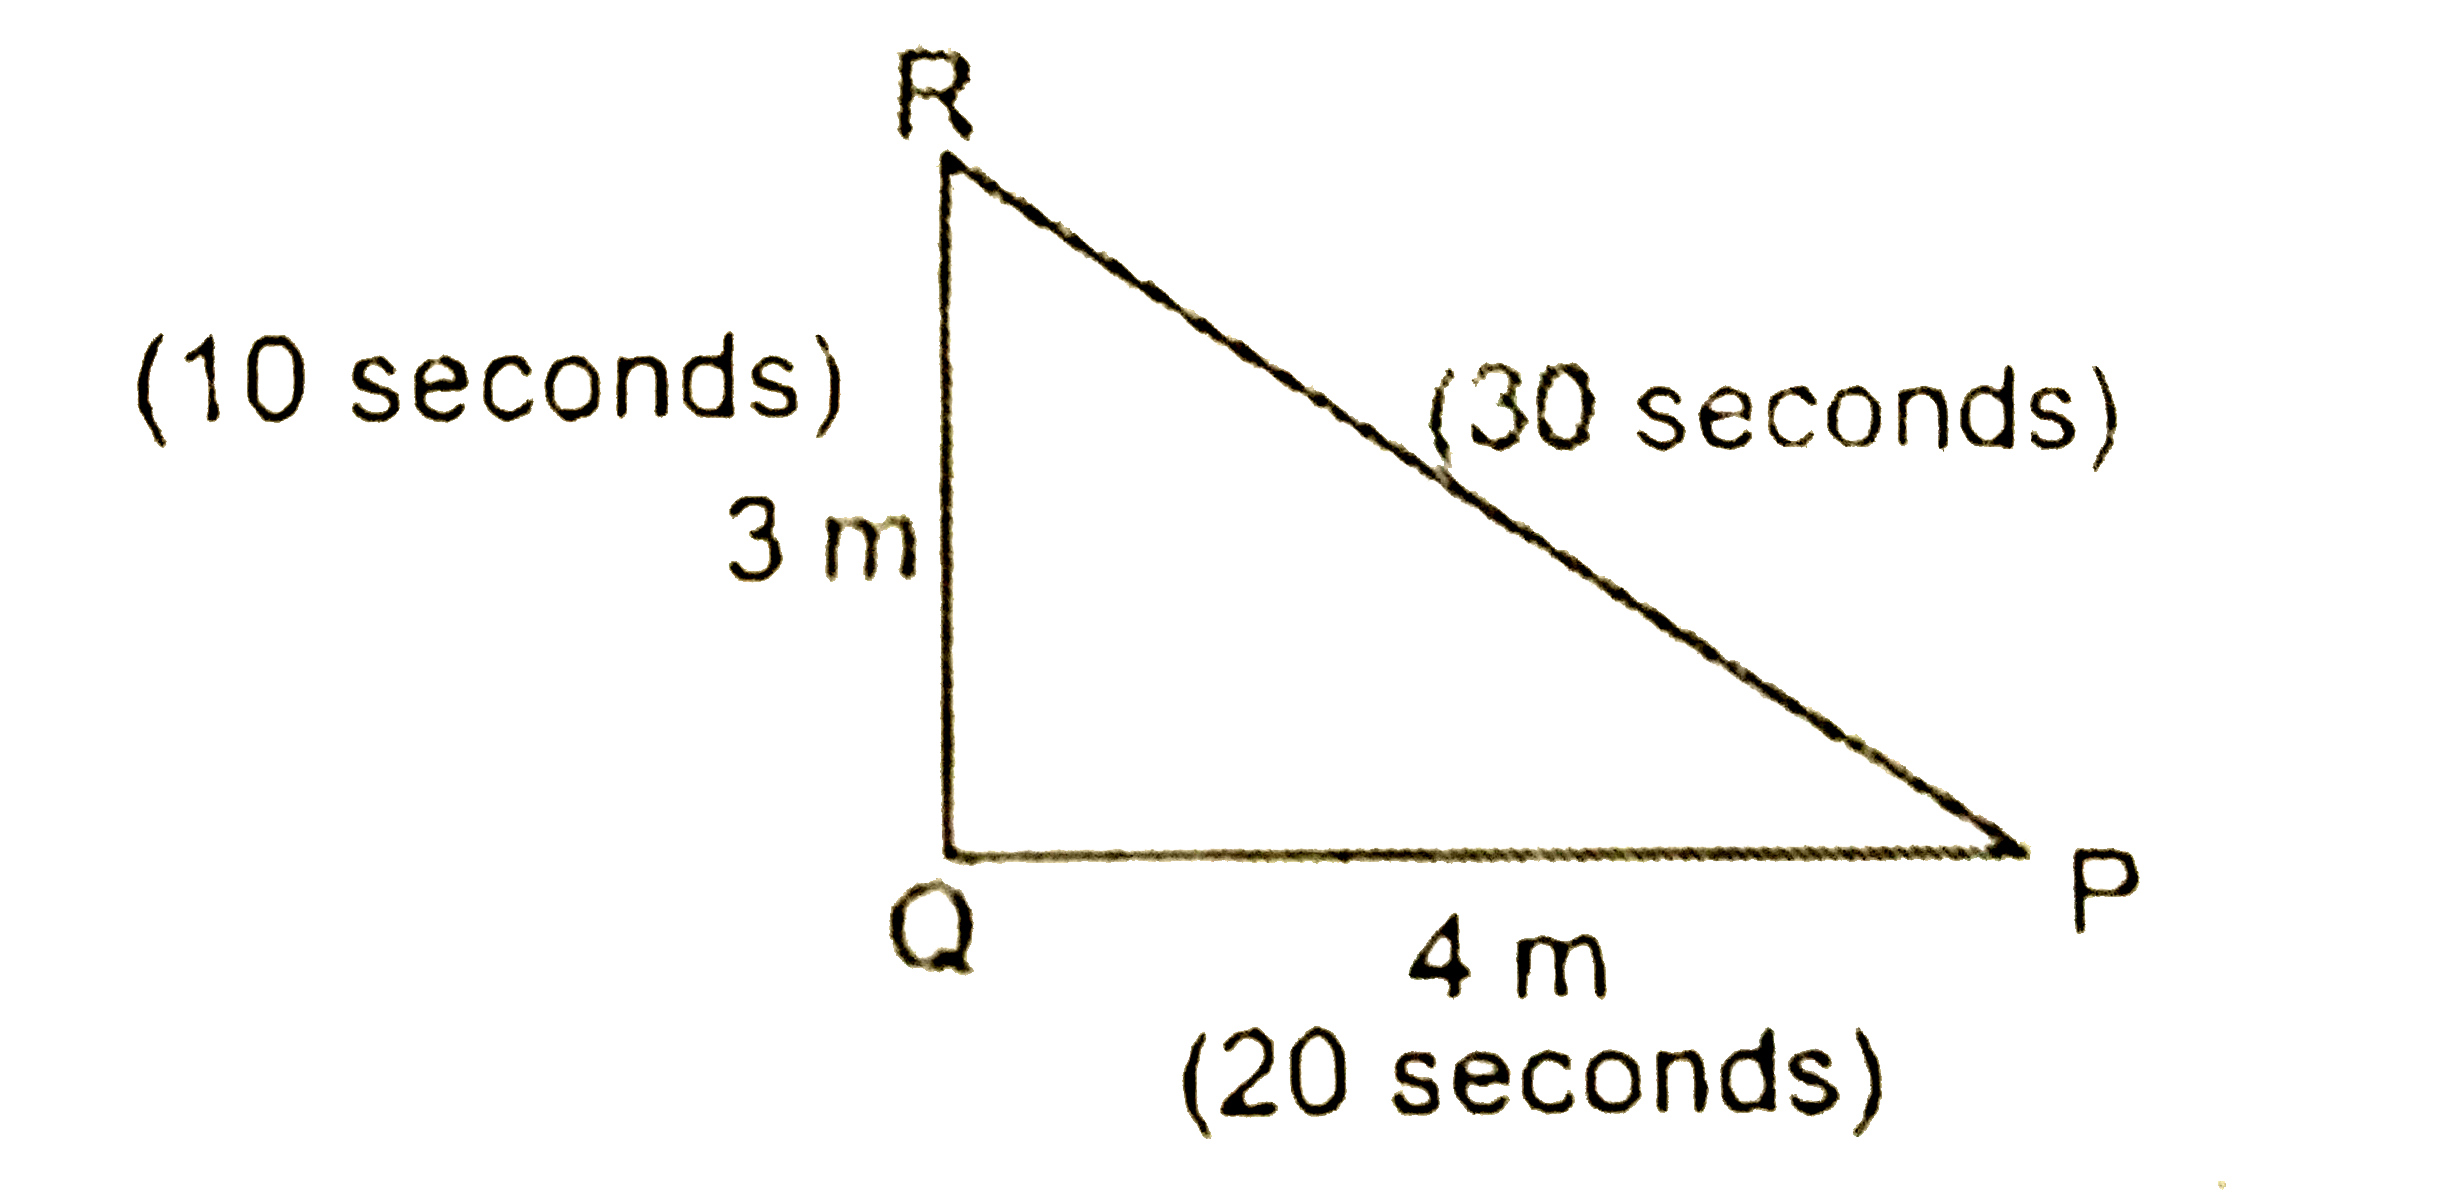
02:23View SolutionA person starts from a point P and travels along a path PQRS as shown in the figure, then speed of the person is _____ `ms^(-1)`
 03:58View Solution
A simple pendulum was given to a physics student to determine its time period. Arrange the following steps in sequential order to determine its time period.
(A). Calculate the radius of the bob 'R' by divding the diameter by 2.
(B) Take a metre scale and measure the length of the string from the point of suspension to the lower tip of the bob `(l_(1))`
(C). Place the bob over a meter scale and hold it in postion with two wooden blocks of stiff cadboards. Measure the diamter (D)of the bob.
(D). NOW, the length of the pendulum `(l)` is given by ` (l_(1) -R)`
E. Consider the formula ` T= 2pi. sqrt(l/g)` calculate.
The time period of the simple pendulum.05:29View SolutionA body cover 20 m in 2 s and another 20 m in next 4s. Arrange the following steps in sequential order to find th average velocity of the body .
(A) Find the displacements of the body in first 2s and next 4 s from the given data.
(B) find the displacements of the body .
(C) find the total time taken by the body to complete the total displacement .
(D) Use the formula, average velocity = `("total displacement")/(" Total time taken")`02:50View SolutionIn the case of a simple pendulum, a graph is drawn between the displacement and time taken for its oscillations as shown in the figure. Then
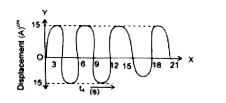
Time period of the pendulum bob is ______ s.01:37View SolutionIn the case of a simple pendulum, a graph is drawn between the displacement and time taken for its oscillations as shown in the figure. Then
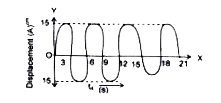
The number of oscillations completed by the bob in one second is ______.01:38View SolutionIn the case of a simple pendulum, a graph is drawn between the displacement and time taken for its oscillations as shown in the figure. Then
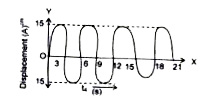
The amplitude of oscillation of the pendulum bob is _____ cm.01:41View SolutionIn the case of a simple pendulum, a graph is drawn between the displacement and time taken for its oscillations as shown in the figure. Then
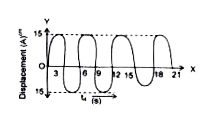
From the given figure the number of oscillations per-formed by the bob at the end of 21 s is ______.02:21View Solution
TEST YOUR CONCEPTS (VERY SHORT ANSWER TYPE QUESTIONS (SELECT THE CORRECT ALTERNATIVE)) questions and complete solutions for chapter KINEMATICS of PEARSON IIT JEE FOUNDATION of Class 7
All Exercises from PEARSON IIT JEE FOUNDATION Class 7 PHYSICS KINEMATICS
- ASSESSMENT TEST (TEST 1 (SELECT THE CORRECT ALTERNATIVE)
- ASSESSMENT TEST (TEST 2 (SELECT THE CORRECT ALTERNATIVE)
- CONCEPT APPLICATION (LEVEL 1 (FILL IN THE BLANKS))
- CONCEPT APPLICATION (LEVEL 1 (MATCH THE COLUMN))
- CONCEPT APPLICATION (LEVEL 1 (SELECT THE CORRECT ALTERNATIVE))
- CONCEPT APPLICATION (LEVEL 1 (TRUE OR FALSE))
- CONCEPT APPLICATION (LEVEL 2 (SELECT THE CORRECT ALTERNATIVE))
- CONCEPT APPLICATION (LEVEL 3)
- fill in the blanks
- Level 1
- Level 1 macth
- Level 1 MCQ
- Level 2
- Level 2 MCQ
- Level 3
- match
- MCQ
- Test 1
- TEST YOUR CONCEPTS (ESSAY TYPE QUESTIONS)
- TEST YOUR CONCEPTS (SHORT ANSWER TYPE QUESTIONS)
- TEST YOUR CONCEPTS (VERY SHORT ANSWER TYPE QUESTIONS (ANSWER THE FOLLOWING QUESTIONS))
- TEST YOUR CONCEPTS (VERY SHORT ANSWER TYPE QUESTIONS (FILL IN THE BLANKS))
- TEST YOUR CONCEPTS (VERY SHORT ANSWER TYPE QUESTIONS (MATCH THE COLUMN))
- TEST YOUR CONCEPTS (VERY SHORT ANSWER TYPE QUESTIONS (SELECT THE CORRECT ALTERNATIVE))
