Complete Solutions to Example of chapter LINE GRAPHS AND LINEAR GRAPHS of Class 8 book with complete answers and questions
| Class 8 | MATHS |
| Chapter | LINE GRAPHS AND LINEAR GRAPHS |
| RS AGGARWAL | Example |
| Number Of Questions | 11 |
| Academic Year | 2023-24 |
The following table gives the growth chart of a child.

Draw a line graph for the above data and answer the questions that follow :
`(i)` What was the height of the child at the age of `5` years ?
`(ii)` How much taller was the child at the age of `10` than at the age of `6` ?
`(iii)` Between which two consecutive periods did the child grow faster ?05:50View SolutionThe table given below shows the data collected for Tanvy's walking on a road.

Draw a line graph for the given data using a suitable scale and answer the questions given below :
`(i)` In what time periods did Tanvy make the most progress ?
`(ii)` What is the ratio of the total distance covered in `15` minutes to that covered in `25` minutes ?
`(iii)` What is the percentage increase in distance covered in `15` minutes as compared to that in `10` minutes ?07:48View SolutionThe table given below shows the population (in thousands) of men and women in a village in different years.

Draw two line graphs for the above data, using a suitable scale and answer the questions given below :
`(i)` Find the ratio of the male population and female population in the year `2013`.
`(ii)` Find the ratio of the total population of the village in `2015` to that in `2017`.
`(iii)` Find the percentage increase in the population of women in `2017` as compared to that in `2014`
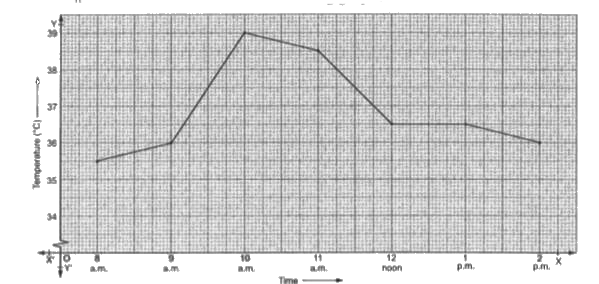
`(iv)` Between which two years in the increase `%` in the number of men maximum?13:03View SolutionWhen Reenu fell sick, her doctor maintained a record of her body temperature taken every hour, as shown in the following graph.

Read the graph carefully and answer the questions given below :
`(i)` What was the patient's temperature at `12` noon ?
`(ii)` When was the patient's temperature `38.5 "^(@)C` ?
`(iii)` What was the patient's temperature at `12.30` p.m. ? Why ?
`(iv)` During which period of time did the patient's temperature show an upward trend ?
`(v)` The patient's temperature was the same two times during the given period. What were these two times ?03:23View SolutionThe graph given below shows the journey of a man who started from his home and returned at the end of the day. Study the graph carefully and answer the questions that follow.

`(i)` At what time did the man start from his home ?
`(ii)` How much distance did he cover in the first four hours of his journey ?
`(iii)` What was he doing from `3` p.m. to `5` p.m. ?
`(iv)` What was the total distance travelled by him during the day ?
`(v)` How much distance did he travel in the first `8` hours of his journey ?
`(vi)` By what time could he cover `16` km of his journey ?
`(vii)` At what time did he return home ?
`(viii)` Calculate the average speed of the man from `(a)` A to B and `(b)` B to C .05:18View SolutionThe double line graph given below gives the actual and expected sales of cars of a company for six months. Study the graph and answer the questions that follow :

`(i)` In which month was the actual sale same as the expected sale ?
`(ii)` For which month was the difference between the actual and expected sales the maximum ?
`(iii)` For which month was the difference in actual and expected sales the least ?
`(iv)` What was the total sales of cars in the months of January. February and March ?
`(v)` What is the average sales of cars in the last `3` months ?
`(vi)` Find the ratio of sales in the first `3` months to that in the last `3` month?04:14View SolutionThe double line graph given below shows the marks obtained out of `10` by Madhu in two different tests. Study the graph and answer the questions that follow :

`(i)` What information is represented by the axes ?
`(ii)` In which subject did she score the highest in Test `I` ?
`(iii)` In which subject did she score the least in Test `II` ?
`(iv)` What are the marks scored by her in social science in Test `II` ?
`(v)` In which test was the performance better ?
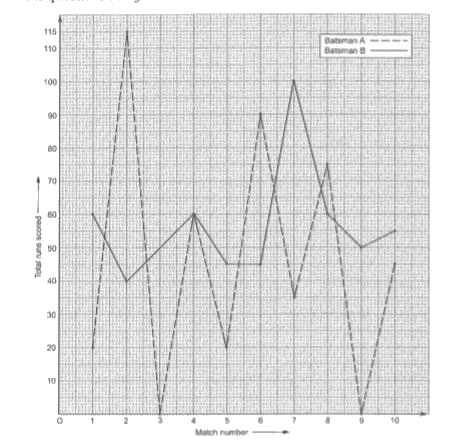
`(vi)` In which subject and which test did she score full marks ?05:09View SolutionThe given graph represents the total runs scored by two batsmen A and B durin each of the ten different matches in the year `2017`. Study the graph and answer the questions that follow :

`(i)` What information is given on the two axes in the given graph ?
`(ii)` In which two matches did batsman B score the same number of runs ?
`(iii)` Were the runds scored by the two batsmen same in any of the matches ? If so , in which match?
`(iv)` Among the two batsmen, who is steadier ? How do you judge it ?06:32View SolutionInterest on deposits for a year.
(i) Does the graph pass through the origin?
(ii) Use the graph to find the interest on rupes 2500 for a year.
(iii) To get an interest of rupes 280 per year, how much money should be deposited?
 04:31View Solution
Plot a line graph for the variables `x` and `y` , where `y` is three times `x`, i.e. the equation is `y=3x`.
Using the graph , find the value of
`(i) y`, when `x=5` `(ii) x`, when `y=18`03:00View SolutionThe following is the conversion graph of temperature in `"^(@)C` and `"^(@)F`.

Use the graph to answer the questions given below :
`(i)` Convert `140^(@)F` to `"^(@)C`.
`(ii)` Convert `20^(@)C` to `"^(@)F`.01:17View Solution
Example questions and complete solutions for chapter LINE GRAPHS AND LINEAR GRAPHS of RS AGGARWAL MATHS (HINGLISH) of Class 8
