The table given below shows the population (in thousands) of men and women in a village in different years.

Draw two line graphs for the above data, using a suitable scale and answer the questions given below :
(i) Find the ratio of the male population and female population in the year 2013.
(ii) Find the ratio of the total population of the village in 2015 to that in 2017.
(iii) Find the percentage increase in the population of women in 2017 as compared to that in 2014
(iv) Between which two years in the increase % in the number of men maximum?
Step by step video & image solution for The table given below shows the population (in thousands) of men and women in a village in different years. Draw two line graphs for the above data, using a suitable scale and answer the questions given below : (i) Find the ratio of the male population and female population in the year 2013. (ii) Find the ratio of the total population of the village in 2015 to that in 2017. (iii) Find the percentage increase in the population of women in 2017 as compared to that in 2014 (iv) Between which two years in the increase % in the number of men maximum? by Maths experts to help you in doubts & scoring excellent marks in Class 8 exams.
Updated on:21/07/2023Topper's Solved these Questions
- LINE GRAPHS AND LINEAR GRAPHSBOOK - RS AGGARWALCHAPTER - LINE GRAPHS AND LINEAR GRAPHSEXERCISE - Exercise 23
25 Videos
- INTRODUCTION TO COORDINATE GEOMETRYBOOK - RS AGGARWALCHAPTER - INTRODUCTION TO COORDINATE GEOMETRYEXERCISE - EXERCISE B (OBJECTIVE QUESTIONS)
7 Videos
- LINEAR EQUATIONSBOOK - RS AGGARWALCHAPTER - LINEAR EQUATIONSEXERCISE - TEST PAPER-8 (D) (Write .T. for true and .F. for false for each of the following:)
1 Video
Similar Questions
Knowledge Check
The female population of a village is 15392. The male population is 540 more than the female population. The total population of the village is
A15932B31324C30324D32324Average ratio of men and women in human population is :
A1:1B1:2C3:4D3:596% of the population of a village is 23040. The total population of the village is…
A32256B24000C24936D25640
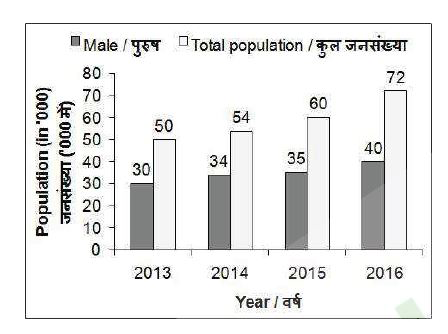
The bar graph given below represents the total propulation and male population (in 000) of a city, during the period of 2013 to 2016.

What is the ratio of male and female population respectively in 2015?
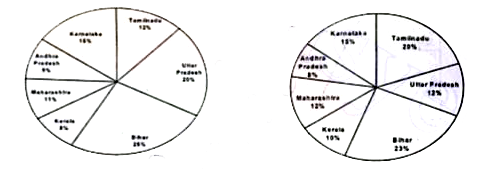
View SolutionRead the following pie-chart carefully and answer the questions given below:
Population of two states in two years
Total population in 2008 = 25 lacs Total population in 2009 = 28 lacs

What is total population of Uttar Pradesh in 2008 and 2009 ?
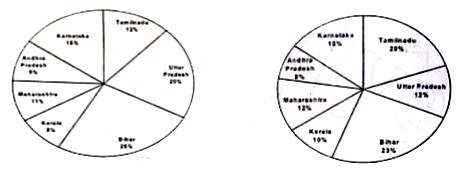
View SolutionRead the following pie-chart carefully and answer the questions given below:
Population of two states in two years
Total population in 2008 = 25 lacs Total population in 2009 = 28 lacs

What is the respective ratio of population of Tamilnadu in 2008 to that of Maharashtra in 2009 ?
View SolutionThe table given below shows number of literate people and total population in a village from the year 2011 to 2016.

What is the percentage increase in the literate people in the year 2015 in comparison to year 2014?
View SolutionIf population of women in a village is 90% of population of men. what is the population of men as a percentage of population of women?
View Solution
