Complete Solutions to Exercise 23 of chapter LINE GRAPHS AND LINEAR GRAPHS of Class 8 book with complete answers and questions
| Class 8 | MATHS |
| Chapter | LINE GRAPHS AND LINEAR GRAPHS |
| RS AGGARWAL | Exercise 23 |
| Number Of Questions | 25 |
| Academic Year | 2023-24 |
The following table depicts the maximum temperature on the seven days of a particular week. Study the table and draw a line graph for the same.

View SolutionConsider the following input/output table. Draw a line graph for it.

Now, use the graph drawn to predict the outputs for the inputs of `3` and `8`.
View SolutionThe table given below depicts the annual gross profit of a company for a period of `5` years . Study the table and draw a line graph for the same .

View SolutionAjita starts off from home at 07.00 hours with her father on a scooter that goes at a uniform speed of 30 km/h and drops her at her school after half an hour. She stays in the school till 13.30 hours and takes an auto rickshaw to return home. The rickshaw has a uniform speed of 10 km/h. Draw the graph for the above situation and also determine the distance of Ajita’s school from her house.
View SolutionThe following table shows the percentage of students who dropped out of school after completing high school.

Study the above table carefully and draw a line graph to depict it.
View SolutionThe following chart gives the growth in height in terms of percentage of full height of boys and girls with their respective ages.

Draw the line graph of above data on the same sheet and answer the following questions.
(a) In which year both the boys and the girls achieve their maximum height?
(b) Who grows faster at puberty (14 years to 16 years of age)?
View SolutionA car is travelling from city `P` to city `Q` which are `350` km apart. The line graph given below describes the distances of the car from the city `P` at different times .
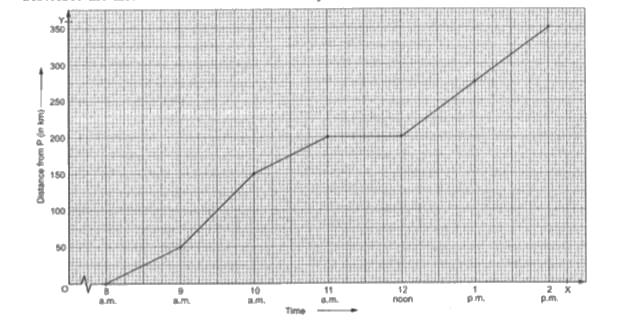
Study the above graph and answer the questions given below.
`(i)` What information is given on the two axes ?
`(ii)` From where and when did the car begin its journey ?
`(iii)` How far did the car go in the first hour ?
`(iv)` How far did the car go during `(a)` the `2nd` hour and `(b)` the `3rd` hour?
`(v)` Was the speed same during first three hours? How do you know it ?
`(vi)` Did the car stop for some duration at any place ? Justify your answer.
`(vii)` When did the car reach city `Q` ?
View SolutionA courter-person cycles from a town to a neighbouring suburban area to deliver a parcel to a merchant. His distances from the twon at different times are shown by the given graph.
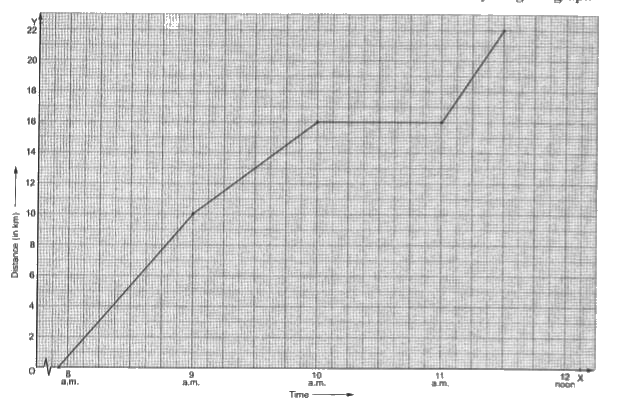
Study the above graph carefully and answer the questions given below:
`(i)` What is the scale taken for the time-axis?
`(ii)` How much time did the person take for the travel ?
`(iii)` How far is the place of the merchant from the town ?
`(iv)` Did the person stop on his way ? Explain.
`(v)` During which period did he ride fastest ?
View SolutionA man started his journey on his car from location A and came back. The graph given below shows his position at different times during the whole journey.
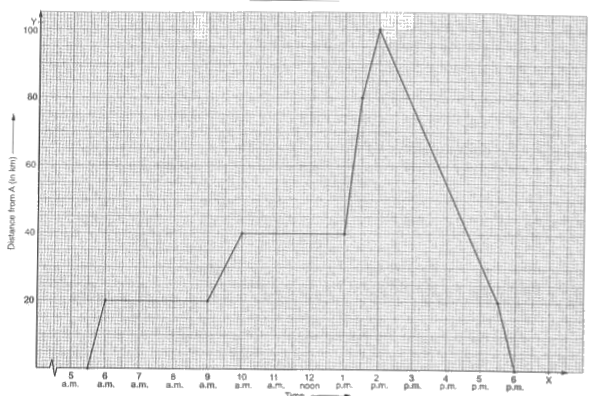
Study the above graph carefully and answer the questions that follow:
`(i)` At what time did he start and end his journey ?
`(ii)` What was the total duration of the journey ?
`(iii)` Which journey, onward or return, was of longer duration?
`(iv)` For how many hours did he not move ? `(v)` At what time did he have the fastest speed ?
View SolutionThe line graph given below shows the yearly sales figures for a manufacturing company during the last five years.
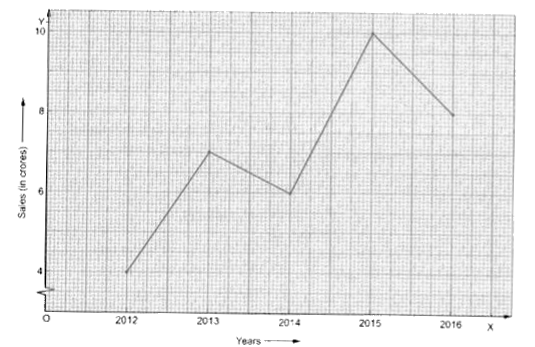
Study the above graph carefully and answer the questions given below :
`(i)` What are the sales in `(a) 2013` `(b) 2015` `(c ) 2016` ?
`(ii)` Compute the difference between the sales in `2012` and `2016` ?
`(iii)` In which year was there the greatest difference between the sales as compared to its previous year?
View SolutionThe following is the distance -time graph of Amit's walking.
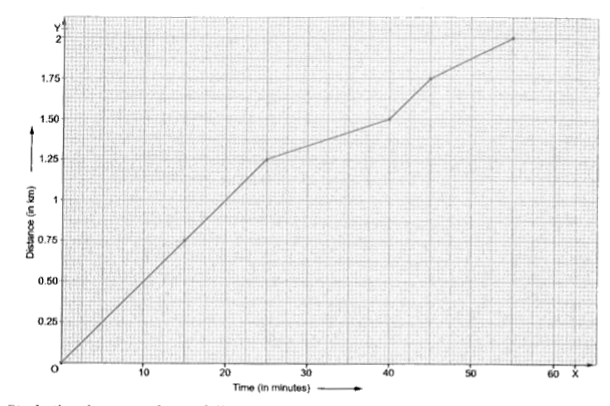
Study the above graph carefully and answer the questions given below :
`(i)` When does Amit make the least progress ? Explain your answer.
`(ii)` Find his average speed in km/hr.
View SolutionFor an experiment in botany, two different plants, plant A and B, were grown under similar laboratory conditions. Their heights were measured at the end of each week for three weeks. The results are shown by the line graph given below :
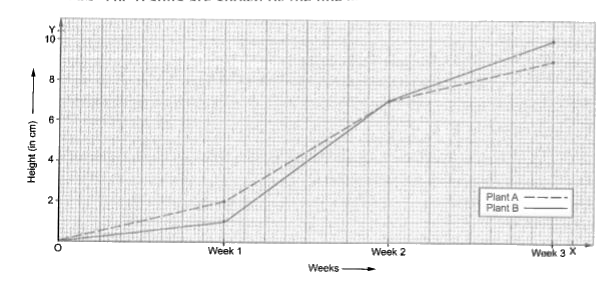
Study the above line graph carefully and answer the questions given below:
`(i)` How high was plant A after `(a) 2` weeks `(b) 3` weeks ?
`(ii)` How high was plant B after `(a) 2` weeks `(b) 3` weeks?
`(iii)` How much did plant A grow during the `3rd` week?
`(iv)` How much did plant B grow from the end of the `2nd` week to the end of the `3rd` week ?
`(v)` During which week did plant A grow most ?
`(vi)` During which week did plant B grow least ?
`(vii)` Were the two plants of the same height during any week shown here ? Specify.
View SolutionThe following line graph shows the change in temperature of a block of ice when heated.
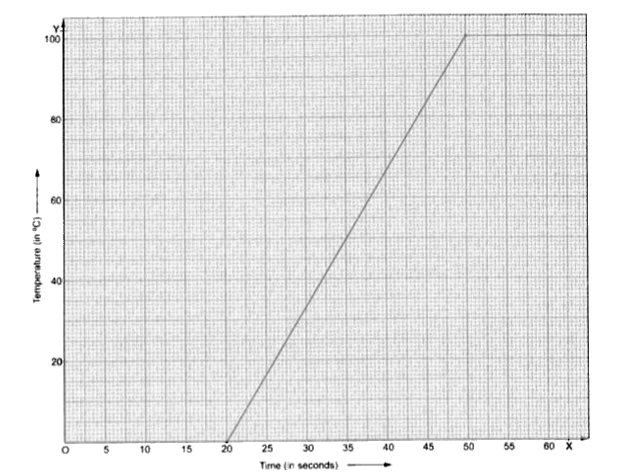
Study the above graph carefully and answer the questions given below :
`(i)` For how many seconds did the ice block have no change in temperature?
`(ii)` For how long was there a change in temperature?
`(iii)` After how many seconds of heating did the temperature become constant at `100^(@)C` ?
`(iv)` What was the temperature after `25` seconds?
`(v)` What will be the temperature after `1.5` minutes ? Justify your answer.
View SolutionThe following line graph shows the temperature forecast and the actual temperature for each day of a week.
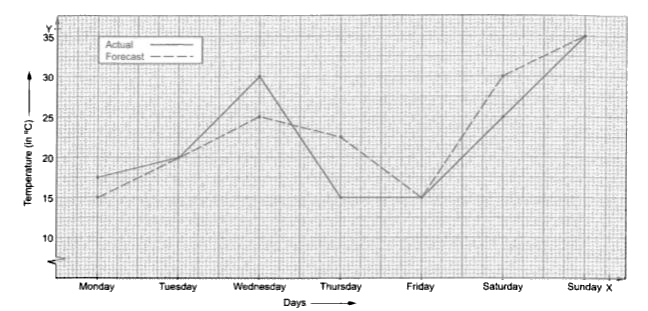
Study the above double line graph carefully and answer the questions given below:
`(i)` On which days was the forecast temperature the same as the actual temperature?
`(ii)` What was the maximum forecast temperature during the week ?
`(iv)` On which day did the actual temperature differ the most from the forecast temperature?
View SolutionThe following distance-time graph is for a car travelling to certain places.
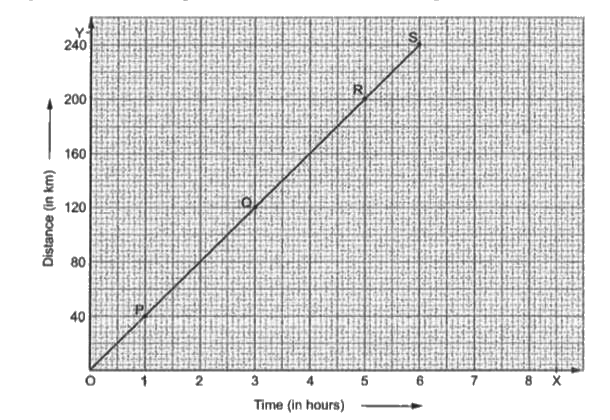
Study the above distance-time graph carefully and answer the questions given below :
`(i)` How far does the car travel in `4(1)/(2)` hours ?
`(ii)` Hou much time does the car take to reach `R` ?
`(iii)` How long does the car take to cover `80km`?
`(iv)` How far is `Q` from the starting point ?
`(v)` When does the car reach the place S after starting ?
View SolutionThe following line graph shows the journey made by two cyclists, cyclist `I` and cyclist `II`, one from town `B` to town `A` and the other from town `A` to town `B`.
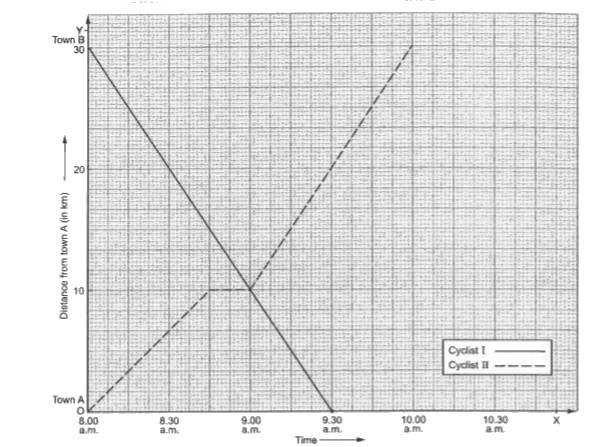
Study the above graph carefully and answer the questions given below :
`(i)` At what time did cyclist `II` rest ? For how long did the cyclist rest ?
`(ii)` Was cyclist `II` cycling faster or slower after the rest ?
`(iii)` At what time did the two cyclists meet ?
`(iv)` How far had cyclist `II` travelled when he met cyclist `I` ?
When cyclist `II` reached twon `B`, how far was cylist `I` from town `A` ?
View SolutionThe following table gives the distances travelled by a car at various time- intervals . Study the table and draw a linear graph for the same.

From your graph, answer the questions given below:
`(i)` How much distance did the car cover during the period from `7.30` a.m. to `8` a.m.
`(ii)` What was the time when the car had covered a distance of `100`km, since its start ?
`(iii)` How much distance had the car covered by `8.30` a.m. ?
View SolutionStudy the table given below and draw a line graph for it.

Is the graph drawn, a linear graph ?
View SolutionStudy the table given below and draw a line graph for it.

Is the graph drawn, a linear graph ?
View SolutionPlot a line graph for the variables `p` and `q`, where `p` is four times `q` i.e., the equation is `p=4q`.
Using the graph, find the value of `(i)p`, when `q=6` and `(ii) q` when `p=20`.
View SolutionPlot a line graph for the variables `x` and `y` , where `y=2x+1` .
Further, find the value of (i) `y` when `x=5` and (ii) `x` when `y=13`
View Solution(Principal and Simple Interest) A bank gives 10% Simple Interest (S.I.) on deposits by senior citizens. Draw a graph to illustrate the relation between the sum deposited and simple interest earned. Find from your graph (a) the annual interest obt
View Solution(Time and Distance) Ajit can ride a scooter constantly at a speed of 30 kms/hour. Draw a time-distance graph for this situation. Use it to find (i) the time taken by Ajit to ride 75 km. (ii) the distance covered by Ajit in
View SolutionExplain the situations represented by the following distance-time graphs :

View SolutionCan there be a temperature- time graph as follows ? Justify your answer.
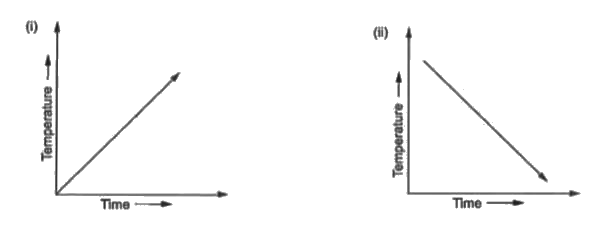
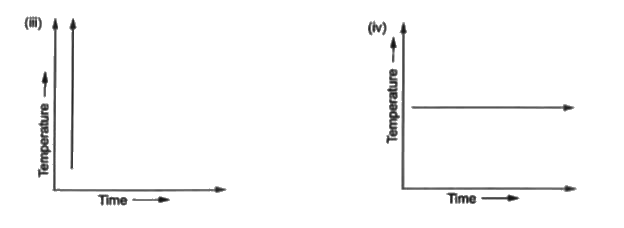
View Solution
Exercise 23 questions and complete solutions for chapter LINE GRAPHS AND LINEAR GRAPHS of RS AGGARWAL MATHS (HINGLISH) of Class 8