Complete Solutions to Problems From NCERT/exemplar of chapter STATISTICS of Class 9 book with complete answers and questions
| Class 9 | MATHS |
| Chapter | STATISTICS |
| NAGEEN PRAKASHAN | Problems From NCERT/exemplar |
| Number Of Questions | 22 |
| Academic Year | 2023-24 |
The distance (in km) of 40 engineers from their residence to their place of work were found as follows.

Construct a grouped frequency distribution table with calss- size 5 for the data given above taking the first interval as 0-5 (5 not included). What main features do you observe from this tabular representation?
View SolutionThe heights of 50 students, measured to the nearest centimetres have been found to be as follows:

(i) Represent the data given above by a grouped frequency distribution table, taking class intervals as 160-165, 165-170 etc.
(ii) What can you conclude about their heights from the table ?
View SolutionA study was conducted to find out the concentration of sulphur dioxide in the air in parts per million (ppm) of a certain city. The data obtained for 30 days is a follows :

(i) Make a grouped frequency distribution table for this data with class-intervals as `0.00-0.04, 0.04-0.08` and so on.
(ii) For how many day's was the concentration of sulphar dioxide more than 0.11 parts per million (ppm)?
View SolutionThe value of `pi` upto 50 decimal places is given below
3.14159265358979323846264338327950288419716939937510
(i) Make a frequency distribution of the digits from 0 to 9 after the decimal point.
(ii) What are the most and the least frequently occuring digits?
View SolutionGiven below are the seats won by different political parties in the polling outcome of a state assembly elections

(i) Draw a bar graph to represent the polling results.
(ii) Which political party won the maximum number of seats?
View SolutionThe length of 40 leaves of a plant measured correct to one millimetre and the obtained data is represented in the following table:

(i) Draw a histogram to represent the given data.
(ii) Is there any other suitable graphical representation for the same data?
(iii) Is it correct to conclude that the maximum number of leaves 153 mm long and why?
View SolutionThe following table gives the lifetimes of 400 neon lamps

(i) Represent the given information with the help of a histogram.
(ii) How many lamps have a lifetime of more 700 h?
View SolutionThe following table gives the distribution of students of two sections according to the marks obtained by them

Represent the marks of the students of both the sections on the same graph by two frquency polygons. From the two polygons compare the performance of the two sections.
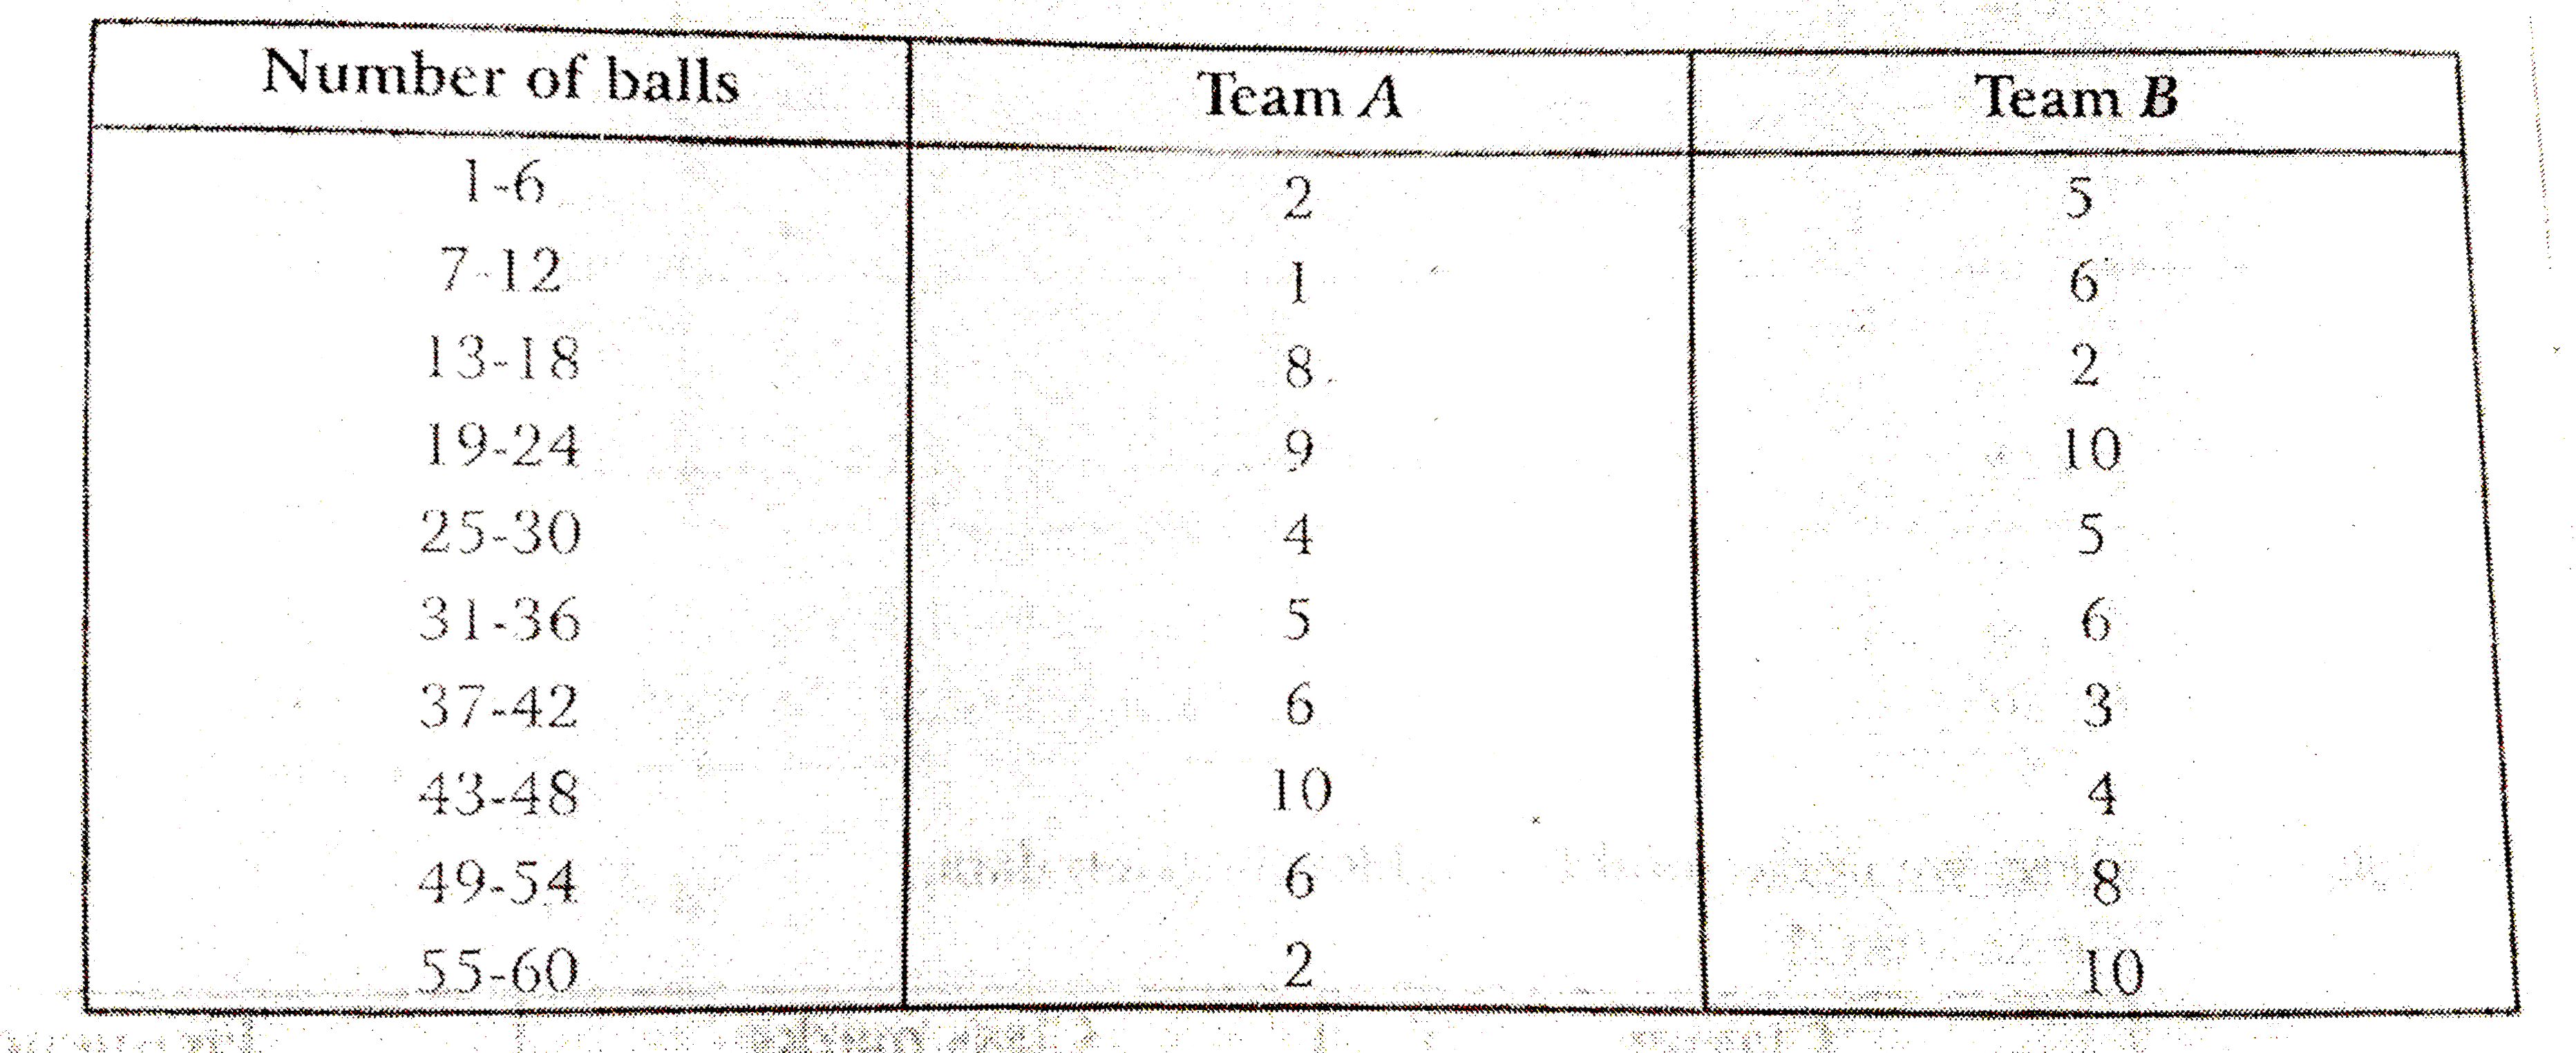
View SolutionThe runs scored by two teams A and B on the first 60 balls in a cricket match are given below:

Represent the data of both the teams on the same graph by frequency polygons.
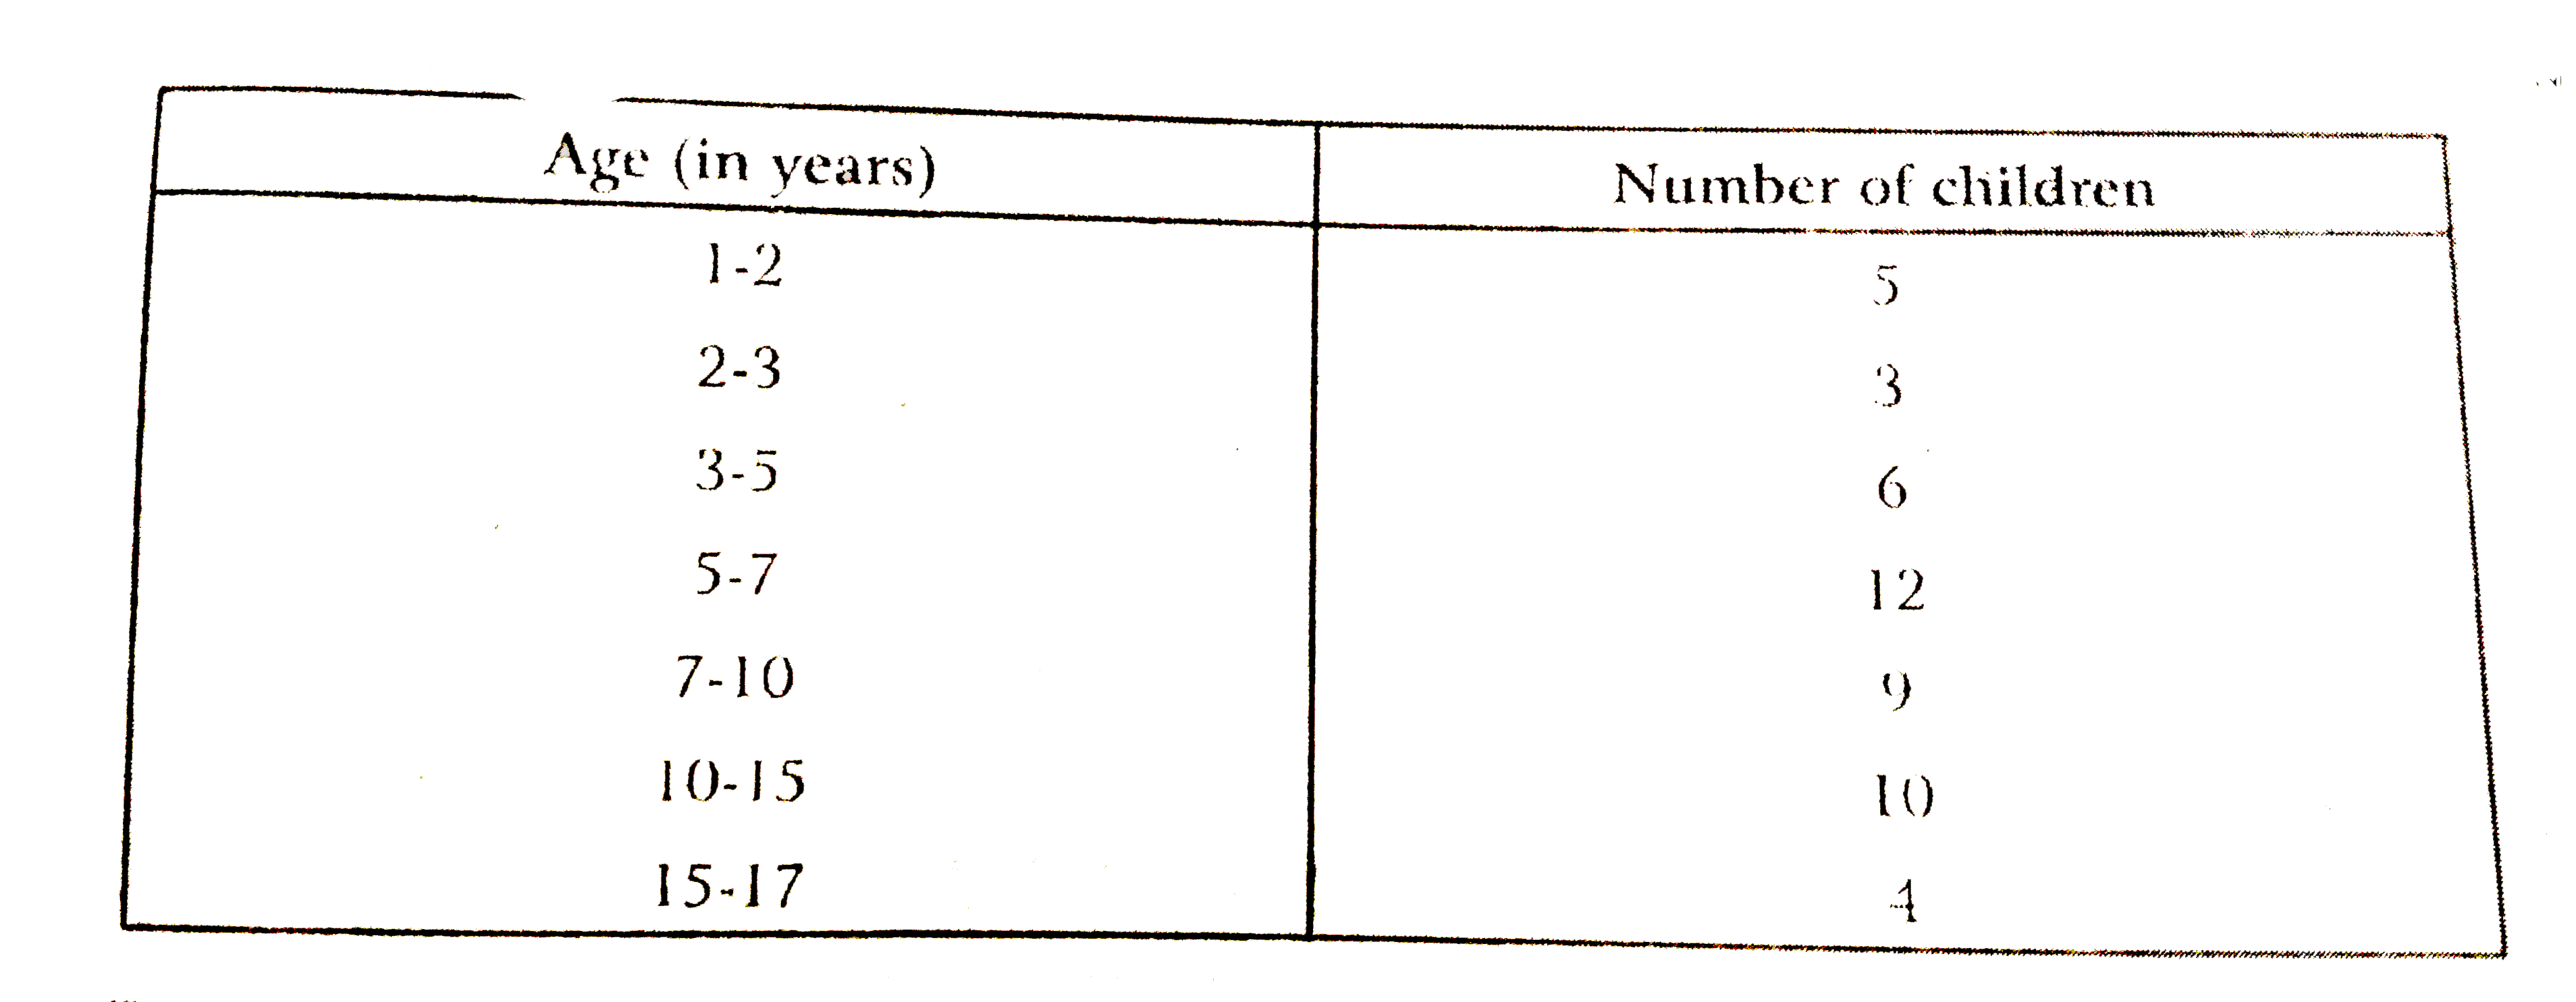
View SolutionA random survey of the number of children of various are groups playing in park was found as follows :

Draw a histogram to represent the data above.
View Solution`100` surnames were randomly picked up from a local telephone directory and a frequency distribution of the number of letter in English alphabet in the surnames was found as follows:

(i) Draw a histogram to depict the given information.
(ii) Write the class interval in which the maximum number of surnames lie.
View SolutionThe mean of five numbers is `30`. If one number is excluded, their mean becomes `28`. The excluded number is
View SolutionIf the mean of the observation `x, x+3, x+5, x+7` and `x+10` is `9`, then mean of the last three observations is
View SolutionThe mean deviation for `n` observations `x_1, x_2, , x_n` from their mean ` X ` is given by
View SolutionIf each observation of the data is increased by `5`, then their mean
View SolutionLet `barx` be the mean of `x_(1), x_(2), ………, x_(n)` and `bary` be the mean of `y_(1), y_(2),……….,y_(n)`. If `barz` is the mean of `x_(1), x_(2), ……………..x_(n), y_(1), y_(2), …………,y_(n)`, then `barz` is equal to
View SolutionIf `barx` is the mean of `x_(1), x_(2), …………., x_(n)`, then for `a ne 0`, the mean of `ax_(1), ax_(2),…….., ax_(n), x_(1)/a, x_(2)/a, ……….., x_(n)/a` is
View SolutionIf `barx_1,barx_2,barx_3,...barx_n` are the means of n groups with `n_1,n_2,n_3,....n_n` numbers of observations respectively. Than the mean `barx` of all group together is given by :
View SolutionThe mean of 100 observation is 50. If one of the observation which was 50 is replaced by 150, the resulting mean will be
View SolutionThere are 50 numbers. Each number is subtracted from 53 and the mean of the number so obtained is found to be `=3.5`. The mean of the given number is
View SolutionThe mean of 25 observation is 36. Out of these observations, if the mean of first 13 observations is 32 and that of the last 13 observations is 40, the 13th observation is
View SolutionThe marks obtained (out of 100) by a class of 80 students are given below:

Construct a histogram to represent the data above
View Solution
Problems From NCERT/exemplar questions and complete solutions for chapter STATISTICS of NAGEEN MATHS (HINGLISH) of Class 9