EXAMPLE from MBD INTRODUCTION OF GRAPHS. for Class 8
| Class 8 | MATHS |
| Chapter | INTRODUCTION OF GRAPHS. |
| MBD | EXAMPLE |
| Medium | English |
| Academic Year | 2023-2024 |
Question 15
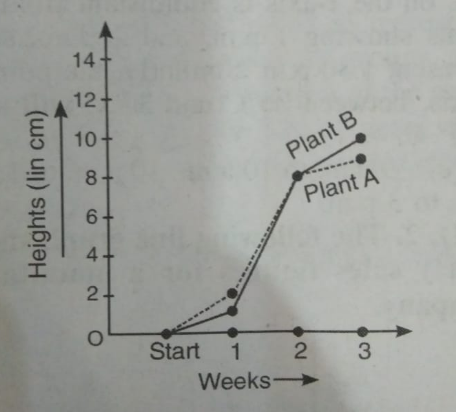
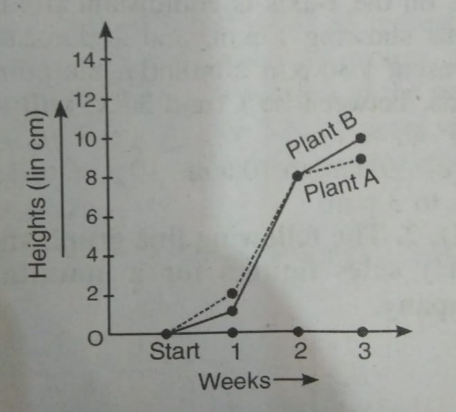
For an experiment in Botany,two different plants, plant A nad plant B were grown under similar laboratory conditions.Their heights were measured at the end of each week for 3 weeks.The results are shown by the following graph.
How much did Plant B grow from the end of the 2nd week to the end ofthe 3rd week?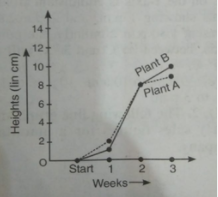 View Solution
Question 18
For an experiment in Botany,two different plants, plant A nad plant B were grown under similar laboratory conditions.Their heights were measured at the end of each week for 3 weeks.The results are shown by the following graph.
Were the two plants of the same height during any week shown here ?Specify.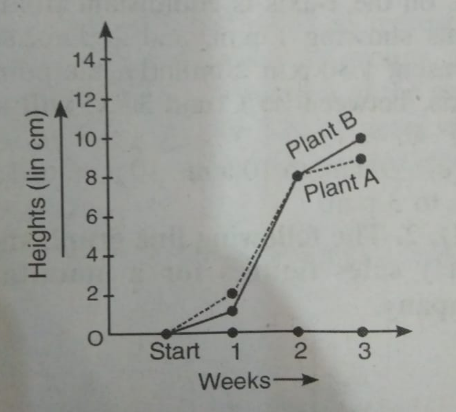 View Solution
